Comprehensive metabolome analyses reveal N-acetylcysteine-responsive accumulation of kynurenine in systemic lupus erythematosus: implications for activation of the mechanistic target of rapamycin
Andras Perl, Robert Hanczko, Zhi-Wei Lai, Zachary Oaks, Ryan Kelly, Rebecca Borsuk, John M. Asara, Paul E. Phillips

TL;DR
This study finds that N-acetylcysteine reduces kynurenine levels in lupus patients, which may help control the disease by affecting metabolic pathways.
Contribution
The study identifies kynurenine as an NAC-responsive metabolite linked to mTOR activation in lupus, offering new insights into lupus metabolism.
Findings
Kynurenine is a top predictor of SLE and is significantly reduced by NAC treatment.
Metabolome changes in lupus PBL show a strong impact on the pentose phosphate pathway.
Kynurenine stimulates mTOR activity in healthy cells, suggesting a role in lupus pathogenesis.
Abstract
Systemic lupus erythematosus (SLE) patients exhibit depletion of the intracellular antioxidant glutathione and downstream activation of the metabolic sensor, mechanistic target of rapamycin (mTOR). Since reversal of glutathione depletion by the amino acid precursor, N-acetylcysteine (NAC), is therapeutic in SLE, its mechanism of impact on the metabolome was examined within the context of a double-blind placebo-controlled trial. Quantitative metabolome profiling of peripheral blood lymphocytes (PBL) was performed in 36 SLE patients and 42 healthy controls matched for age, gender, and ethnicity of patients using mass spectrometry that covers all major metabolic pathways. mTOR activity was assessed by western blot and flow cytometry. Metabolome changes in lupus PBL affected 27 of 80 KEGG pathways at FDR p < 0.05 with most prominent impact on the pentose phosphate pathway (PPP). While…
Genes, proteins, chemicals, diseases, species, mutations and cell lines named across the full text — each resolved to its canonical identifier and authoritative record.
Click any figure to enlarge with its caption.
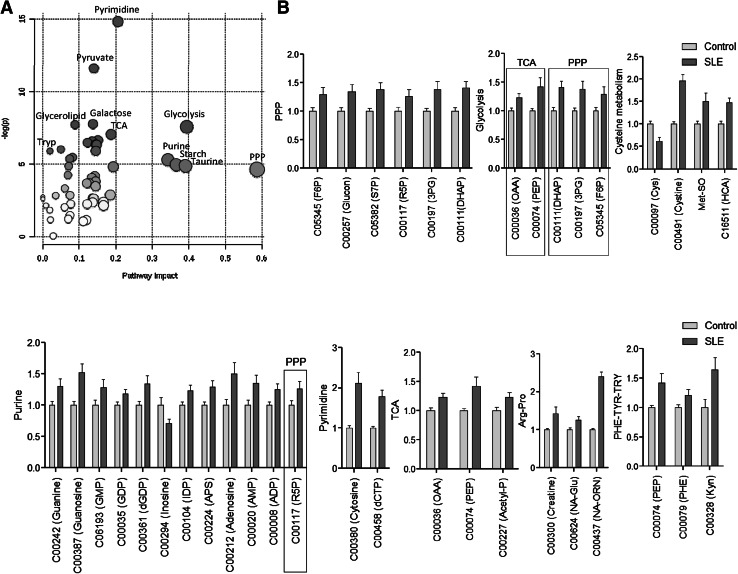 Figure 1
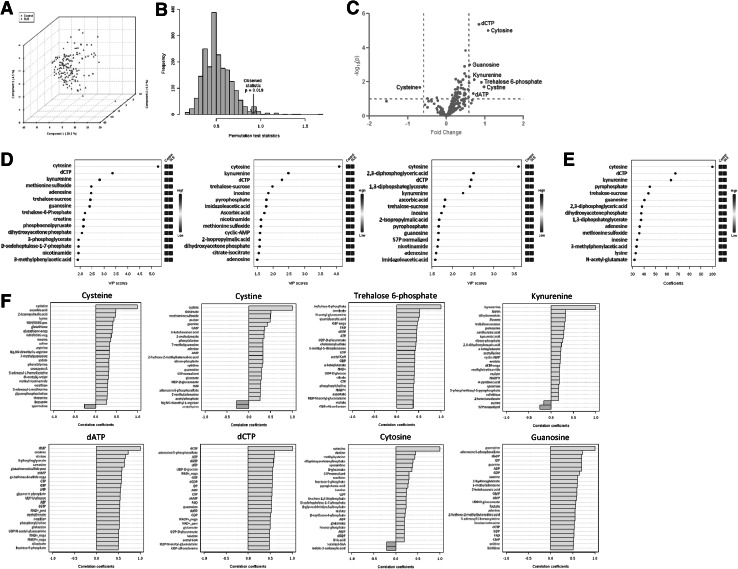 Figure 2
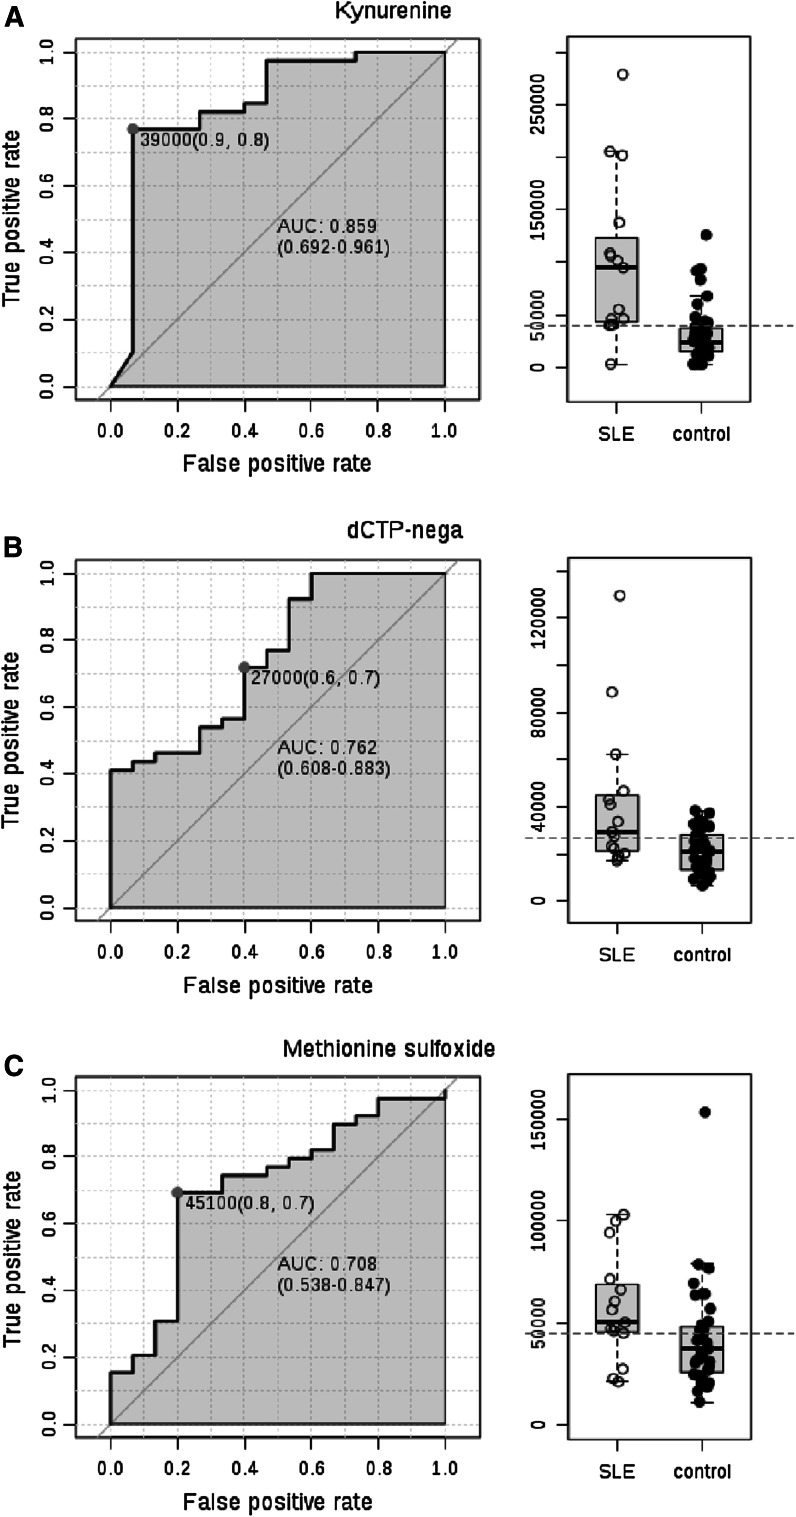 Figure 3
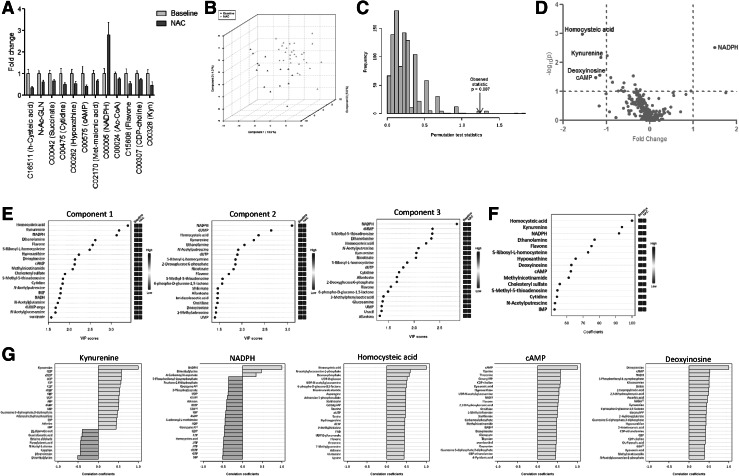 Figure 4
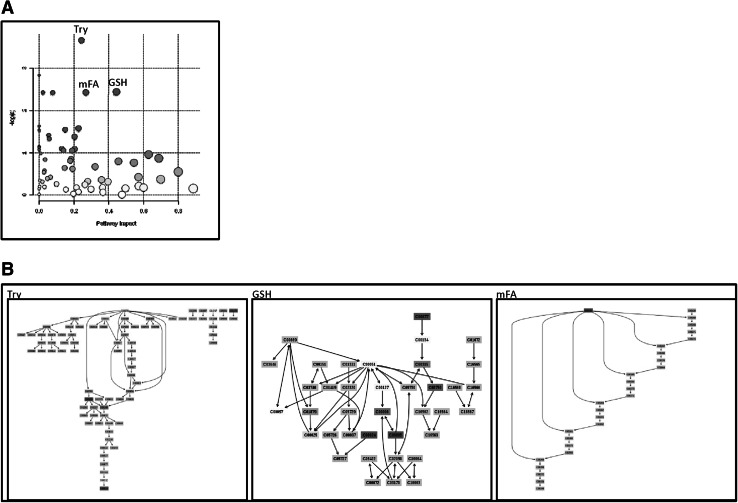 Figure 5
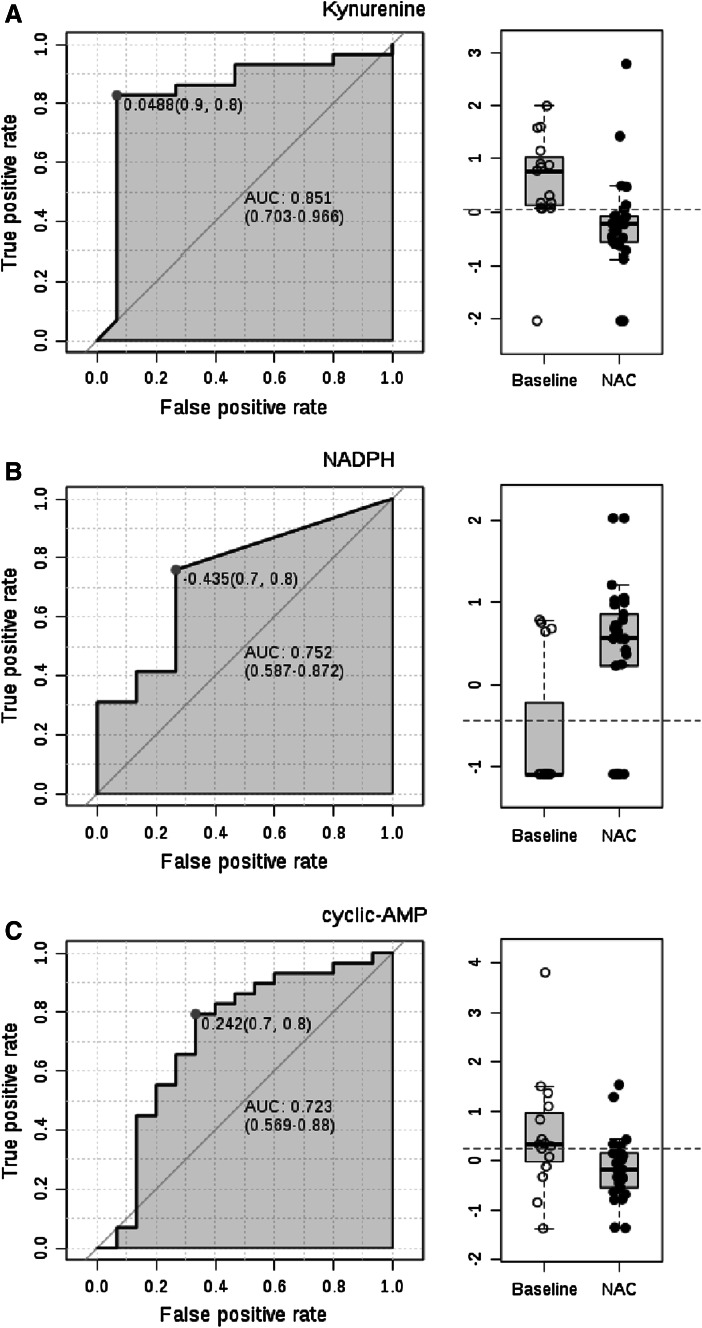 Figure 6
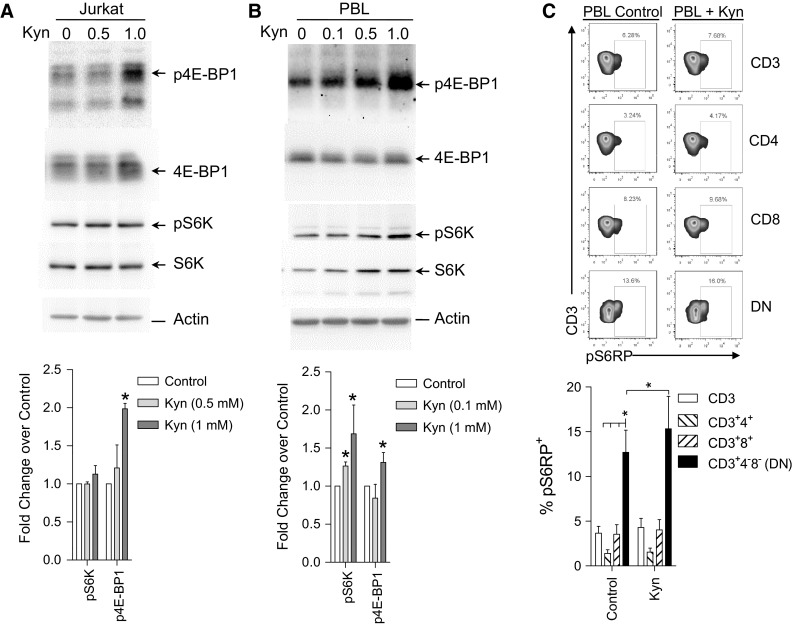 Figure 7
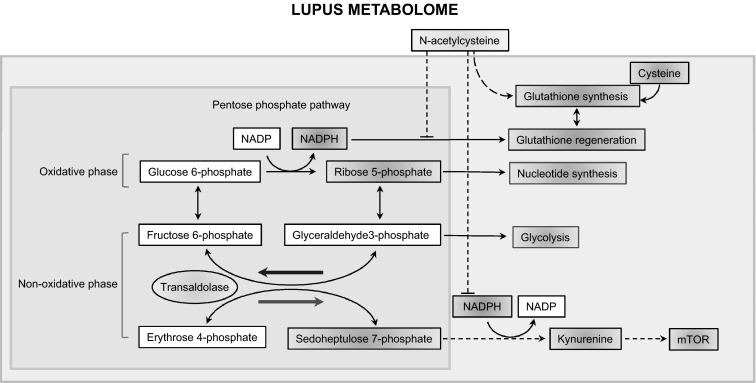 Figure 8
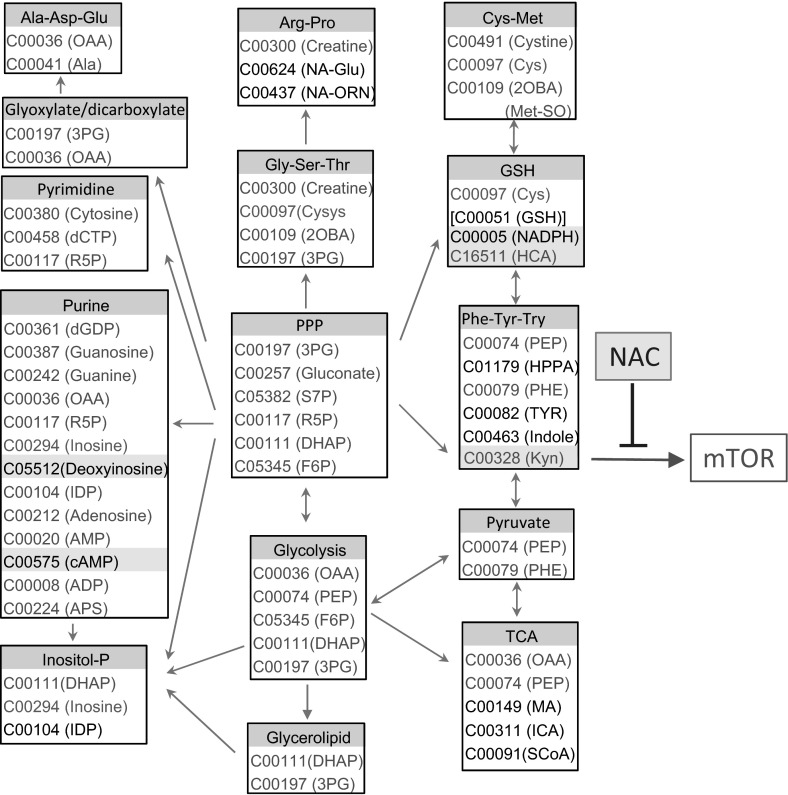 Figure 9
Peer Reviews
No public reviews on file for this paper yet. If you reviewed it on a platform where reviews are public (OpenReview, ICLR, NeurIPS, ICML), you can paste yours below so the community can read it here.
Videos
No videos yet. Explain this paper in a talk, walkthrough, or lecture? Add one.
Taxonomy
TopicsHistorical Geography and Cartography
Introduction
Systemic lupus erythematosus (SLE) is a potentially fatal autoimmune inflammatory disease of unknown etiology. Dysfunction of T and B cells drives anti-nuclear antibody production through the release of oxidized immunogenic nuclear materials from necrotic rather than apoptotic cells (Perl 2013). Importantly, lupus T cells exhibit mitochondrial dysfunction, which is characterized by elevated mitochondrial transmembrane potential (Δψ_m_) or persistent mitochondrial hyperpolarization (MHP) that mediates diminished activation-induced apoptosis and predisposes T cells to pro-inflammatory death via necrosis (Gergely et al. 2002; Lai et al. 2013). MHP is associated with increased O_2_ consumption and electron transport chain activity (Doherty et al. 2014), promoting the transfer of electrons to O_2_, thus resulting in the enhanced production of reactive oxygen intermediates (ROI), i.e. oxidative stress (Gergely et al. 2002), and the depletion of reduced glutathione (GSH) (Gergely et al. 2002). Both GSH depletion (Shah et al. 2011) and oxidative stress have been confirmed and implicated in T cells dysfunction in SLE (Li et al. 2014).
In turn, the mechanistic/mammalian target of rapamycin (mTOR) is a sensor of oxidative stress and regulator of T cell lineage specification (Chi 2012). As recently documented, N-acetylcysteine (NAC), a precursor of GSH and antioxidant in itself, reversed the depletion of GSH, and it also blocked mTOR activation and improved disease activity in SLE patients (Lai et al. 2012). However, NAC failed to moderate MHP and ROI production, suggesting that oxidative stress may not directly activate mTOR. Although mTOR is widely recognized as a global sensor and integrator of nutrient pathways (Kim et al. 2002), in particular amino acids, the individual metabolites have not been identified (Jewell et al. 2013). Here, we document global changes in the metabolome of peripheral blood lymphocytes (PBL) from SLE patients in comparison to healthy controls matched at each blood donation for patients’ age within 10 years, gender, and ethnicity. Metabolome changes in lupus PBL were most prominently impacted by the pentose phosphate pathway (PPP). Oxidative stress was evidenced by the depletion of cysteine and the increased levels of cystine and methionine sulfoxide (Met-SO). Area under the receiver operating characteristic (ROC) curve (AUC) logistic regression approach identified the amino acid kynurenine (Kyn) to have the greatest specificity and sensitivity for distinguishing the metabolomes of lupus and control PBL. NAC treatment reduced Kyn, while it enhanced NADPH levels in PBL of SLE patients in vivo. Moreover, Kyn induced mTOR activation in T cells in vitro. This study thus identifies Kyn accumulation as a potential contributor to mTOR activation and metabolic target of the therapeutic action by NAC in patients with SLE.
Methods
Human subjects
36 SLE patients enrolled in double-blind placebo-controlled treatment trial with N-acetylcysteine (NAC) were investigated. This study has been approved by the Food and Drug Administration (IND No: 101,320; clinicaltrials.gov identifier: NCT00775476). The clinical trial design, eligibility criteria, randomization, blinding, monitoring of safety, tolerance and efficacy on NAC in patients with SLE was recently documented (Lai et al. 2012). SLE disease activity was assessed using the British Isles Lupus Assessment Group (BILAG) (Isenberg et al. 2005) and systemic lupus erythematosus disease activity index (SLEDAI) (Hochberg 1997). Fatigue was estimated using the fatigue assessment scale (FAS) (Michielsen et al. 2003).
The mean (±SEM) age of patients was 44.6 (±1.8) years, ranging between 25 and 64 years, as earlier described (Lai et al. 2012). 34 patients were females including 30 Caucasians, two African-Americans, and two Hispanic. 2 patients were Caucasian males. 42 healthy subjects were individually matched for each patient blood donation for age within ten years, gender, and ethnic background and freshly isolated cells were studied in parallel as controls for immunological studies. The mean (±SEM) age of controls was 44.4 (±1.7) years, ranging between 22 and 63 years. 39 controls were females including 36 Caucasians, two African-Americans, and one Hispanic. 3 controls were Caucasian males. SLE patients were randomized to receive either placebo or NAC in one of three treatment arms of increasing doses: 600, 1,200, or 2,400 mg twice daily for 3 months. 12 patients were enrolled per dosing group, 9 received NAC while 3 received placebo. For each patient visit, we obtained blood from healthy donors matched for age (within one decade), gender, and ethnicity, to be used as a control for flow cytometry measurement of mitochondrial function, gene expression, and metabolite analysis. Each patient provided five blood samples for metabolomic studies (visit 1/pretreatment, visit 2/after 1 month treatment, visit 3/after 2 months treatment, visit 4/after 3 months treatment, visit 5/after 1 month washout). 42 healthy controls have also donated blood to use as control for flow cytometry of live cells as well as for the metabolomic, gene expression and signaling studies.
Metabolyte measurements by LC–MS/MS
5 × 10^6^ monocyte-depleted peripheral blood lymphocytes (PBL) were washed in PBS, resuspended in 100 µl of 80 % methanol (−80 °C). After freezing at −80 °C and thawing once, the sample was centrifuged at 13,000 x g for 30 min at 4 °C, and 100 µl of supernatant was saved. A 2nd 100 µl of 80 % methanol (−80 °C) was added to the pellet, the sample was vortexed, centrifuged at 13,000×g for 30 min at 4 °C, and the 2nd 100 µl of supernatant was saved. The two 100-µl supernatants were combined, dried in a SpeedVac (Savant AS160, Farmingdale, NY), and stored −80 °C until analysis. Each sample was resuspended in 20 μl of LC/MS grade water and 10 μl per sample was injected into a 5500 QTRAP, a hybrid triple quadrupole/linear ion trap mass spectrometer, using a quantitative polar metabolomics profiling platform with selected reaction monitoring (SRM) that covers all major metabolic pathways. The platform uses hydrophilic interaction liquid chromatography with positive/negative ion switching to analyze 258 metabolites (289 Q1/Q3 transitions) from a single 15-min targeted liquid chromatography–tandem mass spectrometry (LC–MS/MS) acquisition with a 3-ms dwell time and a 1.55-s duty cycle time (Yuan et al. 2012).
A healthy subject matched for age within 10 years, gender, and ethnicity was recruited upon each patient visit. The blood samples of patients and matched controls were processed in parallel on ice, stored in parallel at −80 °C until injected in the same run for LC–MS/MS analysis.
Metabolic pathway and statistical analyses
Quantitative enrichment analysis of 258 detected metabolites was utilized for pathway analysis employing the web-based MetaboAnalyst 2.0 software (Xia and Wishart 2011). Upon each patient visit, a healthy subject matched for age within 10 years, gender, and ethnicity was recruited. The blood samples were processed in parallel. The patients and matched healthy subjects were injected in the same run. The signal stability was assured by normalizing the controls between runs to the sum of all signals between separate runs using Metaboanalyst (Xia and Wishart 2011). The enrichment analysis was based on global analysis of covariance (Ancova). A Google-map style interactive visualization system was utilized for data exploration and creation of a 3-level graphical output: metabolome view, pathway view, and compound view. The ‘metabolome view’ shows all metabolic pathways arranged according to the scores from enrichment analysis (y axis: −log p) and from topology analysis (x axis: impact: number of detected metabolites with significant p value) (Xia and Wishart 2011). The matched metabolites are highlighted according to their Holm p values. The Holm p is the p value adjusted by Holm-Bonferroni method (Holm 1979). The pathway topology analysis used two well-established node centrality measures to estimate node importance: degree centrality and betweeness centrality. Degree centrality depends on the number of links connected to a given node. For directed pathway graphs, there are two types of degrees: in-degree for links came from other nodes, and out-degree for links initiated from the current node. Here, we only considered the out-degree for node importance measure. Upstream nodes are considered to have regulatory roles for the downstream nodes, and not vice versa. The betweeness centrality measures the number of shortest paths going through the node. Since metabolic networks are directed, we use relative-betweeness centrality for a metabolite importance measure (Tuikkala et al. 2012). The degree centrality measures focus more on local connectivities, while the betweeness centrality measures focus more on global network topology. The node importance values calculated from centrality measures were further normalized by the sum of the importance of the pathway. Therefore, the total/maximum importance of each pathway reflects the importance measure of each metabolite node that is actually the percentage relative to the total pathway importance, and the pathway impact value is the cumulative percentage from the matched metabolite nodes. The altered compounds have been grouped and presented together for each pathway.
The impact of NAC on metabolic changes relative to placebo was investigated by performing a two-factor (NAC versus placebo) time series analysis (changes relative to baseline/visit 1) within individual subjects. Two-way within-subject ANOVA was performed, and the interaction of drug with time was analyzed by comparing data acquired after treatment for 1 month (visit 2), 2 months (visit 3), and 3 months (visit 4) relative to baseline (visit 1). Using MetaboAnalyst, we also performed ANOVA-simultaneous component analysis (ASCA), which is a multivariate extension of ANOVA. It is designed to identify the major patterns associated with each factor. This implementation supports the ASCA model for two factors with one interaction effect. The algorithm first partitions the overall data variance (X) into individual variances induced by each factor (A and B), as well as by the interactions (AB). The formula is shown below with (E) indicates the residual Errors: X = A + B + AB + E. The SCA part applies principal component analysis (PCA) to A, B, AB to summarize major variations in each partition. The significant variables are identified based on the leverage and the squared prediction errors (SPE) associated with each variables. Variables with low SPE and higher leverage are modeled well after the major patterns. Pre-treatment samples obtained at visit 1 were also compared to samples obtained at visits 2–4 during biologically and clinical effective administration of NAC at doses of 2.4 and 4.8 g/day by ANCOVA.
Metabolite concentrations were evaluated for their ability to discriminate between SLE and control subjects by partial least squares-discriminant analysis (PLS-DA) using MetaboAnalyst (Xia and Wishart 2011). PLS is a supervised method that uses a multi-variate regression technique to extract via linear combination of metabolites (X) the information that can predict the subject group membership (Y). The classification and cross validation were performed using the wrapper function offered by the caret package in MetaboAnalyst software (Xia and Wishart 2011). In order to assess that the class discrimination is statistically significant, a permutation test was performed. In each permutation, a PLS-DA model was built between the data (X) and the permuted class labels (Y) using the optimal number of components determined by cross validation for the model based on the original class assignment. The ratio of the between sum of the squares and the within sum of squares (B/W-ratio) for the class assignment prediction of each model was calculated. PLS-DA models were validated by permutation test p value <0.05. Contribution of individual metabolites to PLS-DA was assessed by variable importance in projection (VIP) and coefficient scores.
Individual compounds were also compared between control and lupus PBL by paired or unpaired t-test with Welch’s correction using Prism software (GraphPad, San Diego, CA). Pearson’s correlations of normalized metabolite concentrations with disease activity and flow cytometry parameters were determined with MetaboAnalyst and Prism. Areas under the receiver operating characteristic (ROC) curve (AUC) logistic regression approach was used for evaluating the specificity and sensitivity of individual metabolites and metabolite ratios for distinguishing lupus and control PBL as well as NAC-treated and untreated lupus PBL.
Western blot analyses
Whole cell protein lysates were prepared by lysis in radio-immunoprecipitation assay buffer (150 mM NaCl, 2 % NP-40, 0.5 % sodium deoxycholate, 0.1 % SDS, 50 mM Tris pH 8.0, 1 mM PMSF, 1 μg/ml aproptinin, 1 μg/ml pepstatin, 1 μg/ml leupeptin, 1 mM NaF, 1 mM sodium orthovanadate, 0.1 mM sodium molybdate, 10 mM sodium pyrophosphate) at a density of 4 × 10^7^ cells/ml on ice, followed by addition of equal volumes of Laemmli protein sample buffer (60 mM Tris–Cl pH 6.8, 2 % SDS, 10 % glycerol, 5 % β-mercaptoethanol, 0.01 % bromophenol blue) and heated to 95 °C for 5 min prior to separation on SDS-PAGE gels and transfer to 0.45 μm nitrocellulose membranes. 4E-BP1 (4E-BP1; Cat no 9644) and phospho-4E-BP1 (p4E-BP1 Thr 37/46, Cat no 2855) antibodies were obtained from Cell Signaling. p70 S6 kinase (S6 K, Cat no sc-8418) and phospho-p70 S6 kinase (pS6K Thr 389, Cat no sc-8416) were from Santa Cruz Biotechnology. Reactivity to primary antibodies was detected with horseradish peroxidase-conjugated secondary antibodies (Jackson, West Grove, PA) and visualized by enhanced chemiluminescence (Western Lightning Chemiluminescence Reagent Plus, GE Health Care/PerkinElmer Life Sciences, Inc., Boston, Massachusetts). Automated densitometry was used to quantify the levels of mTOR substrate protein expression relative to β-actin using a Kodak Image Station 440CF with Kodak 1D Image Analysis Software (Eastman Kodak Company, Rochester, NY).
Flow cytometry detection of mTOR activity
PBL from eight healthy subjects were incubated with kynurenine (Kyn, 0.05, 0.1, 0.5, and 1), l-homocysteic acid (HCA, 100, 500 μM, 1 mM, 5 mM) and dibutyryl cAMP (db-cAMP, 500 μM) for 24 h. Tryptophan was used as a control amino acid (100 μM, 1 mM, 10 mM). All chemicals were obtained from Sigma (St. Louis, MO).The effect of these metabolites on mTOR activity was measured via phosphorylation S6RP (Lai et al. 2012). T-cell subsets were analyzed by staining with antibodies to CD4, CD8, and CD25. For detection of mTOR activity and FoxP3 expression, cells were permeabilized with Cytofix/CytopermPlus (eBiosciences) and stained with AlexaFluor-488-conjugated antibody to pS6RP (Cell Signaling; Beverly, MA; Cat. No. 4851) and AlexaFluor-647-conjugated antibody to FoxP3 (BioLegend, San Diego, CA; Cat No 320014), as earlier described (Lai et al. 2012).
Results
Metabolome analysis reveals dominant impact of SLE on the pentose phosphate pathway, nucleotide, cysteine, and kynurenine metabolism
Quantitative enrichment analysis of 258 measured metabolites revealed robust changes in the metabolome of SLE patients’ PBL relative to those of healthy controls matched for age within 10 years, gender, and ethnic background. The metabolome changes affected 27 of 80 pathways in the KEGG database at false discovery rate (FDR) p value <0.05, with the most prominent impact on the pentose phosphate pathway (PPP, Fig. 1a, Fig. S1 and Table 1). The pathway changes were driven by the accumulation of 32 among 34 metabolites altered in lupus PBL (Fig. 1b) 0.11 of these metabolites are involved in multiple pathways, with 4/11 being substrates in the PPP (Fig. 1b). After the PPP, glycolysis, starch (carbohydrate), taurine, as well as purine and pyrimidine metabolism were the most affected pathways (Table 1). Only 2 metabolites were depleted, cysteine and inosine. Cysteine is a substrate of 6 pathways affected by SLE: GSH, taurine, thiamine, Gly-Ser-Thr, Cys-Met, and sulfur metabolism (Fig. S1). Moreover, we also observed the accumulation of kynurenine (Kyn), which is a product of tryptophan catabolism (Aune and Pogue 1989) and regulator of the PPP (Fabregat et al. 1987).Fig. 1. Metabolic pathway analysis of quantitative changes in compound concentrations in PBL samples of 36 SLE patients relative to 42 healthy subjects matched for age within 10 years, gender, and ethnic background. a The ‘metabolome view’ shows all 80 KEGG metabolic pathways arranged according to the scores from enrichment analysis (y axis: −log p) and topology analysis (x axis: impact: number of detected metabolites in a pathway with significant p values). b Metabolites with altered levels in lupus PBL relative to matched healthy control PBL normalized to 1.0 for each compound. 6 of 34 altered metabolites can enter multiple pathways: 4 of such 6 metabolites are substrates in the PPP, while 2 metabolites are common with the TCA. Only 2/34 altered metabolites were depleted, cysteine and inosine Table 1. Metabolome effects of lupus by quantitative enrichment analysis of 209 metabolites in PBL of SLE patients in comparison to those of healthy controls matched for age within 10 years, gender, and ethnic backgroundTotalHitsRaw p−LOG (p)FDR pImpactPentose phosphate pathway (PPP)32140.00975814.62970.0226210.58698Glycolysis31110.00052557.55110.0053610.39538Taurine and hypotaurine2040.0077024.86630.0197560.39131Starch and sucrose5070.00709294.94870.0197560.36587Purine metabolism92200.00504015.29030.015120.34287Pyrimidine metabolism60103.73E−0714.81.90E−050.2062Phenylalanine, tyrosine and tryptophan biosynthesis2770.00813464.81160.0197560.19356Citrate cycle (TCA cycle)2050.00087947.03620.0074750.1875Glyoxylate and dicarboxylate metabolism5050.00133186.62120.0083820.15152Cysteine and methionine metabolism5650.00180786.31560.0083820.14815Arginine and proline metabolism7770.00178126.33050.0083820.14563Nicotinate and nicotinamide metabolism4440.00274615.89760.010090.14545Glutathione metabolism3860.0222293.80640.0436020.14517Alanine, aspartate and glutamate metabolism2430.0153044.17970.032520.14286Pyruvate metabolism3269.36E−0611.5790.0002390.14035Galactose metabolism4160.00043297.7450.0053610.13792Glycine, serine and threonine metabolism4880.00141716.55910.0083820.1356Nitrogen metabolism3970.0174044.05110.0355040.13461Phenylalanine metabolism4530.0246123.70450.0454650.12727Glycerophospholipid metabolism3940.00155636.46540.0083820.12329Pantothenate and CoA biosynthesis2740.0249613.69040.0454650.12121Glycerolipid metabolism3250.00045217.70150.0053610.08888Fructose and mannose metabolism4840.00429465.45040.0146020.08197Sulfur metabolism1830.00472125.35570.0150490.07407Tryptophan metabolism7920.00778694.85530.0197560.07142Thiamine metabolism2420.014354.2440.0318190.06896Pentose and glucuronate interconversions5350.00246156.0070.010090.05001The metabolome changes affected 27 of 80 pathways in the KEGG database at false discovery rate (FDR) p value <0.05. The pathways are arranged by the relative impact of the number of metabolites affected and their node of importance (Xia et al. 2012)
Partial least squares-discriminant analysis (PLS-DA) of metabolite concentrations discriminated between lupus and control PBL (Fig. 2a), as validated by permutation test p value < 0.001 (Fig. 2b).Three component matrices accounted for 20.2, 6.9, and 4.5 % of the total variance (Fig. 2a). Top contributors to the PLS-DA included nucleotides and their amino acid and PPP sugar precursors. Individually, cytosine, dCTP, guanosine, cystine, and Kyn were the most increased while cysteine was the most depleted metabolite in lupus PBL (Fig. 2c).These metabolites were the greatest contributors to PLS-DA components 1–3 based on both variable importance in projection (VIP) (Fig. 2d) and coefficient scores (Fig. 2e). The pyrimidine nucleotide cytosine, dCTP, and Kyn had the top VIP and coefficient scores (Fig. 2d, e). Although methanol extraction, which was utilized to process cell extracts for LC–MS/MS studies, was not sensitive for detection of GSH, oxidative stress was evidenced by the depletion of cysteine and the accumulation of cystine and Met-SO (Fig. 1b, c). Correlation analysis with metabolites exhibiting dominant changes between lupus and control PBL (Fig. 2c) unveiled additional trends of oxidative stress, such as positive correlations of cysteine with ascorbate, GSH, and GSH/GSSG ratio (Fig. 2f).Fig. 2. Partial least squares-discriminant analysis (PLS-DA) of metabolite concentrations in lupus and control PBL. Samples obtained from 36 lupus patients before initiation of treatment with NAC, e.g. Visit 1, were compared to samples from 42 healthy subjects processed in parallel. a 3-dimensional score plot of PLS-DA using components 1, 2, and 3, accounting for 20.2, 6.9, and 4.5 % of the total variance. b Validation of PLS-DA by permutation test p value <0.001. c Volcano plot is a combination of fold change (FC, log_2_ FC: X axis) and t test p values (−log10 p: Y axis). d Variable importance in projection (VIP) scores of 15 top contributors to PLS-DA components 1–3. e Coefficient-based importance measures of top 15 contributors to components 1–3. f Correlation plot showing the compounds as horizontal bars, with colors in light pink indicating positive correlations and those in light blue indicating negative correlations with top lupus-associated metabolites identified in the volcano plot (c). Values reflect Pearson’s correlation coefficients between metabolite concentrations at FDR p < 0.05 calculated by MetaboAnalyst (Color figure online)
Area under the receiver operating characteristic (ROC) curve (AUC) logistic regression approach identified Kyn (AUC = 0.859), dCTP (AUC = 0.762), and Met-SO (AUC = 0.708) to have the greatest specificity and sensitivity for distinguishing the metabolomes of lupus and control PBL (Fig. 3).Fig. 3. Discrimination of the metabolome of lupus and control PBL based on area under the receiver operating characteristic (ROC) curve (AUC) logistic regression approach. For each of the top three discriminating metabolites, the left panel shows the AUC confidence interval, true positive and false positive rates, and confidence interval (CI), the right panel shows the concentrations of metabolites in PBL before (baseline) and during NAC treatment (NAC). AUC logistic regression approach identified Kyn (AUC = 0.859), dCTP (AUC = 0.762), and Met-SO (AUC = 0.708) to have the greatest specificity and sensitivity for distinguishing the metabolome of lupus and control PBL
Correlation of metabolite concentrations with disease activity
Concentrations of 18, 16, and 32 compounds showed significant correlation at FDR p < 0.05 with SLEDAI (Table 2), BILAG (Table 3), and FAS disease activity scores in 36 SLE patients unexposed to NAC (Table 4), respectively. 9 compounds showed correlation with all three disease activity scores: dihydroxy-acetone-phosphate (DHAP), oxaloacetate (OAA), glucose 1-phosphate (G1P), hexose-phosphate, deoxyribose-phosphate, uracil, acetoacetate, geranyl pyrophosphate (GPP), and indole-3-carboxylic acid. DHAP connects the PPP while OAA connects the TCA with glycolysis. Glucose-1-phosphate is generated during glycogenolysis. It can be converted into G6P for metabolism through the PPP or glycolysis (Mayes 1993). Hexose-phosphate and deoxyribose-phosphate represent structural isomers of compounds that are involved in the PPP, glycolysis, and nucleotide metabolism. Acetoacetate is the product of amino acid and fatty acid catabolism. GPP is an intermediate towards the biosynthesis of farnesyl pyrophosphate, geranylgeranyl pyrophosphate, and cholesterol (Holstein and Hohl 2004). Rab GTPases require geranylgeranyl pyrophosphate to attach to endosomes and to regulate endosome traffic, which is increased in lupus T cells (Fernandez et al. 2009).Table 2. Correlation of metabolite concentrations with SLEDAI in PBL of 36 lupus patients that have not been exposed to NACCorrelationt-statp valueFDRSLEDAI1Inf00BILAG0.770748.88923.72E−124.41E−10 DHAP 0.531544.61142.49E−050.00197 Hexose-phosphate 0.492394.15720.0001160.005688Betaine0.491444.14660.000120.005688 Oxaloacetate 0.485064.0760.0001510.00598 Deoxyribose-phosphate 0.472523.93990.0002360.007987 G1P 0.463693.84590.0003190.0094552-oxobutanoate0.456473.77010.0004060.010696 Acetoacetate 0.42893.48890.0009730.023066 Acetylphosphate 0.415313.35490.0014580.031419P-hydroxybenzoate0.409333.29680.0017330.0342281,3-diphopshateglycerate0.40243.23010.0021090.038445 Uracil 0.398683.19450.0023390.03907UDP-N-acetyl-glucosamine−0.39667−3.17540.0024730.03907Spermine0.389163.10450.0030330.044928 GPP 0.386123.0760.003290.0458717-methylguanosine−0.38033−3.02190.0038350.048726Xanthine0.379343.01280.0039350.048726 Indole-3-carboxylic acid 0.377652.99710.0041120.048726Compounds in italics correlated at FDR p < 0.05 with SLE, BILAG, and FAS scores Table 3. Correlation of metabolite concentrations with BILAG in PBL of 36 lupus patients that have not been exposed to NACCorrelationt-statp valueFDRBILAG1Inf00SLEDAI0.770748.88923.72E−124.41E−10 Acetylphosphate 0.523774.51833.43E−050.002459 Deoxyribose-phosphate 0.519094.46284.15E−050.002459 Hexose-phosphate 0.50064.24958.52E−050.004041NADP0.487764.10580.0001370.005423 GPP 0.478474.00410.0001920.005973 Uracil 0.477023.98840.0002020.005973 G1P 0.467383.88490.0002820.00722 DHAP 0.464333.85270.0003120.00722Flavone0.461183.81940.0003470.00722Pyrophosphate0.459653.80330.0003660.00722 Indole-3-carboxylic acid 0.45463.75050.0004320.007877 Acetoacetate 0.406593.27030.0018740.029561Glycolate0.403953.2450.0020190.029561Asparagine−0.40296−3.23540.0020760.029561 Oxaloacetate 0.40223.22820.002120.029561dATP−0.39857−3.19350.0023460.03089Compounds in italics correlated at FDR p < 0.05 with SLE, BILAG, and FAS scores Table 4. Correlation of metabolite concentrations with FAS fatigue scores in PBL of 36 lupus patients that have not been exposed to NACCorrelationt-statp valueFDRFAS13.49E+0800SLEDAI0.698587.17442.15E−092.56E−07BILAG0.616665.75634.18E−073.33E−05 Dihydroxy-acetone-phosphate 0.597135.47031.19E−067.09E−05 Oxaloacetate 0.578325.20933.04E−060.000145 Acetoacetate 0.570985.11084.32E−060.000172Flavone0.563375.01086.17E−060.0002112,3-Diphosphoglyceric acid0.531544.61132.49E−050.000745 Indole-3-carboxylic acid 0.528394.57352.84E−050.000755Quinolinate0.522414.50213.63E−050.0008531,3-diphopshateglycerate0.520464.47913.93E−050.000853Phosphoenolpyruvate0.509274.34856.11E−050.001218 Deoxyribose-phosphate 0.505684.30737.02E−050.001291UDP-N-acetyl-glucosamine−0.48004−4.02110.0001810.003093 Uracil 0.478053.99950.0001940.003098Acetylcarnitine DL0.46593.86920.0002960.004424Betaine0.456953.77510.00040.00562 Glucose-1-phosphate 0.453713.74130.0004450.005907Pyrophosphate0.447283.67490.0005480.006894Citraconic acid0.440033.60090.000690.008244 Gpp 0.435953.55970.0007840.008919Methionine−0.43294−3.52930.000860.009345Damp−0.41094−3.31240.0016550.017196Kynurenic acid0.407273.27690.0018380.018304Glucosamine0.401583.22230.0021570.0202692-oxobutanoate0.40083.21480.0022050.020269Hydroxyphenylacetic acid0.391483.12630.0028490.025185P-hydroxybenzoate0.390193.11410.0029510.025185 Hexose-phosphate 0.388443.09770.0030920.025486Asparagine−0.37362−2.95990.0045630.036352Shikimate 3-phosphate0.369962.92630.0050090.038619Nicotinate0.368142.90960.0052460.038923Coenzyme A−0.36718−2.90080.0053740.038923Kyn0.364182.87350.0057940.040726Α-ketoglutarate0.356192.80120.0070530.048159Compounds in italics correlated at FDR p < 0.05 with SLE, BILAG, and FAS scores
Kynurenine accumulation is most prominently reversed by NAC treatment in vivo
As previously shown, GSH is depleted in lupus PBL (Gergely et al. 2002) and its reversal by treatment with NAC was safe and effective in reducing disease activity in patients with SLE (Lai et al. 2012). Therefore, we investigated the metabolomic impact of NAC relative to placebo by performing a two-factor (NAC versus placebo) time series analysis within individual subjects using samples acquired during the randomized double-blind clinical trial (Lai et al. 2012). Two-way within-subject ANOVA was performed and the interaction of drug with time was analyzed by comparing data acquired after treatment for 1 month (visit 2), 2 months (visit 3), and 3 months (visit 4) relative to baseline (visit 1). Following Bonferroni’s correction for 197 detected metabolites, NAC treatment significantly reduced Kyn levels relative to placebo (raw p = 2.8 × 10^−7^, FDR corrected p = 6.6 × 10^−5^). 10 additional metabolites, were affected by NAC with raw p < 0.05 (Table 5), including mTOR-regulated orotate (Ben-Sahra et al. 2013). A multivariate extension of ANOVA, ASCA identified nine metabolites, also including Kyn as the top compound that best modeled the interaction between time and drug (Table 6).Table 5. Effect of NAC relative to placebo by two-way ANOVA using time series (relative to visit 1) with drug interaction (NAC versus Placebo)FDR pTimeDrugInteraction Kyn 0.663780.85943 2.88E−07 6-Phospho-d-gluconate0.487150.399830.001036Purine0.008760.203840.010943Coenzyme A0.235450.578850.011679Pyroglutamic acid0.229040.486370.014384Orotate0.202370.115110.021869Betaine aldehyde0.418320.737160.027097Glucosamine0.28690.540040.0311785-Phosphoribosyl-1-pyrophosphate0.113760.839870.034412 N-Acetyl-glucosamine0.899180.550910.0349342-Deoxyglucose-6-phosphate0.467040.684850.038873Flavone0.465780.444010.049396Only Kyn (in italics) survived Bonferroni’s correction for 197 detected metabolites Table 6. Effect of NAC relative to placebo on metabolome of lupus PBL using ASCACompoundLeverageSPEKyn0.08370511.42296Purine0.0691172.185625Coenzyme A0.0677263.532872dUTP0.0608710.666888Shikimate 3-phosphate0.0559914.9343 N-acetyl-glucosamine0.0537945.661865Flavone0.04988310.8032Ethanolamine0.049574.7144595-Methyl-THF0.0447365.661408The significant variables have been identified based on the leverage and the Squared Prediction Errors (SPE) associated with each variable. Variables with low SPE and higher leverage modeled well after the major patterns: time, drug, and interaction of time and drug. The table shows metabolites that modeled well by interaction effect between Time and Drug
The impact of NAC on the metabolome of lupus PBL was further evaluated by pathway analysis comparing pre-treatment samples obtained at visit 1 to samples obtained at visits 2–4 during biologically and clinical effective administration of NAC at doses of 2.4 and 4.8 g/day. In contrast to the robust differences between the global metabolomes of lupus and control PBL at baseline, NAC treatment affected a narrow range of metabolites (Fig. 4a) without global effect on the metabolome (Fig. 5a). As shown in Fig. 4a, NAC treatment markedly increased NADPH (+281 ± 57 %, p = 0.035),while it diminished Kyn (−55 ± 16 %, p = 0.04), HCA (−66 ± 7 %, p = 0.0008), N-acetyl-glutamine (−37 ± 7 %, p = 0.015), succinic acid (−34 ± 6 %, p = 0.025), cytidine (−50 ± 9 %, p = 0.027), hypoxanthine (−45 ± 10 %, p = 0.032), cAMP (−58 ± 6 %, p = 0.033), methyl-malonic acid (−33 ± 7 %, p = 0.035), acetyl-coenzyme A (−27 ± 4 %, p = 0.044), flavone (−46 ± 11 %, p = 0.045), and CDP-choline (−28 ± 7 %, p = 0.048). At 95 % confidence interval (CI), the effects of NAC treatment on Kyn, HCA, and NADPH were also significant (data not shown). Pathway analysis only showed an influence on tryptophan metabolism, mainly through Kyn, xanthurenic acid, and Ac-CoA, and lesser effects on GSH metabolism and fatty acid elongation in mitochondria; none of these pathway effects survived FDR correction (Fig. 5b).Fig. 4. Effect of in vivo NAC treatment on metabolite concentrations in lupus PBL by comparing pre-treatment samples obtained at visit 1 to samples obtained at visits 2–4 during biologically and clinical effective administration of NAC at doses of 2.4 g/day and 4.8 g/day. a Metabolite concentrations affected by NAC at p < 0.05 on the basis of ANOVA. b 3-dimensional score plot of PLS-DA with components 1, 2, and 3, accounting for 18.9, 5.8, and 4.3 % of the total variance. c Validation of PLS-DA by permutation test p = 0.007. d Volcano plot is a combination of fold change (log2 FC: X axis) and t test p values (−log10 p: Y axis). e Variable importance in projection (VIP) scores of 15 top contributors to the PLS-DA components 1–3. f Coefficient-based importance measures of the top 15 contributors to components 1–3. g Correlation plots showing the compounds as horizontal bars, with colors in light pink indicating positive correlations and light blue indicating negative correlations with top lupus-associated metabolites identified in the volcano plot (d). Values reflect Pearson’s correlation coefficients between metabolite concentrations at FDR p < 0.05 calculated by MetaboAnalyst (Color figure online) Fig. 5. Effect of NAC on the metabolome of lupus PBL. a Global metabolome and pathway analyses were performed between 15 pre-treatment samples obtained at visit 1 and 29 samples obtained at visits 2–4 during biologically and clinical effective administration of NAC at doses of 2.4 g/day in 17 patients and 4.8 g/day in 12 patients. b Effect of NAC on metabolic pathways. 3 pathways were affected by NAC treatment, tryptophan, GSH, and mitochondrial fatty acid elongation (mFA); none of these pathway effects survived FDR or Bonferroni correction
PLS-DA of metabolite concentrations effectively discriminated between baseline and NAC-treated lupus PBL (Fig. 3b), as validated by permutation test p = 0.007 (Fig. 4c).NAC decreased Kyn, HCA, deoxyinosine, and cAMP and increased NADPH, as shown by Volcano plot (Fig. 4d). NADPH, HCA, and Kyn had the greatest PLS-DA VIP (Fig. 4e) and coefficient scores towards distinguishing lupus PBL obtained before treatment from lupus PBL obtained during NAC treatment (Fig. 4f). Pearson’s correlation analysis with top PLS-DA coefficients revealed significant interconnectedness among pathways represented by lupus-associated metabolites (Fig. 4g). Thus, NADPH negatively correlated with sedoheptulose 1,7-bisphosphate (SBP, r = −0.51; FDR p = 0.033) and HCA (r = −0.49; FDR p = 0.035). Kyn significantly correlated with 22 metabolites at FDR <0.05, dominated by purine nucleotides such as GDP (r = 0.58; FDR p = 0.003). HCA positively correlated with 49 metabolites at FDR p < 0.05, including sedoheptulose 7-phosphate (S7P; r = 0.43; p = 0.028), inositol (r = 0.41; p = 0.035), carbamoyl phosphate (r = 0.40; p = 0.036). cAMP correlated with taurine (r = 0.58; FDR p = 0.003) and 48 other metabolites, including GPP (r = 0.57; FDR p = 0.003), CDP-choline (r = 0.57; FDR p = 0.003), kynurenic acid (r = 0.56; FDR p = 0.003), 1-methyl-adenosine (r = 0.49; FDR p = 0.012), carbamoyl phosphate (r = 0.48; FDR p = 0.016), deoxyinosine (r = 0.47; FDR p = 0.016), inositol (r = 0.47; FDR p = 0.016), dihydroorotate (r = 0.45; FDR p = 0.019), and NADP (r = 0.43; FDR p = 0.025). Deoxyinosine correlated with cAMP (r = 0.52; FDR p = 0.021), NADH (r = 0.52; FDR p = 0.021), and Kyn (r = 0.45; FDR p = 0.052). These latter findings are consistent with the involvement of Kyn in nucleotide metabolism (Pileni et al. 1977). AUC logistic regression analysis indicated that Kyn (Fig. 6a), NADPH (Fig. 6b), and cAMP had the greatest specificity and sensitivity to detect the metabolomic effects of NAC in SLE (Fig. 6c).Fig. 6. Receiver operating characteristic (ROC) curve logistic regression analysis of the metabolomic effects by NAC in lupus PBL. For each of the top three metabolites, the left panel shows the area under the ROC curve (AUC), true positive and false positive rates, and confidence interval (CI), the right panel shows the concentrations of metabolites in PBL before (baseline) and during NAC treatment (NAC). AUC logistic regression analysis indicated that Kyn (AUC = 0.851), NADPH (AUC = 0.752), and cAMP had the greatest specificity and sensitivity to detect the metabolomic effects of NAC in SLE (AUC = 0.723)
Kynurenine stimulates mTOR activity in DN T cells
Treatment of SLE patients with NAC resulted in the reversal of mTOR activation in T cells, most prominently in CD4^−^CD8^−^ double-negative (DN) T cells (Lai et al. 2012). These DN T cells have been implicated in elevated production of IL-4 (Chan et al. 2006) and IL-17 (Kato and Perl 2014) and stimulating anti-DNA production (Shivakumar et al. 1989) and organ damage (Crispin et al. 2008). Therefore, we examined whether the metabolites that were found to be accumulated in lupus PBL and regulated by treatment with NAC (Kyn, HCA, and cAMP), were actually capable of activating mTOR. Among these metabolites, only kynurenine activated mTOR complex 1 activity, as measured by phosphorylation of 4E-BP1, both in the Jurkat human T cell line and primary PBL (Fig. 7a, b). The effect of these metabolites on mTORC1 activity within T-cell subsets was measured via phosphorylation S6RP (Lai et al. 2012). T-cell subsets were analyzed by staining with antibodies to CD4, CD8, CD25, and FoxP3. In accordance with previous findings (Lai et al. 2012), mTOR was most elevated in DN T cells relative to CD3^+^, CD4^+^, or CD8^+^ T cells (p < 0.001; Fig. 7c) and CD4^+^CD25^+^FoxP3^+^ Tregs (p < 0.001; data not shown). Kyn stimulated mTOR in DN T cells (Fig. 7c). As a control amino acid of kynurenine metabolism, tryptophan (0.1, 1, and 10), which was neither accumulated in SLE nor influenced by NAC, did not stimulate mTOR activity (data not shown). Dibutyryl cAMP (db-cAMP), a cell-permeable derivative of cAMP, reduced mTOR activity in all T-cell subsets (data not shown). Inhibition of mTOR by cAMP was consistent with earlier findings (Xie et al. 2011).Fig. 7. Activation of mTOR by kynurenine (Kyn). a Jurkat human T cells were incubated with or without Kyn at the indicated concentrations of 0.5 and 1 mM for 24 h and analyzed by western blot. mTORC1 activity was assessed by the levels of phosphorylated substrates, p4E-BP1 and pS6K, relative to actin control. b Western blot analysis of PBL from 8 healthy subjects incubated with or without Kyn at the indicated concentrations of 0.1, 0.5, and 1 mM for 24 h. C, Flow cytometry of intracellular pS6RP levels in CD4, CD8, DN T-cell subsets of 8 healthy subjects. While top panels show representative western blots (a, b) and flow cytometry dot plots (c), bottom panels indicate cumulative analyses. *reflect p values <0.05
Discussion
The present study reveals robust metabolome changes in SLE with a most prominent impact on the PPP. This pathway supplies essential metabolites, R5P for nucleotide biosynthesis and cell proliferation, and NADPH for antioxidant defenses. The accumulation of S7P also implicates the PPP in SLE, given that this metabolite is unique to this pathway (Perl et al. 2011). S7P is a substrate of transaldolase (TAL), and it is known to only accumulate in the deficiency of this enzyme in mice (Perl et al. 2011; Hanczko et al. 2009) and humans (Qian et al. 2008). The PPP is tightly linked to cysteine metabolism and GSH homeostasis by providing NADPH, which is essential for the regeneration of GSH from its oxidized form, GSSG (Perl 2013) (Fig. 8). As shown in this study, cysteine, which is the rate-limiting factor of de novo GSH synthesis (Lu 2013), was profoundly diminished in lupus PBL. Importantly, the loss of cysteine was associated with the accumulation of its oxidized product, cystine, as well as Met-SO (Haenold et al. 2008) and HCA (Boldyrev 2009; Go and Jones 2011), all of which represent metabolic evidence of oxidative stress in SLE. While the depletion of cysteine and the accumulation of cystine and Met-SO clearly indicate increased oxidative stress in SLE, none of these compounds or the unique PPP substrates R5P or S7P correlated with disease activity of untreated patients. In contrast, metabolites connecting multiple pathways, such as DHAP, common to both the PPP and glycolysis, and OAA, common to the both TCA and glycolysis, correlated with SLEDAI, BILAG, and FAS scores, suggesting that increased flux among these pathways are involved in disease activity.Fig. 8. Schematic diagram of the prominent metabolomic changes that impact the pentose phosphate pathway (PPP) in patients with SLE. Red and blue arrows mark the forward and reverse reactions in the PPP, which are catalyzed by transaldolase (TAL), respectively (Perl et al. 2011). Metabolites are highlighted in red or blue, which reflects their increase or decrease in lupus PBL. The PPP is connected with the depletion of cysteine and the accumulation of homocysteic acid (HCA) and kynurenine (Kyn). Therapeutic intervention with N-acetylcysteine (NAC) reverses the accumulation of Kyn and the activation of mTOR, which are thus considered redox-sensitive drivers of lupus pathogenesis (Color figure online)
As shown in this study, the prominent and NAC-responsive accumulation of Kyn and its ability to activate mTOR in DN T cells constitute a metabolic pathway of T cell activation and lineage development in general. This mechanism is particularly significant for lupus pathogenesis, given that DN T cells are a primary source of pro-inflammatory IL-4, IL-17 and necrotic debris (Lai et al. 2013). The accumulation of Kyn may be a result of decreased catabolism by Kyn hydroxylase owing to NADPH dependence of this enzyme (Breton et al. 2000). Along these lines, NAC dramatically augmented the levels of NADPH, which can occur through sparing of NADPH via the enhancement of de novo GSH synthesis by NAC (Perl et al. 2011; Hanczko et al. 2009). Thus, the marked suppression of Kyn in NAC-treated patients can be attributed to the NADPH sparing effect of NAC (Hanczko et al. 2009). The reversal of HCA accumulation may represent a direct effect of NAC on cysteine metabolism. By contrast, NAC treatment did not reduce elevated levels of unique PPP sugars, S7P and R5P, suggesting that altered PPP activity lies upstream of GSH depletion in the order of metabolic signaling defects in SLE. NAC also affected other metabolic pathways that are centrally connected to the PPP (Fig. 9). mTOR complex 1 (mTORC1), which was measured here via phosphorylation of its downstream substrate, pS6RP, is stimulated by oxidative stress (Sarbassov and Sabatini 2005) and the lysosomal accumulation of amino acids (Bar-Peled et al. 2013). However, the identity of specific amino acids that are sensed by mTORC1 are presently unknown (Jewell et al. 2013). Kynurenine has been recently linked to oxidative damage in the eye (Linetsky et al. 2014). Therefore, the NAC-responsive accumulation of Kyn may be particularly relevant for understanding the fundamental biology of mTORC1 activation by amino acids (Jewell et al. 2013) under oxidative stress (Sarbassov and Sabatini 2005). Tryptophan breakdown products, including Kyn, have been found to possess both antioxidant (Gostner et al. 2015; Grewal et al. 2014) and pro-oxidant properties (Linetsky et al. 2014). Therefore, further studies are clearly warranted to address the role of Kyn in oxidative stress of patients with SLE.Fig. 9. Schematic interaction of metabolomic changes in lupus PBL via the PPP. Altered compounds are identified by standard KEGG codes and acronyms in parentheses: compounds in red indicate metabolites with increased levels in lupus PBL; compounds in blue indicate metabolites with reduced levels in lupus PBL; compounds affected by NAC treatment are highlighted in yellow; compounds in black indicate metabolites with increased levels in lupus PBL but not connected to the PPP. Green arrows indicate pathways connected by common metabolites, with arrowheads marking directionality of metabolic flux. Red arrows mark metabolites capable of directly activating mTOR (Color figure online)
In summary, this study documents profound changes in the metabolome of lupus PBL with a dominant impact on the PPP that reflects greater demand for nucleotides and oxidative stress. The hereby discovered accumulation of Kyn, which is metabolically linked to increased PPP activity and responds to treatment with NAC, is identified as potential contributor to mTOR activation in SLE.
Electronic supplementary material
Below is the link to the electronic supplementary material. Supplementary material 1 (PDF 1309 kb)
The reference list from the paper itself. Each links out to its DOI / PubMed record.
- 1Aune TM Pogue SL Inhibition of tumor cell growth by interferon-γ is mediated by two distinct mechanisms dependent upon oxygen tension: Induction of tryptophan degradation and depletion of intracellular nicotinamide adenine dinucleotide Journal of Clinical Investigation 19898486387510.1172/JCI 1142472503544 PMC 329730 · doi ↗ · pubmed ↗
- 2Bar-Peled L Chantranupong L Cherniack AD Chen WW Ottina KA Grabiner BC Spear ED Carter SL Meyerson M Sabatini DMA tumor suppressor complex with GAP Activity for the Rag GT Pases that signal amino acid sufficiency to m TORC 1Science 20133401100110610.1126/science.123204423723238 PMC 3728654 · doi ↗ · pubmed ↗
- 3Ben-Sahra I Howell JJ Asara JM Manning BD Stimulation of de novo pyrimidine synthesis by growth signaling through m TOR and S 6K 1Science 20133391323132810.1126/science.122879223429703 PMC 3753690 · doi ↗ · pubmed ↗
- 4Boldyrev AA Molecular mechanisms of homocysteine toxicity Biochemistry (Moscow)20097458959810.1134/S 000629790906001719645662 · doi ↗ · pubmed ↗
- 5Breton J Avanzi N Magagnin S Covini N Magistrelli G Cozzi L Isacchi A Functional characterization and mechanism of action of recombinant human kynurenine 3-hydroxylase European Journal of Biochemistry 20002671092109910.1046/j.1432-1327.2000.01104.x 10672018 · doi ↗ · pubmed ↗
- 6Chan RWY Lai FMM Li EKM Tam LS Chow KM Li PKT Szeto CC Imbalance of Th 1/Th 2 transcription factors in patients with lupus nephritis Rheumatology 20064595195710.1093/rheumatology/kel 02916461436 · doi ↗ · pubmed ↗
- 7Chi H Regulation and function of m TOR signalling in T cell fate decisions Nature Reviews Immunology 2012123253382251742310.1038/nri 3198 PMC 3417069 · doi ↗ · pubmed ↗
- 8Crispin JC Oukka M Bayliss G Cohen RA Van Beek CA Stillman IE Kyttaris VC Juang YT Tsokos GC Expanded double negative T cells in patients with systemic lupus erythematosus produce IL-17 and infiltrate the kidneys Journal of Immunology 20081818761876610.4049/jimmunol.181.12.8761 PMC 259665219050297 · doi ↗ · pubmed ↗