Data in support of quantification of pyrophosphate as a universal approach to determine polymerase activity and assay polymerase inhibitors
S. Malvezzi, S.J. Sturla, M. Tanasova

TL;DR
This study compares methods to measure DNA polymerase activity, focusing on a new fluorescence-based assay and its effectiveness in detecting polymerase inhibitors.
Contribution
The study introduces a fluorescence-based primer extension assay as a potential alternative to gel electrophoresis for polymerase activity quantification.
Findings
The PE-PiPer assay effectively measures primer extension by Pol η over DNA lesions.
5-OH-CTP specifically inhibits translesion synthesis over cisplatin-containing DNA.
The fluorescence-based method shows comparable performance to denaturing gel electrophoresis.
Abstract
Characterization of synthetic oligonucleotides and quantification of primer extension mediated by a human translesion synthesis polymerase η (Pol η) over drug-induced DNA lesions in the presence on modified nucleotide analogs is described. Extent of primer extension for each reaction was monitored by denaturing gel electrophoresis. The data was obtained to assess the performance of the fluorescence-based primer extension (PE-PiPer) assay [1] with respect to the established and conventionally used denaturing gel electrophoresis. The obtained data reflects the specific inhibition of translesion synthesis over cisplatin containing DNA with 5-OH-CTP.
Genes, proteins, chemicals, diseases, species, mutations and cell lines named across the full text — each resolved to its canonical identifier and authoritative record.
Click any figure to enlarge with its caption.
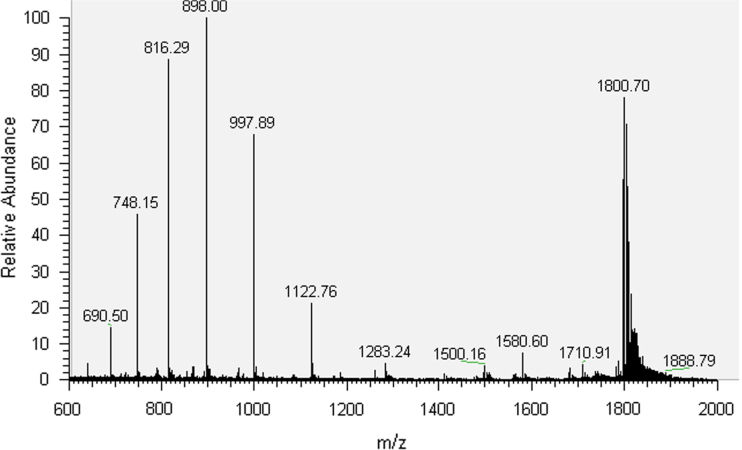 Figure 1
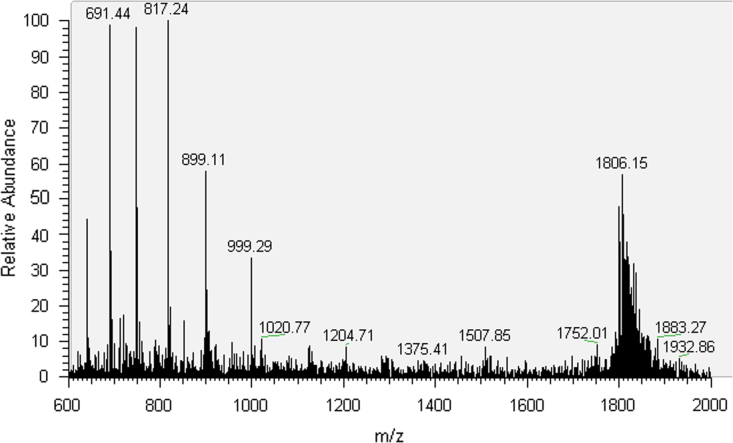 Figure 2
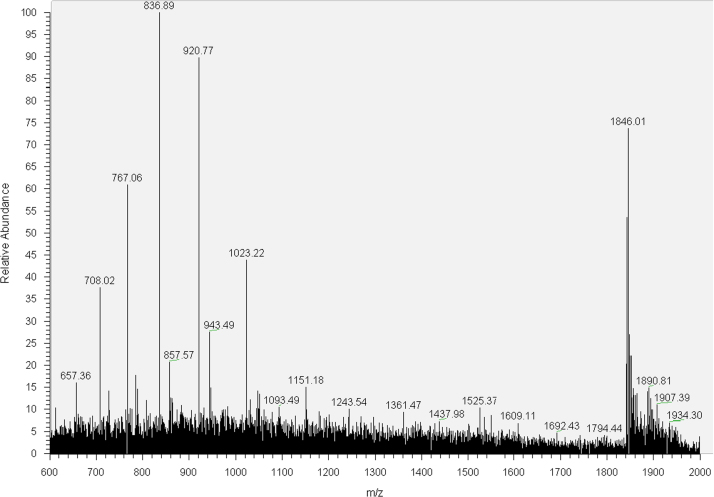 Figure 3
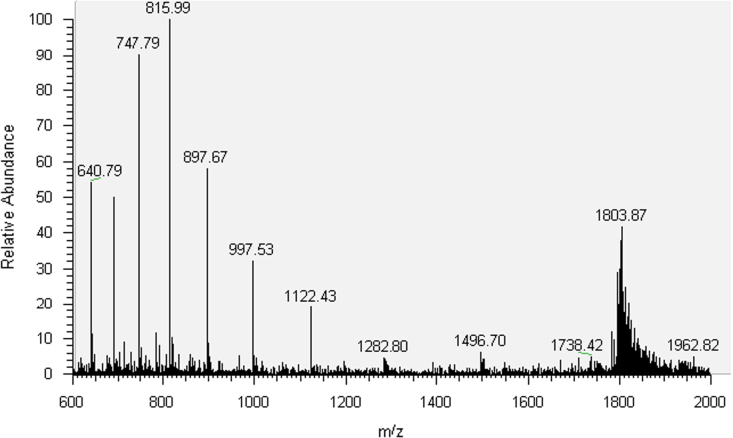 Figure 4
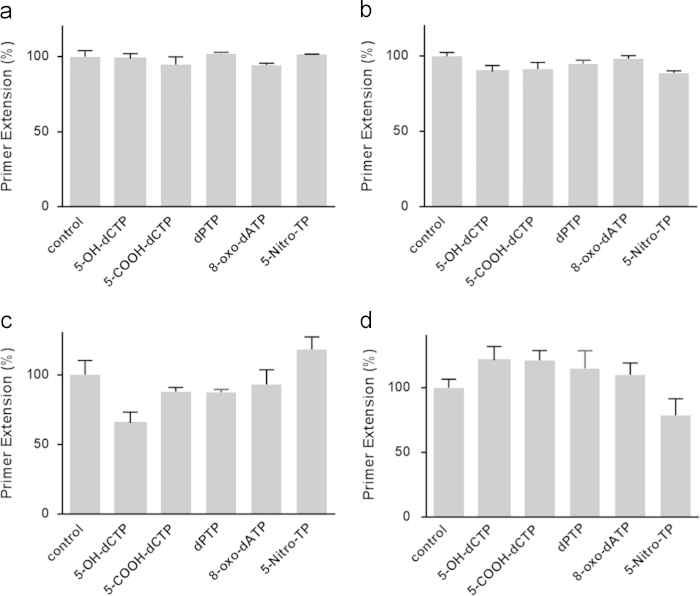 Figure 5
Peer Reviews
No public reviews on file for this paper yet. If you reviewed it on a platform where reviews are public (OpenReview, ICLR, NeurIPS, ICML), you can paste yours below so the community can read it here.
Videos
No videos yet. Explain this paper in a talk, walkthrough, or lecture? Add one.
Taxonomy
TopicsDNA and Nucleic Acid Chemistry · DNA Repair Mechanisms · Cancer therapeutics and mechanisms
Specifications table
Subject areaChemical BiologyMore specific subject areaToxicology, Drug DevelopmentType of dataTable, text file, graph, figureHow data was acquiredOligonucleotide synthesis, fluorescence assay, gel electrophoresisData formatAnalyzed by Mass Spectrometry, Fluorescence plate-reader, and Molecular Imager Gel Doc XR+Imaging System from Bio-RadExperimental factorsEnzymes were contained in Tris buffer.Experimental featuresFluorescent measurements were used to evaluate DNA synthesis. The data was correlated to that obtained with 1D gel electrophoresis.Data source locationZurich, SwitzerlandData accessibilityData is provided inSupplementary materials directly with this article.
Value of the data as follows:
- •Quantitative analysis of translesion synthesis over DNA with drug-relevant adducts.
- •Quantitative evaluation of DNA synthesis inhibition and identification of lesion-specific translesion synthesis inhibitors.
Data, experimental design, materials and methods
1
We have established a fluorescence-based assay for quantitative monitoring of DNA synthesis based on the formation of pyrophosphate [1]. The assay was developed for the use with DNA containing different DNA alkylation products. DNAs were analyzed with Mass Spectrometry and the corresponding spectra are shown in Supplementary materials. Replication of modified and natural DNA templates by Y-family translesion synthesis polymerases was monitored and quantified based on fluorescence emission being proportional to pyrophosphate release. The data were correlated to those produced by monitoring replication of modified and natural DNA templates via gel electrophoresis, and the comparative data are shown in Supplementary materials. The data support the reliability of the assay and its applicability to high throughput screening of polymerase inhibitors. Validation of the assay with unnatural nucleosides resulted in the observation that lesion-specific inhibition of translesion synthesis is possible.
Oligonucleotide characterization
1.1
The synthesized oligonucleotides were purified by HPLC and characterized by MS analysis (Supplementary material, [Figs. 1–4](#f0005 f0010 f0015 f0020)). 30mer-GG and 30mer-O^6^-MeG DNA templates were purified by HPLC (Agilent 1100 Series) with an Agilent Eclipse XDB-C18 5 μm 4.6×150 mm^2^ column. The chromatographic mobile phases were 50 mM triethylammonium acetate and acetonitrile. A gradient of acetonitrile from 8 to 12% over 30 min was used for 30mer-GG and from 9.5 to 12% over 49 min for 30mer-O^6^-MeG. For 30mer-Pt, a Phenomenex Luna C18 5 μm 250×4.6 mm^2^ column was used with an acetonitrile gradient from 5 to 12% over 75 min. The eluted fractions containing DNA templates were concentrated to dryness in a MiVac centrifugal evaporator (GeneVac), resuspended in deionized water and checked by direct injection into an Agilent MSD SL ion trap mass spectrometer with electrospray ionization. The template 30mer-3d-3MeA was purified by PAGE electrophoresis with a 20% (w/v) acrylamide/urea 7 M gel followed by solid phase extraction with a Sep-Pak C18 Classic cartridge (Waters).
Gel electrophoresis data
1.2
Extent of primer extension for each reaction was monitored in parallel by denaturing gel electrophoresis for comparison with PE-PiPer data (Fig. 5). 2 µl of the quenched primer extension reaction were combined with 3 µl loading buffer (95% formamide, 18 mM EDTA, 0.1% Bromophenol Blue) and electrophoresis was performed with a 20% (w/v) acrylamide/urea 7 M gel with an XCell SureLock mini-cell electrophoresis system from Life Technologies at 300 V for 90 min. The gel was then stained in 1X SYBR Gold solution at room temperature for 20 min. Gel bands were quantified with a Molecular Imager Gel Doc XR+Imaging System from Bio-Rad.
The reference list from the paper itself. Each links out to its DOI / PubMed record.