Synthesis of BSA-Coated Iron Oxide Nanoparticles with Size Control for High-Performance T1 Contrast Agents in Magnetic Resonance Imaging
Bosede Kolawole, Jie Zheng, Dongmei Cao, Yongfeng Zhao

TL;DR
Researchers developed a simple method to create ultra-small iron oxide nanoparticles coated with BSA for improved MRI contrast, offering a safer alternative to traditional agents.
Contribution
A low-cost, non-toxic method for synthesizing size-controlled BSA-coated iron oxide nanoparticles with enhanced T1 contrast performance.
Findings
Nanoparticles with 4.6 nm diameter showed the strongest T1 contrast enhancement.
The method produced highly uniform and crystalline nanoparticles ranging from 3.7 to 7.9 nm.
Fe2O3@BSA nanoparticles exhibited low r2/r1 ratios, indicating high T1 contrast efficiency.
Abstract
The excellent biocompatibility and favorable physicochemical properties of iron oxide nanoparticles have made them attractive candidates for magnetic resonance imaging. However, it remains challenging to synthesize high-performance T1 contrast agents with controlled sizes and biocompatible coating materials. In this study, we demonstrate a simple and environmentally friendly approach for synthesizing ultra-small iron oxide nanoparticles using bovine serum albumin (BSA) as a template. Following synthesis, the iron oxide nanoparticles (Fe3O4) were oxidized to Fe2O3 via the addition of hydrogen peroxide, which resulted in enhanced T1-weighted magnetic resonance contrast. The use of BSA not only stabilized the nanoparticles but also enabled precise control over nanoparticle size by adjusting the Fe-to-BSA molar ratio. This method yielded highly uniform and crystalline ultra-small…
Genes, proteins, chemicals, diseases, species, mutations and cell lines named across the full text — each resolved to its canonical identifier and authoritative record.
Click any figure to enlarge with its caption.
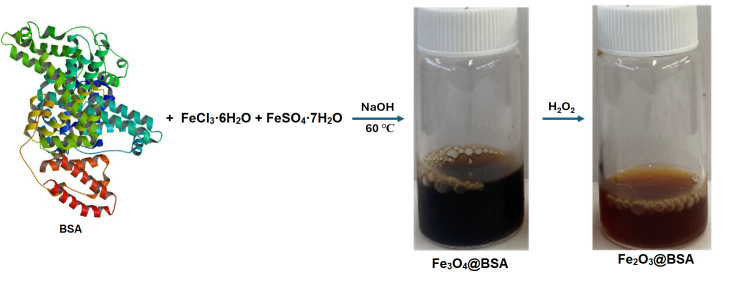 Figure 1
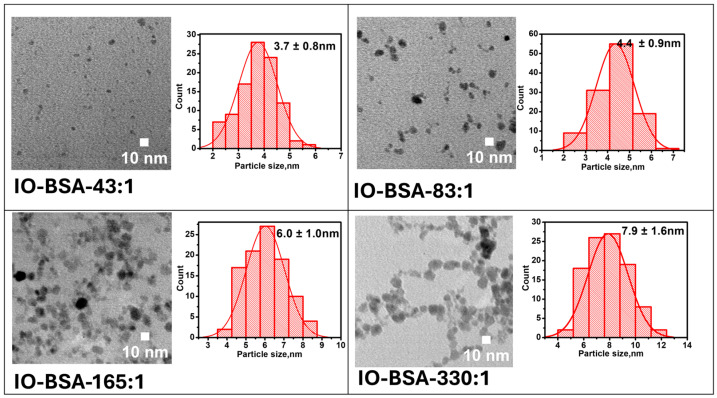 Figure 2
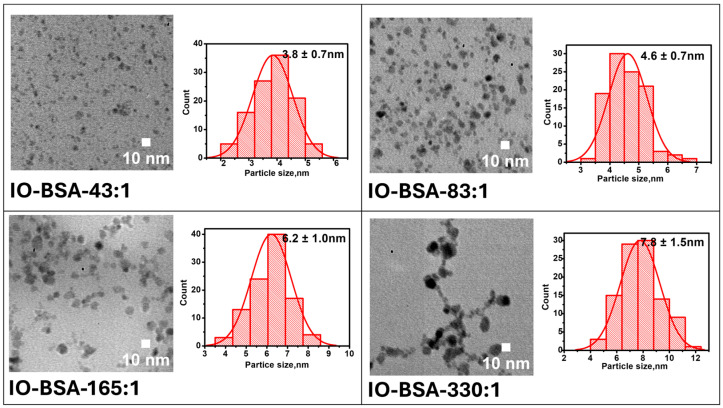 Figure 3
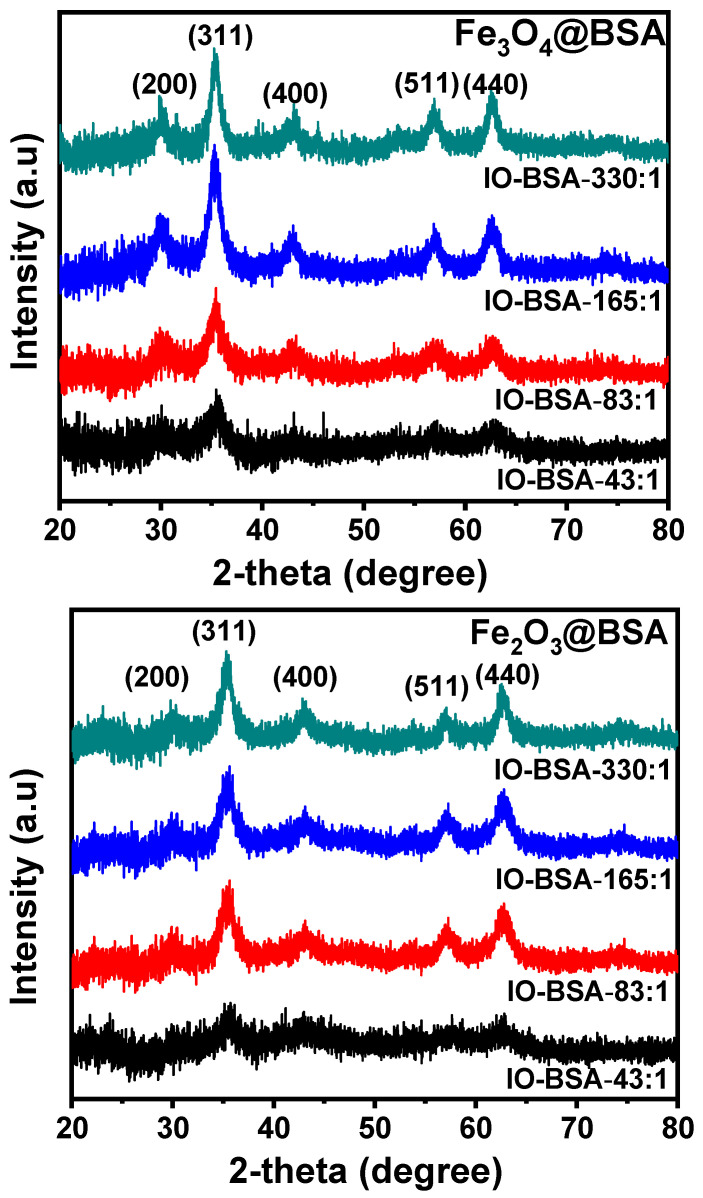 Figure 4
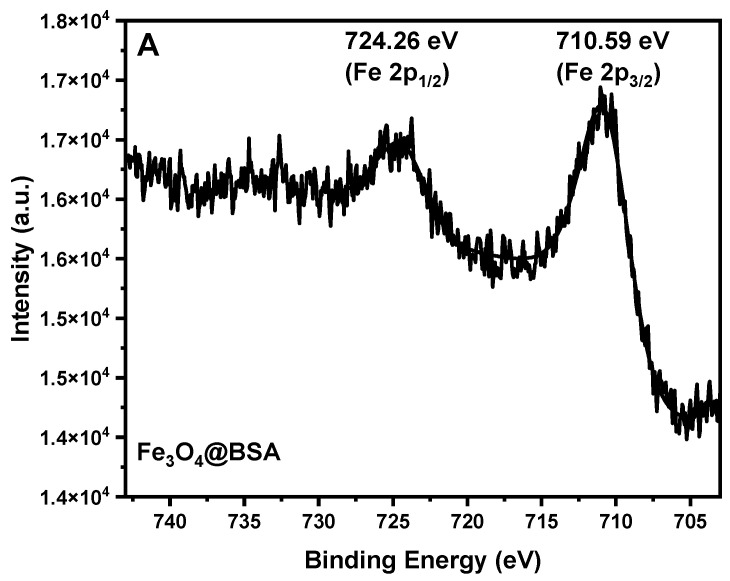 Figure 5
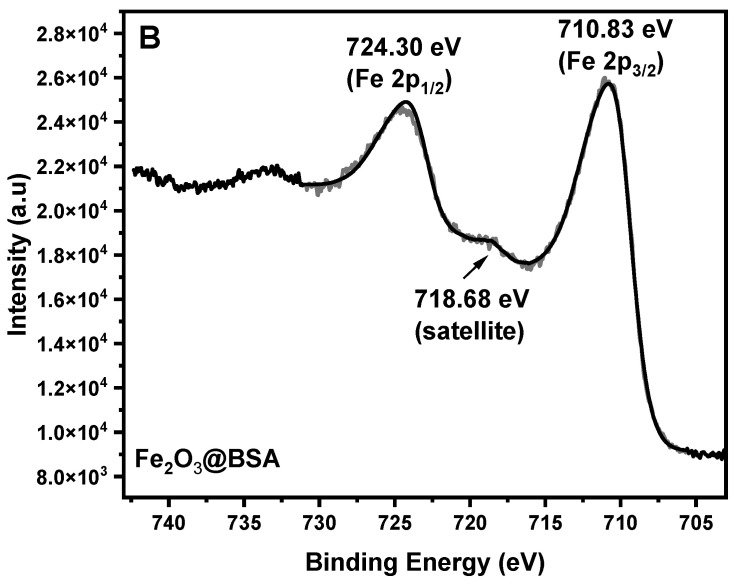 Figure 6
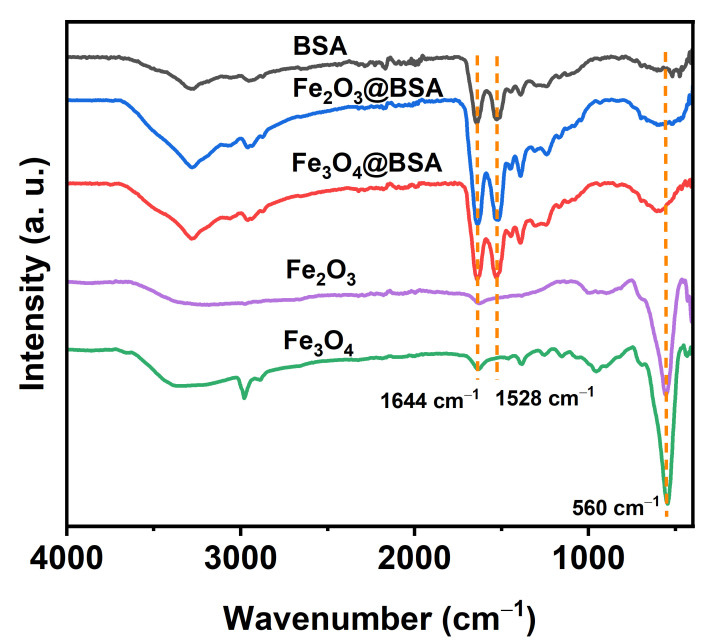 Figure 7
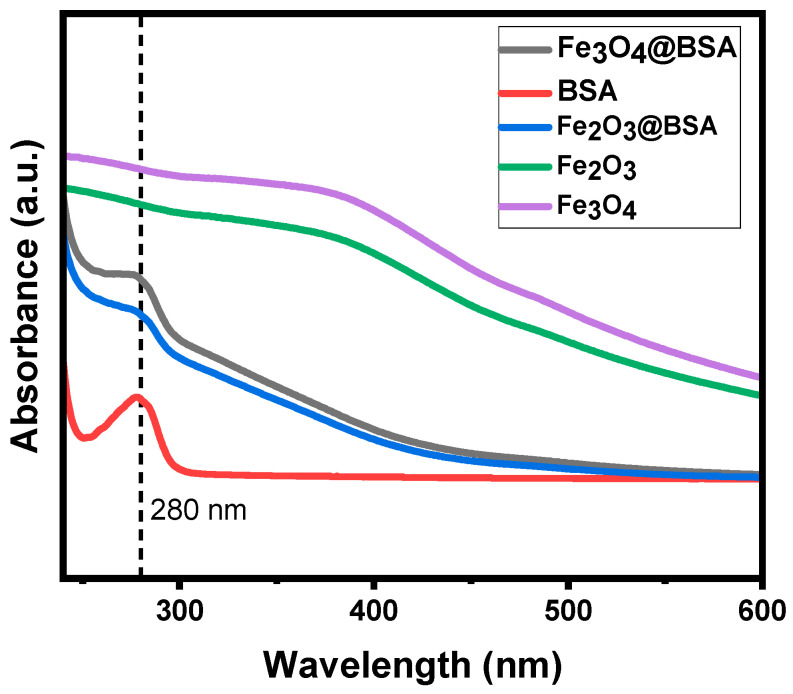 Figure 8
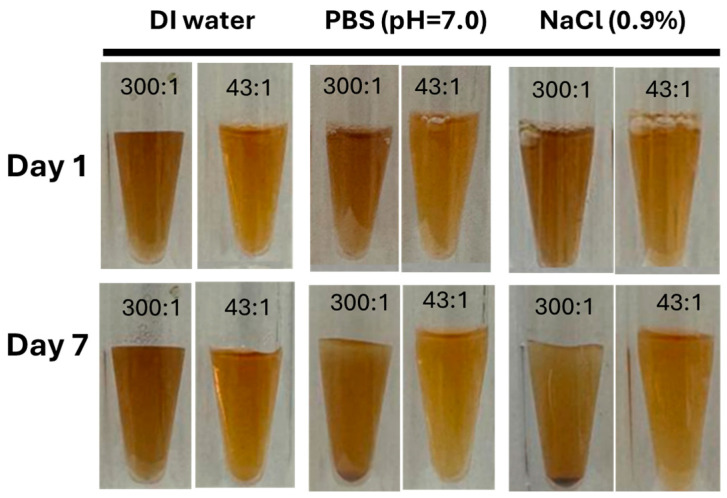 Figure 9
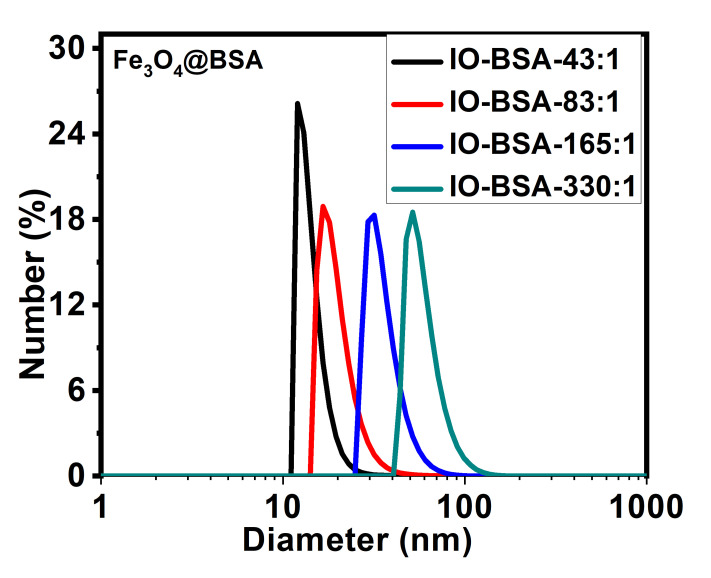 Figure 10
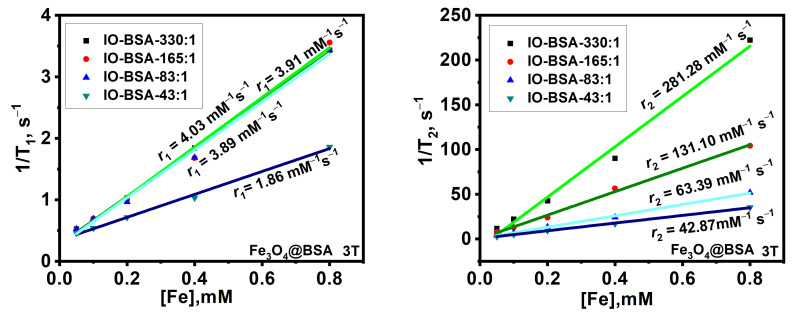 Figure 11
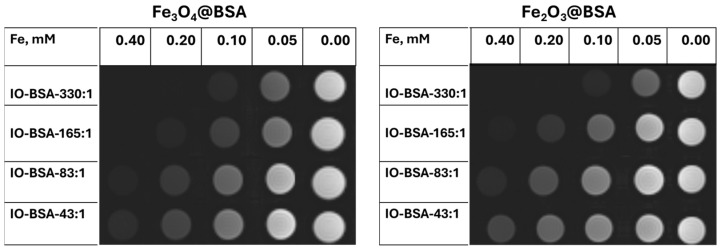 Figure 12
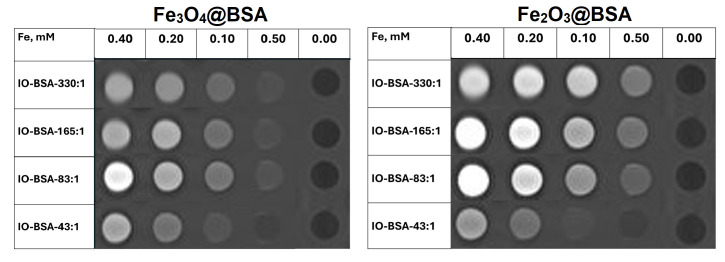 Figure 13
- —National Science Foundation
Peer Reviews
No public reviews on file for this paper yet. If you reviewed it on a platform where reviews are public (OpenReview, ICLR, NeurIPS, ICML), you can paste yours below so the community can read it here.
Videos
No videos yet. Explain this paper in a talk, walkthrough, or lecture? Add one.
Taxonomy
TopicsNanoparticle-Based Drug Delivery · Iron oxide chemistry and applications · Characterization and Applications of Magnetic Nanoparticles
1. Introduction
Magnetic resonance imaging (MRI) is a widely used diagnostic tool in clinical practice [1]. Besides its non-invasive nature, MRI can provide high-resolution images of internal body structures without the use of ionizing radiation [1,2,3,4,5]. By employing strong magnetic fields and radiofrequency pulses, MRI generates detailed two- and three-dimensional tomographic images based on the nuclear magnetization of hydrogen protons in tissues. Its excellent soft-tissue contrast and high spatial resolution make MRI a standard for imaging of the brain, spine, cardiovascular system, musculoskeletal tissues, and oncology [6]. Clinical MRI contrast primarily relies on intrinsic T1 and T2 relaxation properties of tissues, which are often amplified by contrast agents to enhance diagnostic sensitivity.
To further improve image contrast, MRI contrast agents are routinely used and are classified as either positive (T1-weighted) or negative (T2- weighted) agents based on their influence on signal intensity [7]. Positive contrast agents are typically gadolinium-based chelates or manganese complexes, whereas superparamagnetic iron oxide nanoparticles have traditionally been employed as negative contrast agents due to their strong T2-shortening effects [3,7,8]. Contrast agents enhance image quality by accelerating proton nuclear spin relaxation, thereby improving signal intensity and lesion detection [9].
Gadolinium-based contrast agents (GBCAs) have been extensively used in clinical MRI [10]. However, growing safety concerns have limited their long-term application. Adverse effects associated with GBCAs include nephrogenic systemic fibrosis (NSF) in patients with impaired renal function and long-term gadolinium retention in the brain and other tissues [11]. Additionally, GBCAs are rapidly cleared through renal excretion, which restricts their use in prolonged or repeated imaging. These limitations have motivated intensive research for safer alternatives to gadolinium-based contrast agents [12,13,14].
Iron oxide nanoparticles offer several advantages as MRI contrast agents, including metabolism through natural iron pathways, high relaxivity, and improved biocompatibility [15,16]. Certain iron oxide formulations have demonstrated superior imaging performance compared to commercial gadolinium chelates, even at low and intermediate magnetic field strengths. Clinically, iron oxide nanoparticles have been successfully used for liver and lymph node imaging, owing to their uptake by the reticuloendothelial system and incorporation into ferritin and normal iron metabolism [16,17]. Due to their favorable safety profile and high relaxivity, iron oxide nanoparticles are increasingly being explored as potential alternatives to GBCAs, particularly as T1 contrast agents [4].
The magnetic behavior and relaxivity of iron oxide nanoparticles are strongly dependent on their size, crystallinity, magnetic anisotropy, hydrodynamic diameter, and surface coating [18,19]. These parameters collectively regulate water accessibility and local magnetic field fluctuations [20]. Conventional iron oxide nanoparticles with core sizes of approximately 8–30 nm generate strong local magnetic field inhomogeneities. As a result, transverse relaxation is predominantly accelerated, leading to enhancement on T2-weighted images [21,22]. Clinically approved agents such as ferumoxides, ferucarbotran, and ferumoxtran exhibit high r2/r1 ratios, making them effective T2 contrast agents for liver and lymph node imaging [21]. At standard clinical field strengths (1.5–3 T), the high magnetic susceptibility of these particles favors transverse over longitudinal relaxation, limiting their utility as T1 enhancers [16].
Recent studies have demonstrated that ultra-small iron oxide nanoparticles with core sizes below ~5 nm can exhibit strong T1 contrast due to their reduced magnetic moments and enhanced longitudinal relaxation [23,24]. Nanoparticles with low r2/r1 ratios and high r1 values typically possess moderate magnetization and thin water-permeable surface coatings that promote efficient proton exchange near the magnetic core [20,23]. Exceedingly small iron oxide nanoparticles with hydrodynamic diameters below the renal clearance threshold (~5.5 nm) have shown r2/r1 ratios approaching those of GBCAs, with comparable r1 values and improved clearance profiles [23].
The synthesis method plays a critical role in determining the size, crystallinity, morphology, and magnetic properties of iron oxide nanoparticles [25,26,27]. While thermal decomposition and hydrothermal methods can produce well-defined nanoparticles, they often require organic solvents, high temperatures, or high pressures [28]. In contrast, the co-precipitation method is a green and scalable approach that utilizes aqueous media at relatively low temperatures. Hydrophilic nanoparticles are produced by precipitating Fe^2+^ and Fe^3+^ salts under basic conditions [29]. However, co-precipitation typically suffers from limited control over particle size and size uniformity.
To address this limitation, various surface-modifying agents have been explored to regulate nanoparticle growth during co-precipitation. Natural fatty acids, synthetic polymers such as poly(acrylic acid), and proteins including bovine serum albumin (BSA) have been shown to influence nanoparticle size and morphology [30,31,32]. Among these, BSA is particularly attractive due to its biocompatibility, non-toxicity, and widespread clinical use. BSA coatings enhance colloidal stability, prolong circulation time, and provide functional groups for surface modification [21,33]. In MRI and magnetic particle imaging, albumin-coated iron oxide nanoparticles have demonstrated improved stability under physiological conditions while maintaining favorable magnetic properties.
Although BSA has previously been used to synthesize ultra-small iron oxide nanoparticles [31], systematic control of iron oxide core size and its direct impact on T1 contrast performance have not been explored [31,34,35]. In particular, the interplay between BSA concentration, core size, and resulting r1 and r2/r1 values has not been fully elucidated.
In this study, we employ BSA as a size-regulating agent to synthesize iron oxide nanoparticles via the co-precipitation method by systematically varying the Fe:BSA molar ratio. We investigate how controlled changes in nanoparticle size influence T1 relaxivity and overall MRI performance, aiming to optimize iron oxide nanoparticles as effective and safe T1 contrast agents.
2. Materials and Methods
2.1. Materials and Reagents
Bovine serum albumin (BSA), FeCl_3_∙6H_2_O, FeSO_4_∙7H_2_O, NaOH, and hydrogen peroxide (35%) were puchased from Sigma-Aldrich (St. Louis, MO, USA). All chemicals were used without purification.
2.2. Synthesis of Fe3O4@BSA and Fe2O3@BSA
In a typical reaction, BSA (30.23 mg, 0.00045 mmol) in 10 mL of deionized water was purged with argon for 30 min. FeCl_3_∙6H_2_O (27.03 mg, 0.1 mmol) and FeSO_4_∙7H_2_O (13.9 mg, 0.05 mmol) were dissolved in 2 mL of deionized water and were injected into the BSA solution and purged for another 15 min. The reaction mixture was placed in a water bath (60 °C) and allowed to heat up for 5 min. NaOH solution (0.5 ml, 0.6 m mol) was added at 12 mL/hr, and allowed to stir for an hour. The Fe_3_O_4_@BSA (6 ml) was taken out and H_2_O_2_ peroxide (35%) (0.5 ml) was added at 12 mL/hr under low stirring for the formation of Fe_2_O_3_@BSA. The reaction was stirred for 10–30 min and allowed to settle down overnight. To purify, the reaction mixture was washed with deionized water amicon filter (100 k) until the pH reached 7. The same reaction was repeated with different amounts of BSA (60.45 mg, 120.90 mg, and 237.7 mg) for 165:1, 83:1, 43:1 Fe:BSA molar ratio respectively.
2.3. Characterization of Fe3O4@BSA and Fe2O3@BSA
2.3.1. Transmission Electron Microscope
The information about the sizes and morphology of the nanoparticles was obtained using a transmission electron microscope (TEM) (JEOL JEM-1011, JEOL, Inc., Peabody, MA, USA). The diluted purified samples (4 µL) were placed on a Carbon film 150-mesh copper TEM grid (CF 150-CU) and allowed to stay for 20 min. Excess samples were removed using a small piece of filter paper and allowed to dry completely before viewing them under the transmission electron microscope. About 100 nanoparticles were analyzed using ImageJ (v1.54d, National Institutes of Health, Bethesda, MD, USA) software to analyze the TEM images. The statistical analyses were conducted in Origin 2008.
2.3.2. Crystal Size Measurement of Iron Oxide Nanoparticles
X-ray diffraction (XRD) measurement was done using the Rigaku MiniFlex 600 X-ray (40 kV, 15 mA) (Rigaku Americas Corp, The Woodlands, TX, USA) with Cu Kβ radiation (λ = 0.154 nm). The samples were placed on zero-background quartz slides and allowed to dry. Then, the samples were mounted on the central goniometer stage (beam incident position) of the XRD instrument. The scan degree ranged from 10° to 80° with a step size of 0.01 at a rate of 1°/min. The crystal sizes of the nanoparticles were calculated using the Scherrer equation.
2.3.3. X-Ray Photoelectron Spectroscopy (XPS)
X-ray Photoelectron Spectroscopy (XPS) analysis of the samples was conducted using a ScientaOmicron ESCA 2SR X-ray Photoelectron Spectroscope equipped with a flood source charge neutralizer. The powders were pressed into pellets and analyzed using a monochromatic Al Kα X-ray source (1486.6 eV) at 450 W, with the analysis chamber pressure maintained below 5 × 10^−9^ mBar. Both wide-scan surveys and high-resolution core-level spectra of all elements were acquired, with binding energies calibrated using the major N 1s peak of BSA protein at 399.8 eV. The core-level spectra were deconvoluted to obtain chemical state information using CasaXPS (v2.3.25, Casa Software) data processing software.
2.3.4. Hydrodynamic Size
The hydrodynamic diameter and size distribution of the nanoparticles were measured by dynamic light scattering (DLS) using a Litesizer^TM^ 100 Anton Paar particle size analyzer (Anton Paar USA Inc., Ashland, VA, USA). Prior to measurement, samples were dispersed in deionized water and appropriately diluted to minimize multiple scattering effects. All measurements were performed at room temperature and the reported values represent the number-weighted average hydrodynamic diameter.
2.3.5. UV Spectrometer
UV-Vis absorption spectroscopy was used to confirm the presence of bovine serum albumin (BSA) on the surface of the iron oxide nanoparticles. Spectra were recorded using a Shimadzu UV-Vis spectrophotometer (Shimadzu Corporation, Kyoto, Japan). Stock dispersions of BSA-coated iron oxide nanoparticles (2 mM) were diluted into deionized water to a final concentration of 0.4 mM. Aliquots of 2 mL were prepared in quartz cuvettes (1 cm path length). For comparison and confirmation of BSA coating, a reference solution of pure BSA was prepared by dissolving a small amount of BSA in ultra-pure water at equivalent protein concentration (e.g., 0.1–1 mg/mL). Both samples and the BSA reference were gently pipetted to ensure homogeneity and degassed to remove air bubbles or BSA foam. Cuvettes were rinsed 3 times with deionized water before filling. Deionized water served as the blank. Absorbance spectra were recorded from 200 to 800 nm to identify characteristic BSA protein absorption bands (~280 nm) alongside nanoparticle plasmonic features, confirming successful protein coating on the iron oxide cores. The BSA functionalized nanoparticles exhibited a characteristic absorption band around 280 nm attributed to the aromatic amino acid residues (trptophan and tyrosine) of BSA, which was absent in the spectra of bare iron oxide nanoparticles.
2.3.6. Fourier Transform Infrared Spectroscopy (FTIR)
A Perkin Elmer Fourier Transform Infrared (FTIR) Spectrometer (Perkin Elmer, Waltham, MA, USA) was used to scan the dried nanoparticles. Drops (~5–10 µL) of concentrated BSA-coated iron oxide nanoparticle dispersion, pure BSA solution, and uncoated iron oxide nanoparticle dispersion were separately deposited on clean KBr crystals and allowed to air-dry completely at room temperature to form thin films. Dried samples were then mounted in the FTIR instrument for measurement. Spectra were recorded in the 400–4000 cm^−1^ range at 4 cm^−1^ resolution with 64 scans averaged. FTIR was also used to confirm BSA functional groups.
2.3.7. Determination of Iron Concentration
The iron concentration of the nanoparticles was determined using an Agilent 5800 VDV inductively coupled plasma optical emission spectrometer (ICP-OES; Agilent Technology, Santa Clara, CA, USA) equipped with an SPS 4 autosampler and a recirculating chiller. The instrument was operated under manufacturer-recommended conditions. Briefly, an aliquot of the stock dispersion (5 µL, containing approximately 3.5 mg/mL iron concentration) was transferred into a 0.5 mL centrifuge tube containing 95 µL of deionized water. Aqua regia (HCl and HNO3, 3:1) (100 µL) was added and sonicated for 30 min for complete digestion of the iron oxide core and BSA coating of the sample. A freshly prepared dilution matrix (~0.5% HCl, 5% HNO_3_) was used to dilute the samples to the range of 0.5–0.8 ppm. Calibration standards in the range of 0.125, 0.25, 0.5, 1, and 2 ppm Fe were prepared from a certified 200 ppm Fe standard using the same acid matrix solution (~0.5% HCl, 5% HNO_3_). All standards were prepared fresh daily, measured in triplicate alongside digested nanoparticle samples to construct a linear calibration curve (R^2^ > 0.999). Sample iron concentrations were determined by interpolation from this calibration curve and corrected for all serial dilution factors applied during sample preparation. Data acquisition and quantitative analysis were performed using ICP ExpertTM software (v7.6.2, Agilent Technologies). Quality control checks were conducted to ensure measurement accuracy and reproducibility.
2.3.8. In Vitro MRI Relaxivity Study
Relaxivity measurements were performed on a 3T clinical Prisma MRI scanner (Siemens Heathineers, Erlangen, Germany). Aliquots (2 mL) of BSA-coated iron oxide nanoparticle dispersions at iron concentrations of 0.8, 0.4, 0.2, 0.1, and 0.05 mM were prepared in 4 mL glass vials and arranged in a multi-sample phantom holder. Vials were positioned at the scanner isocenter using a dedicated head coil with room temperature at 22 °C. T1 and T2 relaxation times were determined using standard sequences. A series of T1-weighted images was acquired by a 2D inversion-recovery spin-echo pulse sequence at multiple times of inversion (TIs) (TR = 7000 ms, TI = 50, 150, 300, 450, …, 2500 ms, slice thickness = 5 mm). T2-weighted images were acquired by a 2D multi-echo T2-weighted spin-echo pulse sequence (TR = 4000 ms, 10 TEs from 10 ms to 100 ms at a step of 10 msec, slice thickness = 5 mm). Imaging field of view (FOV) was 180 × 90 mm and the matrix size was 192 × 96. The specific relaxivities of r1 and r2 (mM^−1^s^−1^) for nanoparticles were computed by taking the linear slope of 1/T2 (or 1/T1) versus Fe concentration.
3. Results and Discussion
3.1. Synthesis and Characterization
The Fe_3_O_4_@BSA nanoparticles were synthesized through the co-precipitation method as outlined in Figure 1. Co-precipitation is a commonly used approach for fabrication of Fe_3_O_4_ nanoparticles because the reaction is carried out in aqueous solutions under relatively low temperatures. No further surface modification is required to achieve water dispersibility. Due to its high compatibility and common availability, BSA was used as template and surface coating material in the mixture of ferric and ferrous salt.
In the synthesis, BSA solution was mixed with ferric and ferrous salt solution (molar ratio of 2:1). After purging with argon gas, NaOH solution was added slowly under stirring at an elevated temperature. To control the size of iron oxide nanoparticles, the relative ratio of iron and BSA was adjusted. The size was characterized by TEM after purification (Figure 2). The effect of BSA in the control of the nanoparticle size is clearly observed in the TEM images. The sizes obtained at different Fe:BSA molar ratios of 43:1, 83:1, 165:1, and 330:1 are 3.7 ± 0.1 nm, 4.4 ± 0.9 nm, 6.0 ± 1.0 nm, and 7.9 ± 1. 5 nm respectively. The particle sizes increase with decreasing BSA. Interestingly, when NH_4_OH was used instead of NaOH, the nanoparticle size could not be tuned by varying the Fe:BSA ratio.
Studies have reported that Fe_2_O_3_ nanoparticles are better T1 contrast agents than Fe_3_O_4_ [17]. To study the T1 imaging property, the resulting Fe_3_O_4_ was further oxidized with hydrogen peroxide. Upon the oxidation of Fe_3_O_4_@BSA to Fe_2_O_3_@BSA, there was no significant change in the sizes of the iron oxide nanoparticles (Figure 3). The sizes at different Fe:BSA molar ratios—43:1, 83:1, 165:1, and 330:1—were 3.8 ± 0.7 nm, 4.6 ± 0.7 nm, 6.2 ± 0.9 nm, and 7.8 ± 1. 5 nm respectively.
3.2. XRD and XPS
The crystal structure of the nanoparticles was further studied by X-ray diffraction (XRD). From the XRD data (Figure 4), the characteristic diffraction peaks for the nanoparticles are clearly observed, and these diffraction peaks align well with the theoretical patterns (JCPDS 19-0629). Indicated by the relatively sharp diffraction peaks, the nanoparticles appear to be highly crystalline. In addition, the peak intensity increases with increasing particle size. According to the Scherrer equation, the crystal sizes of the nanoparticles for Fe_3_O_4_@BSA with different Fe:BSA molar ratios—43:1, 83:1, 165:1, and 330:1—are calculated as 3.9, 4.9, 6.6, and 7.0 nm respectively, while those of Fe_2_O_3_@BSA are 4.0, 5.6, 6.9, and 7.9 nm respectively. The crystal sizes are close to the values from the TEM images, confirming the size control of iron oxide nanoparticles using BSA. Based on XRD data, Rietveld refinement and the Le Bail method were reported to be employed to extract structural parameters [36]. However, the lattice parameters of Fe_3_O_4_ and Fe_2_O_3_ are very similar and are widely reported to be difficult to distinguish [36,37]. In addition, the nanoparticles synthesized in this study are ultra-small and coated with BSA. The XRD patterns exhibit significant peak broadening, which may reduce the accuracy and reliability of structural parameters obtained from Rietveld refinement.
To further investigate the different phases, XPS was conducted to characterize the Fe_3_O_4_@BSA and Fe_2_O_3_@BSA nanoparticles. As shown in Figure 5A, two peaks of 710.59 eV (2p_3/2_) and 724.26 eV (2p_1/2_) were observed for the Fe_3_O_4_ phase, which are slightly lower than those of the Fe_2_O_3_ phase [31]. In contrast, two peaks of 710.83 eV (2p_3/2_) and 724.30 eV (2p_1/2_) were observed for Fe_2_O_3_@BSA (Figure 5B), which can be attributed to Fe (III). In addition, a significant satellite peak at 718.68 eV was identified, which further confirms the formation of Fe_2_O_3_ [31,38,39].
3.3. FT-IR
Since BSA was used in the synthesis, we expected that BSA was coated on the surface of the nanoparticles. To confirm the coating material on the surface of nanoparticles, Fourier transform infrared (FT-IR) for synthesized nanoparticles was performed. For comparison, the FT-IR for pure BSA was collected as control. As shown in Figure 6, the absorptions of 1644 cm^−1^ and 1528 cm^−1^ correspond to the C=O and N–H stretching vibrations [40]. The broad band at 3000–3600 cm^−1^ corresponds to the O–H and N–H stretching. The absorption at 560 cm^−1^ is attributed to Fe–O vibration. The characteristic peaks of BSA were clearly identified on Fe_2_O_3_@BSA and Fe_3_O_4_@BSA, indicating the surface coating of the iron oxide nanoparticles with BSA.
3.4. UV-Vis
Because BSA typically has UV absorption at 280 nm, the UV spectra of the resulting nanoparticles were collected to confirm their coating materials (Figure 7). Compared with iron oxide nanoparticles without the surface coating, the UV spectra of both Fe_3_O_4_@BSA and Fe_2_O_3_@BSA show the characteristic BSA absorption peak around 280 nm. The UV spectra suggest that the surface coating on the iron oxide nanoparticles is BSA [41]. These results confirm that the nanoparticles consist of iron oxide cores coated with BSA. The exact amount of BSA on each nanoparticle was not concluded in this study, although previous work has reported approximately 6–7 BSA subunits per nanoparticle [31].
3.5. Water Dispersibility
High water dispersibility plays a key role for the biomedical application of iron oxide nanoparticles. Traditionally, iron oxide nanoparticles with precisely controlled size can be synthesized by thermal decomposition. However, the problem is that the synthesized nanoparticles can only be dispersed in organic solvents. A surface modification is needed to provide water dispersibility [14]. The water dispersibility largely depends on the presence of hydrophilic coating ligands. Bovine serum albumin (BSA) is a water-soluble natural protein and highly biocompatible [42]. BSA contains hydrophilic groups that coordinate with the Fe ions [32]. The coating of BSA on the surface of nanoparticles could significantly improve water dispersibility. As shown in Figure 8, Fe_2_O_3_@BSA nanoparticles of various sizes exhibit excellent dispersibility. Furthermore, the solution is stable up to 7 days in different aqueous media, including DI water, PBS, and NaCl (0.9%), which has a high ion strength. The BSA-coated nanoparticles are highly stable in physiological solution, which is important for biomedical applications.
3.6. Hydrodynamic Diameter
The water dispersibility was further evaluated by dynamic light scattering (DLS). As shown in Figure 9, a single peak was observed for all nanoparticles and the hydrodynamic size was relatively small. For example, Fe_3_O_4_@BSA of different Fe:BSA molar ratios—43:1, 83:1, 165:1 and 330:1—has a hydrodynamic size of 14.4, 20.1, 36.1 and 60.0 nm respectively. The hydrodynamic size of the nanoparticles in deionized water reduces with increasing BSA in the Fe:BSA molar ratio (43:1 < 83:1 < 165:1 < 330:1), which agrees with the TEM data. The relatively small hydrodynamic sizes further support the excellent water dispersibility of the nanoparticles.
3.7. Relaxivity Studies
Iron oxide nanoparticles hold great potential as contrast agents for MRI. One of the advantages of iron oxide nanoparticles is biocompatibility, which has been proven by clinical usage. In MRI, contrast agents reduce the T1 and T2 relaxation times of nuclei in tissues. The T1 contrast agents have relative reduction in T1, while T2 contrast agents have relative reduction in T2. Their efficiency is measured in terms of their relaxivity values (r1 and r2) [43]. The longitudinal relaxation time (T1) and transverse relaxation time (T2) of Fe_3_O_4_@BSA and Fe_2_O_3_@BSA were evaluated using an MRI scanner at 3T. When the graph of 1/T1 and 1/T2 was plotted against iron concentration, the slopes r1 and r2 were obtained respectively.
The size of nanoparticles has a great impact on their relaxivity and MRI performance. The representative plots are shown in Figure 10. For Fe_3_O_4_@BSA with Fe:BSA molar ratios of 42.5:1, 82.5:1, 165:1 and 330:1, the r1 values are 1.86, 3.89, 4.03 and 3.91 mM^−1^ s^−1^ respectively, and the r2 values are 42.87, 63.39, 131.10 and 281.28 mM^−1^ s^−1^ respectively.
For Fe_3_O_4_@BSA, the r2/r1 ratios at Fe:BSA molar ratios of 330:1, 165:1, 83:1, and 43:1 are listed in Table 1. The r2/r1 ratio generally decreases with decreasing particle size, and the smallest ratio was observed at 83:1. Interestingly, the ratio increased again to 43:1 despite this sample having the smallest size (3.7 ± 0.8 nm). This may result from the large amount of BSA coating at this ratio, which can limit interactions between the magnetic core and surrounding water molecules [44].
The r2/r1 ratios of Fe_2_O_3_@BSA were also investigated and are shown in Table 2. As expected, the r2/r1 ratios of Fe_2_O_3_@BSA were consistently lower than those of Fe_3_O_4_@BSA. Similar to Fe_3_O_4_@BSA, the smallest r2/r1 ratio (11.52) was observed at 83:1. The r2/r1 value of 11.52 is relatively low and is almost the same as the previously reported value (10.6) for BSA-coated iron oxide nanoparticles [31]. The r2/r1 ratio for Ferumoxyltol was reported to be 12.3, which is higher than the value obtained in this study [45]. The small r2/r1 ratio of Fe_2_O_3_@BSA synthesized in this work demostrate the potential for T1-weighed MRI.
3.8. Phantom Study
We further conducted phantom studies of the iron oxide nanoparticles in solution. As shown in Figure 11, T2 phantom images were acquired for Fe_3_O_4_@BSA and Fe_2_O_3_@BSA with different Fe:BSA ratios. With increases in concentrations, the imaging became dark. The imaging was darker at the same concentration for larger nanoparticles. The results are consistent with the high r2. Although the nanoparticles have small sizes, those with Fe:BSA molar ratios of 165:1 and 330:1 exhibited noticeable T2 effects at higher concentrations. Consistent with other iron oxide nanoparticles, the BSA-coated nanoparticles could potentially be used as T2 contrast agents [14].
Due to the small sizes, our BSA-coated iron oxide nanoparticles can be used as high-performance T1 contrast agents. The T1 phantom images are shown in Figure 12. All nanoparticles at different concentrations displayed a T1 brightening effect. For Fe_3_O_4_@BSA, the 83:1 Fe:BSA ratio exhibited the strongest T1 brightening effect and the lowest r2/r1 ratio. For Fe_2_O_3_@BSA, the 83:1 Fe:BSA ratios showed enhanced T1 brightening and correspondingly lower r2/r1 ratios compared to the other samples. These phantom studies clearly demonstrate that the BSA-coated nanoparticles are stable and suitable for T1-weighted MRI applications. A T1-weighted contrast agent is usually favorable for clinical use.
4. Conclusions
In this study, we demonstrated that the size of iron oxide nanoparticles can be effectively controlled using a simple co-precipitation method by adjusting the Fe:BSA molar ratio. Increasing the amount of BSA led to smaller nanoparticles. XRD analysis confirmed that the nanoparticles are highly crystalline, with peak intensities increasing with particle size. FT-IR and UV-Vis spectroscopy verified successful BSA coating on the nanoparticle surfaces. The resulting Fe_2_O_3_@BSA nanoparticles exhibited excellent water dispersibility across different pH and high-ionic-strength solutions.
Oxidation of Fe_3_O_4_@BSA to Fe_2_O_3_@BSA enhanced the T1 contrast properties of the nanoparticles, with r2/r1 ratios lower than those of Fe_3_O_4_@BSA. Phantom studies further confirmed the stability and T1 imaging capability of the BSA-coated nanoparticles. The value is comparable to the lowest r2/r1 ratios reported in the literature.
Compared to conventional thermal decomposition methods, which require organic solvents and high temperatures, this co-precipitation approach uses water as the solvent and mild reaction conditions. The method is low-cost, non-toxic, and time-efficient, making it a practical and scalable strategy for producing ultra-small, biocompatible iron oxide nanoparticles suitable for biomedical imaging applications.
The reference list from the paper itself. Each links out to its DOI / PubMed record.
- 1Carr M.W. Grey M.L. Magnetic resonance imaging Am. J. Nurs.2002102263310.1097/00000446-200212000-0001212473927 · doi ↗ · pubmed ↗
- 2Katti G. Ara S.A. Shireen A. Magnetic resonance imaging (MRI)-A review Int. J. Dent. Clin.201136570
- 3Zhou Z. Bai R. Munasinghe J. Shen Z. Nie L. Chen X. T 1–T 2 Dual-Modal Magnetic Resonance Imaging: From Molecular Basis to Contrast Agents ACS Nano 2017115227523210.1021/acsnano.7b 0307528613821 PMC 9617470 · doi ↗ · pubmed ↗
- 4Jeon M. Halbert M.V. Stephen Z.R. Zhang M. Iron Oxide Nanoparticles as T(1) Contrast Agents for Magnetic Resonance Imaging: Fundamentals, Challenges, Applications, and Prospectives Adv. Mater.202133 e 190653910.1002/adma.20190653932495404 PMC 8022883 · doi ↗ · pubmed ↗
- 5Zhao Y. Sultan D. Detering L. Cho S. Sun G. Pierce R. Wooley K.L. Liu Y. Copper-64-alloyed gold nanoparticles for cancer imaging: Improved radiolabel stability and diagnostic accuracy Angew. Chem. (Int. Ed. Engl.)20145315615910.1002/anie.20130849424272951 · doi ↗ · pubmed ↗
- 6Uhlig J. Al-Bourini O. Salgado R. Francone M. Vliegenthart R. Bremerich J. Lotz J. Gutberlet M. Gadolinium-based Contrast Agents for Cardiac MRI: Use of Linear and Macrocyclic Agents with Associated Safety Profile from 154,779 European Patients Radiol. Cardiothorac. Imaging 20202 e 20010210.1148/ryct.202020010233778622 PMC 7977928 · doi ↗ · pubmed ↗
- 7Xiao Y.D. Paudel R. Liu J. Ma C. Zhang Z.S. Zhou S.K. MRI contrast agents: Classification and application (Review)Int. J. Mol. Med.2016381319132610.3892/ijmm.2016.274427666161 · doi ↗ · pubmed ↗
- 8Wang K. An L. Tian Q. Lin J. Yang S. Gadolinium-labelled iron/iron oxide core/shell nanoparticles as T 1–T 2 contrast agent for magnetic resonance imaging RSC Adv.20188267642677010.1039/C 8RA 04530 E 35541075 PMC 9083088 · doi ↗ · pubmed ↗