Association Between Health‐Related Physical Fitness and Cognition in Preschoolers: MOVI‐HIIT Study
María E. Visier‐Alfonso, Mairena Sánchez‐López, Bruno Bizzozero‐Peroni, Ana Díez‐Fernández, Abel Ruiz‐Hermosa, Vicente Martínez‐Vizcaíno

TL;DR
Preschoolers with better physical fitness show improved cognitive abilities, with balance, cardiorespiratory fitness, and speed-agility being key factors.
Contribution
This study identifies specific fitness components linked to cognitive domains in preschoolers using a large cross-sectional sample.
Findings
All HRPF components were positively associated with cognitive domains (r = 0.11–0.38).
Balance, CRF, and speed-agility were most strongly linked to better cognitive outcomes.
High fitness levels reduced odds of low cognitive performance in preschoolers.
Abstract
Preschoolers with better health‐related physical fitness (HRPF) have better cognitive and brain functioning. This study examined the associations between health‐related physical fitness and cognitive domains in preschool children, including the independent role of fitness components, potential moderators, and links to low cognitive achievement. This was a cross‐sectional study analyzing baseline data from a randomized controlled trial (MOVI‐HIIT) including 522 preschoolers aged 3–5 years from 9 schools in Ciudad Real, Spain. Speed‐agility, upper and lower body muscle strength, cardiorespiratory fitness (CRF), and balance were measured with the PREFIT battery. Cognition was measured using the Differential and General Aptitude Battery (numerical concepts and vocabulary), Flanker Task (inhibition), Dimensional Change Card Sort (cognitive flexibility), and Span of words (working memory);…
Genes, proteins, chemicals, diseases, species, mutations and cell lines named across the full text — each resolved to its canonical identifier and authoritative record.
Click any figure to enlarge with its caption.
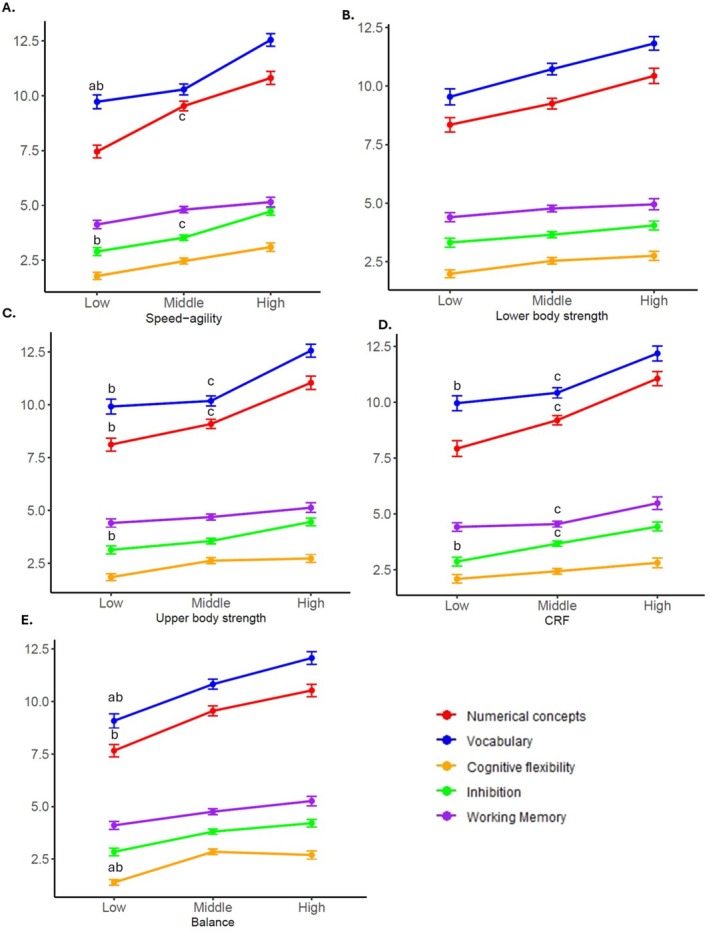 FIGURE 1
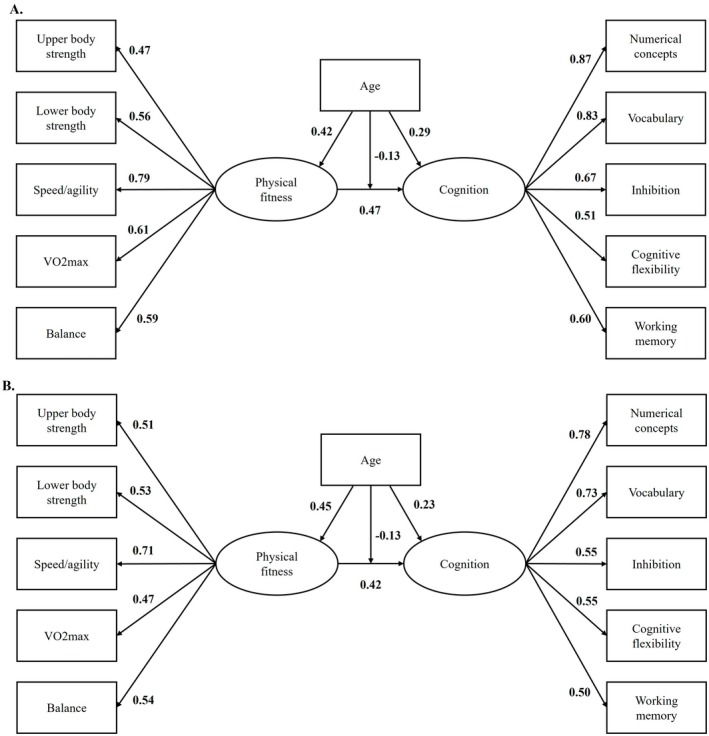 FIGURE 2
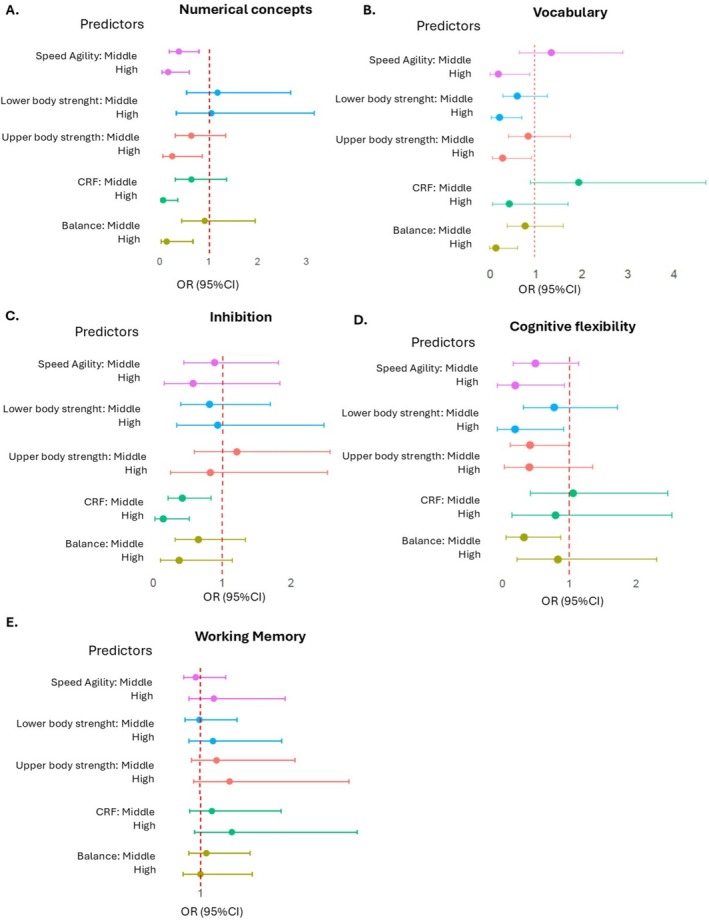 FIGURE 3
| Variables | Total | Boys | Girls |
|
|
|---|---|---|---|---|---|
| M (SD) | M (SD) | M (SD) | |||
|
|
|
| |||
| Age (months) | 57 (7) | 57 (8) | 57 (6) | 0.301 |
|
| Height (cm) | 108.1 (5.7) | 108.9 (5.9) | 107.3 (5.5) |
|
|
| Weight (kg) | 18.2 (3.5) | 18.6 (3.6) | 17.9 (3.5) |
|
|
| BMI (kg/m2) | 15.5 (2.0) | 15.6 (2.0) | 15.4 (2.1) | 0.206 |
|
| Waist circumference (cm) | 53.3 (5.7) | 53.6 (5.3) | 53.1 (6) | 0.317 |
|
| Body fat (%) | 20.4 (4.8) | 20.6 (4.2) | 20.3 (5.3) | 0.142 |
|
| SES | |||||
| Low | 91 (22) | 43 (20) | 48 (23) | ||
| Middle | 233 (55) | 123 (56) | 110 (54) | 0.653 |
|
| High | 99 (23) | 52 (24) | 47 (23) | ||
| Screen time (h/week) | 6 (4) | 6 (3) | 6 (4) | 0.580 | |
| Physical activity (h/week) | 5 (2) | 5 (2) | 5 (2) | 0.414 |
|
| Health related physical fitness: | |||||
| Speed‐agility (4 × 10 m) | 17.1 (2.1) | 16.9 (1.9) | 17.4 (2.4) |
|
|
| Lower body strength (cm) | 71 (20) | 75 (21) | 67 (17) |
|
|
| Upper body strength (kg) | 7.0 (2.0) | 7.0 (2.0) | 6.5 (2.0) |
|
|
| Cardiorespiratory fitness (laps) | 18 (10) | 19 (11) | 17 (8) |
|
|
| Balance (seg) | 15 (9) | 14 (9) | 16 (9) |
|
|
| Cognition | |||||
| Numerical concepts (BaDyG) | 9 (3) | 10 (4) | 9 (3) | 0.099 |
|
| Vocabulary (BaDyG) | 11 (4) | 11 (4) | 11 (4) | 0.100 |
|
| Inhibition (FT) | 3.65 (2.03) | 3.55 (2.10) | 3.74 (1.96) | 0.438 |
|
| Cognitive flexibility (DCCS) | 2.44 (2.03) | 2.41 (2.02) | 2.47 (2.04) | 0.361 |
|
| Working memory (Word Span) | 5 (2) | 5 (2) | 5 (2) | 0.372 |
|
| Numerical concepts (BaDyG) | Vocabulary (BaDyG) | Inhibition (FT) | Cognitive flexibility (DCCS) | Working memory (Word Span) | |
|---|---|---|---|---|---|
| Speed‐agility |
|
|
|
|
|
| Lower body strength |
|
|
|
|
|
| Upper body strength |
|
|
|
|
|
| CRF |
|
|
|
|
|
| Balance |
|
|
|
|
|
| Body fat % | −0.04 (−0.13;0.05) | −0.09 (−0.18; 0.00) | 0.01 (−0.08; 0.10) | −0.04 (−0.13; 0.05) |
|
| Age |
|
|
|
|
|
| SES |
|
| 0.08 (−0.01;0.17) | 0.02 (−0.15;0.04) |
|
| Physical activity | 0.00 (−0.01; 0.08) | −0.01 (−0.10;0.08) | −0.03 (−0.13;0.06) | 0.01 (−0.08;0.10) | −0.06 (−0.15;0.04) |
| Screen time |
|
| −0.05 (−0.14;0.05) | −0.01 (−0.10;0.09) |
|
- —Spanish Ministry of Science, Innovation, and Universities
Peer Reviews
No public reviews on file for this paper yet. If you reviewed it on a platform where reviews are public (OpenReview, ICLR, NeurIPS, ICML), you can paste yours below so the community can read it here.
Videos
No videos yet. Explain this paper in a talk, walkthrough, or lecture? Add one.
Taxonomy
TopicsChildren's Physical and Motor Development · Infant Development and Preterm Care · Obesity, Physical Activity, Diet
Introduction
1
Cognitive development during early childhood is a critical determinant of later academic achievement, mental health, and social functioning [1, 2]. The preschool years represent a sensitive period for the maturation of core cognitive domains, including executive functions, language, and reasoning, which lay the foundation for school readiness and lifelong learning [3, 4]. Environmental and behavioral factors acting during this stage may have lasting effects on neurodevelopment, highlighting the importance of identifying modifiable determinants of cognitive health early in life [5].
Health‐related physical fitness (HRPF) in children is linked with physical and mental health [6], and cognitive development [7]. However, several components of HRPF, particularly cardiorespiratory fitness, muscular strength, motor competence, and flexibility, have shown declining trends in children over recent decades [8, 9], largely driven by increasing sedentary behaviors, such as screen time, and unhealthy lifestyle patterns [10, 11]. Although evidence on temporal trends in preschoolers is more limited, these patterns could be especially concerning during the preschool years, a critical window for both motor and cognitive development [12]. Evidence suggests a positive association between HRPF and cognitive performance in school‐aged children [13] with links to executive functions [14] potentially mediated by neurobiological, behavioral, and psychosocial mechanisms [15]. However, research in preschool populations remains limited and inconsistent [16], often constrained by small samples and methodological variability [12]. In this context, the PREFIT battery has emerged as a feasible and reliable tool to comprehensively assess HRPF in preschool children [6, 17], enabling large‐scale and methodologically robust research in this age group.
Evidence suggests a positive association between HRPF and cognitive performance in preschool children [13], with particularly consistent links to executive functions such as inhibitory control and working memory [16, 18]. These associations are thought to be mediated by neurobiological, behavioral, and psychosocial mechanisms, including increased cerebral blood flow, neural plasticity, motor learning, and attentional engagement [15]. However, research in preschool populations remains limited and inconsistent, often constrained by small sample sizes, heterogeneous cognitive assessments, and insufficient control for key confounders such as socioeconomic status, screen time, and body composition [19].
From a developmental perspective, different components of HRPF may relate to specific cognitive domains through partially distinct mechanisms. Cardiorespiratory fitness has been associated with neurobiological processes such as increased cerebral blood flow and neural plasticity [20], which are thought to preferentially support executive functions in children, particularly inhibitory control and working memory [21]. Motor‐related components, including speed–agility and balance, involve complex coordination, sensorimotor integration, and attentional control, which may be especially relevant for cognitive regulation processes in early childhood [21, 22]. Muscular strength may reflect broader neuromuscular maturation and overall physical activity exposure, potentially contributing to cognitive development [23].
Importantly, during preschool years, cognitive domains remain weakly differentiated and better represented by a largely unitary construct [24, 25], suggesting that mechanisms linking HRPF and cognition may extend beyond executive functions to broader abilities such as reasoning and vocabulary [26]. These domains are closely related to school readiness and later academic achievement yet remain underexplored in relation to HRPF in early childhood. The present study was designed to provide a comprehensive examination of multiple HRPF components and cognitive domains in preschool children. While informed by existing theoretical and empirical evidence, the analyses were partly exploratory, aiming to clarify domain‐specific patterns that remain insufficiently studied in early childhood. Clarifying which health‐related physical fitness (HRPF) components are most strongly associated with executive functions and broader cognitive domains may help inform early childhood health and educational strategies. Accordingly, this study aimed to examine the associations between HRPF and multiple cognitive domains in preschool children and to disentangle the specific contributions of individual HRPF components. We further investigated whether these associations were moderated by age, sex, socioeconomic status, and screen time. As a secondary objective, we aimed to identify HRPF components associated with low cognitive achievement.
Materials and Methods
2
This was a cross‐sectional analysis of data from baseline measurements of a cluster‐randomized trial (trial registration: NCT04863040) designed to test the effectiveness of an active breaks intervention (MOVI‐HIIT) in children 3–6. Baseline assessments were conducted after cluster randomization but prior to intervention implementation. The Clinical Research Ethics Committee of the General Hospital of Ciudad Real (Spain) approved the study protocol (REG:C‐254), which was also approved by the director and board of governors of each school. A letter was sent to the families requesting written consent for the child's participation in the study. Additionally, children were asked for verbal consent prior to participating in each test.
All children in the second and third courses of preschool education from the nine schools in urban and rural locations involved in the study were invited to participate (n = 622). Parents/guardians provided written consent for 522 children (response rate = 83.9%). The final analytic sample included 522 preschoolers (51.5% girls, age range 45–75 months, mean age 57 months [SD = 7]), who met the following inclusion criteria: (1) enrolled in the second or third course of preschool education; (2) understanding of Spanish language; (3) not having any learning disability; (4) not having any type of physical or mental disorder that parents and/or teachers had identified; (5) having the collaboration of a family member to answer questionnaires about free‐time family habits; and (6) consent of the parent or guardian for participating in the study.
The study variables were measured at school by trained investigators under standardized conditions during September–October 2022.
Health Related physical fitness was measured using the PREFIT battery [6]. All tests were administered according to standardized PREFIT procedures; feasibility and test–retest reliability for each test in preschool children have been previously reported [17]. All tests were conducted in the school gymnasium on the same day and during the last three hours of the morning. Before testing, participants completed a standardized 3‐min warm‐up consisting of a brief game involving running and jumping. Tests were administered individually in a randomized order, except for the cardiorespiratory fitness test, which was consistently performed last and carried out in groups of eight children. Throughout the assessment, evaluators provided continuous standardized encouragement to maximize participants' effort and performance. The administration procedures for each test are described below:
Speed‐Agility, using the 4 × 10 m shuttle run test. The lines were marked on the floor using yellow adhesive tape. Children run four times between two lines (10 m apart) as fast as possible. Two evaluators were stationed at each end, and participants were required to touch the evaluator's hand (held just beyond the line) and return as quickly as possible. Two attempts were made with an interval of 5 min, and the best time (seconds) was used for analysis. Less time represents better results.
Lower Body Muscle Strength, Using the Standing Broad Jump Test. From a starting position immediately behind a line, with feet shoulder‐width apart, the preschoolers jump horizontally to achieve maximum distance on a non‐slip mat featuring a marked take‐off line and 5‐cm graduations. The best of three attempts was recorded (cm).
Upper Body Muscle Strength, Using an Analogue Version of Dynamometer With Adjustable Grip TKK 5401 Grip‐DW (Takeya, Tokyo, Japan). The grip span was fixed at 4.0 cm. Preschoolers applied a gradual, continuous maximal squeeze for ≥ 2–3 s, performing two alternating trials with each hand, with the elbow fully extended and no other body contact with the dynamometer; the mean (kg) of the four measurements was calculated.
CRF, using the adapted and validated version PREFIT of the Course Navette test (20‐min shuttle run test) for preschoolers [27]. Children were asked to run between two lines 20 m apart while keeping pace with audio signals. The initial speed was 6.5 kmh‐1, which was increased by 0.5 kmh‐1. In each group of eight children, two evaluators ran ahead to help maintain the required pace. The number of laps completed was recorded.
Balance, Using the One‐Leg Stance Test. The child stood quietly on one foot with the contralateral leg flexed at the knee, maintaining the position for as long as possible. Two attempts were made with each leg, and the average time (seconds) was recorded.
Cognition was assessed in quiet conditions using the following tests:
‐Intelligence and Mental ability, with two dimensions of the Differential and General Aptitude Assessment Battery for Early Childhood Education students (BADyG‐I) for preschool children [28], which has been developed and adapted to preschool sample, showing good‐to‐excellent reliability for composite scores (α = 0.82–0.92) and acceptable construct validity supported by internal‐structure analyses in large normative samples. In both tests, the final score was computed as the sum of correct responses, with each correct answer awarded one point, yielding a maximum possible score of 18.
Verbal understanding of basic quantitative/numerical concepts, with the scale quantitative/numerical concepts that assess knowledge and understanding of basic concepts of quantity and number, essential for numerical reasoning. The participants were asked to choose the drawing that fulfills the term presented (counting, addition or subtraction, equating quantities and/or dimensions, discriminating numbers, or arithmetical symbols).
Vocabulary or assimilation of basic knowledge of the environment was measured with the scale Information. This test assessed the assimilation of data related to the socio‐cultural environment, memorized knowledge, and knowledge assimilated through oral exchange. The child was required to select the drawing that meets the definition expressed by the evaluator.
Inhibition and cognitive flexibility were measured using the NIH Toolbox [29] which was specifically designed and validated for children aged 3–15 years. Psychometric analyses showed adequate to excellent test–retest reliability (intraclass correlation coefficients 0.92), as well as satisfactory convergent and discriminant validity with well‐established developmental instruments [30]. We used the validated Spanish version, which has shown high test–retest reliability (0.59–0.69) and convergent validity [31]. Inhibition was measured an adapted version of the Eriksen Flanker Task [32]. Children were required to indicate the left–right orientation of a centrally presented stimulus while inhibiting attention to the potentially incongruent stimuli surrounding it. In some trials, the orientation of the flanking stimuli is congruent with the orientation of the central stimulus, and in other trials, incongruent. The task included four practice trials, and if passed, a 20‐trial block was presented. The trials consisted of a sequence of congruent and incongruent sets of arrows. Using a two‐vector method that incorporated both accuracy and reaction time, a final score was calculated for participants who maintained a high level of accuracy (> 80%) as follows: (0.25 × number of correct responses) + 5 –LOG10 [(congruent reaction time + incongruent reaction time/2)]. For children scoring < 80%, a total score considering accuracy was calculated. Unadjusted computed scores were used for the analysis [33]. Cognitive flexibility was measured using the Dimensional Change Card Sort test [32]. This test presented a stimulus by “color” or “shape,” and participants were asked to adapt their response according to the relevant dimension. The task included four practice trials; if passed, children were presented a 30‐trial block with both “shape” and “color” requirements. With accuracy percentage and reaction time on pre‐switch and post‐switch, a raw score was obtained, using a two‐vector method that incorporated both accuracy and reaction time, a final score was calculated for participants who maintained a high level of accuracy (> 80%) as follows: (0.167 × number of correct responses) + 5 –LOG10 [(congruent reaction time + incongruent reaction time/2)]. For children scoring < 80%, a total score considering accuracy was performed. Unadjusted computed scores were used for the analysis [33].
Working memory was measured with the Word Span [34], based on the Digit Span subtest from the Wechsler Intelligence Test for Children‐3rd edition (WISC‐III) [35]. According to Thorell and Wählstedt [34] the preschool version uses words rather than digits due to the age of the participants. Using the scores from 24 children between the ages of 4–5 years tested two weeks apart, the test showed adequate test–retest reliability, 0.67. The Spanish adaptation of this test was used, in this version, the words were selected from among familiar concepts and adapted to the development of preschool vocabulary (e.g., cat, tree, and milk) [36, 37]. Word Span includes two tasks: Word Span Forward, and Word Span Backward. In the Word Span Forward task, the participant is asked to repeat a sequence of words of increasing length from memory in the same order. The length of the sequence varies between two and seven words, and two different sequences are presented for each length. The Word Span Backward task has the same characteristics as the previous one, but the process is different as the participant is asked to repeat the words in the reverse order from the spoken sequence. This task finishes when the participant is unable to remember either of the two same‐length sequences. In each task, a point is scored for each correctly remembered sequence. In studies with older samples, Word Span Forward has been considered a measure of processes of short‐term maintenance of information, and Word Span Backwards a measure more related to working memory capacity [38]. However, in individuals with low memory capacity (e.g., preschoolers), effortful processing is needed even in relatively simple tasks [34]. Consequently, we decided to include WSF as a measure of executive function as in previous studies [36, 37]. A mean final score is calculated [34].
Although executive function is commonly operationalized into inhibitory control, working memory, and cognitive flexibility, evidence suggests that in early childhood these components may be weakly differentiated and better represented by a largely unitary construct [24, 25]. In the present study, these domains were analyzed separately based on the structure of the assessment instruments and prior task‐based research in preschool samples [13, 18]. However, this operational distinction does not necessarily imply fully independent latent constructs at this developmental stage. No substantial floor or ceiling effects were observed, and no participants were excluded based on task performance.
Weight was measured with the average of two measurements (Seca861; seca GmbH & Co. KG, Hamburg, Germany scale), with a measurement resolution of 0.1 kg. Children were measured barefoot and in light clothing. Height was measured with the average of two measurements with a wall‐mounted measuring rod (Seca222; seca GmbH & Co. KG, Hamburg, Germany), to the nearest 0.1 cm, with the participant standing upright. Body Mass Index (BMI) was calculated using the formula weight (kg)/height (m^2^). Waist circumference was measured with the average of three measurements of waist circumference with a flexible, non‐stretch (non‐elastic) tailor measuring tape (commercially available; manufacturer not indicated on the device), at the midpoint between the last rib and the iliac crest, at the end of normal expiration, and recorded to the nearest 0.1 cm. Body fat was calculated with the mean of two measurements by 8‐electrode electrical bioimpedance model Tanita BC‐418 MA (Tanita Corp., Tokio, Japan), with results displayed and recorded with a resolution of 0.1% for body fat percentage.
Socioeconomic status (SES) was assessed by a questionnaire completed by parents based on the scale proposed by the Spanish Society of Epidemiology [39]. The questionnaire asks the level of education and occupation of both parents. Three SES categories were obtained using both the parents' education and occupation: lower, middle, and high. A higher score indicated higher SES.
Physical activity and screen time were assessed by ad hoc questionnaire completed by parents, in which they were asked about the number of hours that the child spent in physical activities and the number of hours of leisure time that the child spent viewing TV or using other electronic devices (computers, tablets, smartphones, or videogames) during the weekdays and weekend. The average of h/day of physical activity and screen time was calculated.
Age was calculated as the difference between the date of assessment and the date of birth and expressed in months as a continuous variable, to capture fine‐grained developmental differences during early childhood.
Statistical Analysis
2.1
To examine the normal distribution of continuous variables, graphical, and statistical (Kolmogorov–Smirnov test) methods were assessed. All continuous variables fit well within a normal distribution. Exploration of outlier and missing values (less than 10%) was performed. Outliers were examined visually and statistically; those identified as extreme but valid values were retained, while implausible or data‐entry errors were excluded from the analyses. Means (SDs) and percentages were calculated. T‐test and chi‐squared tests for independent samples was used to test for sex differences. In addition to p‐values, effect sizes were reported (Cohen's d for t‐tests and Cramer's V for chi‐squared tests). Effect sizes were calculated using Cohen's d and interpreted as small (0.20), medium (0.50), and large (0.80) and Cramer's V for SES interpreted as small (0.10), medium (0.30), and large (0.50). To examine the association between HRPF variables, cognition variables, and potential confounders, bivariate correlation coefficients were estimated (Pearson's r for approximately normally distributed variables and Spearman's ρ otherwise), reporting 95% CIs for correlation coefficients. The speed/agility variable was inverted. Categories of each HRPF component were calculated following the same procedure as previously reported elsewhere [16]. The categories for speed‐agility, lower body muscle strength, upper body muscle strength, CRF and balance correspond to the first quartile (Low), second and third quartiles (Middle), and the fourth quartile (High). Specifically. Low: > 18.4 seg in speed‐agility, < 56 cm in lower body muscle strength, < 5 kg in upper body muscle strength, < 10 laps in CRF, and < 8 seg in balance; Middle: 18.4–16.7 seg in speed‐agility, 57–85 cm in lower body muscle strength, 5.75–7.75 kg in upper body muscle strength, 11–23 laps in CRF, and 8–22 seg in balance; and High: > 15.6 seg in speed‐agility, > 86 cm in lower body muscle strength, > 8 kg in upper body muscle strength, > 24 laps in CRF, and > 22 seg in balance. Then, analysis of covariance (ANCOVA) was used to test differences in mean cognitive scores across categories of HRPF, with adjustments for age, sex, SES, and screen time, variables without significant correlations were excluded as covariates. For ANCOVA models, we report the main effect of HRPF category together with partial eta‐squared (ηp^2^) as an effect size and adjusted marginal means with pairwise differences. Post hoc pairwise comparisons were performed using the Bonferroni correction for multiple testing.
Additionally, we estimated a structural equation model to examine the association between physical fitness and cognition at the latent level. Two latent variables were specified: physical fitness and executive functions. To evaluate whether this association varied across individual and contextual characteristics, moderation effects were tested for age, sex, SES, and screen time. Latent interaction terms were constructed using the product‐indicator approach with mean‐centered indicators. All moderators were also included as main effects in the structural model. Models were estimated using robust maximum likelihood (MLR) with full information maximum likelihood to handle missing data. Model fit was evaluated using the χ^2^ test, CFI, TLI, RMSEA, and SRMR.
Finally, to examine the odds of low cognitive achievement, logistic regression models were performed. For logistic regression analyses, cognitive outcomes were dichotomized to define low achievement, and fitness variables were categorized into two categories as in previous studies [16] to facilitate interpretation and risk estimates. Low cognitive achievement was defined as the lowest decile (p < 10). Then, logistic regression models with each HRPF category as the predictor (low levels as the reference) to estimate the odds of low cognitive achievement in each cognitive domain, adjusting for confounders.
All analyses were conducted using the software R (v.4.4.3) and RStudio (v.RStudio 2024.12.1 + 563), using the lavaan package for structural equation models. The level of significance was set at p ≤ 0.050.
Results
3
The sample characteristics are summarized in Table 1. Regarding HRPF, boys showed higher performance in speed–agility, lower body strength, upper body strength, and CRF, whereas girls performed better in balance (all p < 0.01). However, effect sizes for these differences ranged from small to small‐to‐moderate (Cohen's d = 0.24–0.44). No statistically significant differences were found between boys and girls for any cognitive variable, and all corresponding effect sizes were trivial (Cohen's d ≤ 0.10).
Pearson and Spearman correlation coefficients among HRPF variables, cognition and confounders are shown in Table 2. Correlation coefficients are presented with 95% CIs. All HRPF components (speed‐agility, lower‐body strength, upper‐body strength, CRF, and balance) were positively associated with all cognitive domains (numerical concepts, vocabulary, inhibition, cognitive flexibility, and working memory) (r = 0.11–0.38; see Table 2 for 95% CIs; all p ≤ 0.050). Furthermore, age and screen time were positively and negatively associated, respectively, with all cognitive domains (r = 0.11–0.38; p ≤ 0.050) and (r = 0.23–0.44; p ≤ 0.050). Screen time was negatively associated with numerical concepts (r = −0.15; p ≤ 0.050), vocabulary (r = −0.18; p ≤ 0.050), and working memory (r = −0.18; p ≤ 0.050). SES was positively associated with numerical concepts (r = 0.22; p ≤ 0.050), vocabulary (r = 0.14; p ≤ 0.050), and working memory (r = 0.10; p ≤ 0.050). Body fat was only negatively associated with working memory (r = 0.11; p ≤ 0.050), and physical activity was not associated with any cognitive domain.
Mean difference in cognition by HRPF components, controlling for sex, age, SES, and screen time are shown in Figure 1. For speed–agility, significant group differences were found for numerical concepts (p < 0.001, ηp^2^ = 0.039), vocabulary (p = 0.003, ηp^2^ = 0.026), and inhibition (p < 0.001, ηp^2^ = 0.032). For upper body strength, significant differences were observed in numerical concepts (p < 0.001, ηp^2^ = 0.032), vocabulary (p < 0.001, ηp^2^ = 0.037), and inhibition (p = 0.042, ηp^2^ = 0.014). Regarding cardiorespiratory fitness, significant effects were found for numerical concepts (p < 0.001, ηp^2^ = 0.038), vocabulary (p = 0.009, ηp^2^ = 0.020), working memory (p = 0.023, ηp^2^ = 0.016), and inhibition (p = 0.005, ηp^2^ = 0.024). Finally, balance was significantly associated with numerical concepts (p = 0.001, ηp^2^ = 0.022), vocabulary (p = 0.004, ηp^2^ = 0.016), and cognitive flexibility (p < 0.001, ηp^2^ = 0.050). No significant differences were observed across lower body strength categories (all p > 0.05). Effect sizes for the main HRPF category effect are reported as partial eta‐squared (ηp^2^). Adjusted marginal means and Bonferroni‐corrected pairwise comparisons are presented as adjusted mean differences are provided in Table S1.
Mean difference in cognition by health‐related physical fitness categories, controlling for sex, age, socioeconomic status, and screen time. Data are shown as means and standard deviation. CRF, cardiorespiratory fitness. aDifferences between first and second quartiles of health‐related physical fitness components; bdifferences between first and third quartiles of health‐related physical fitness components; cdifferences between second and third quartiles of health‐related physical fitness components in the Bonferroni test. p < 0.050.
A structural equation model with two latent variables—physical fitness and cognition—was first estimated. The measurement model showed adequate fit to the data (RMSEA ≈ 0.07, SRMR = 0.07), supporting the proposed factorial structure for both constructs (Figure S1). All physical fitness indicators (upper‐ and lower‐body strength, speed/agility, CRF, and balance) and all cognitive indicators (numerical concepts, vocabulary, inhibition, cognitive flexibility, and working memory) loaded significantly on their respective latent factors (all p < 0.01). In this model physical fitness and cognition were strongly associated (β = 0.59, p < 0.001). Then, an exploratory model with sex, age, SES, and screen time as moderators showed a modest fit (Figure S2): χ^2^(57) = 361.03, p < 0.454; CFI = 0.95; TLI = 0.92., RMSEA = 0.042, 90% CI [0.010, 0.042], and SRMR = 0.055. Taken together, these results indicate that the model provides a reasonable approximation of the observed covariance structure and allows for substantive interpretation of the structural relations, particularly the moderation effects. In this model physical fitness was positively associated with cognition (β = 0.38, p < 0.001). Significant moderation effects were observed for age (β = −0.12, p = 0.005) and sex (β = −0.10, p = 0.045), indicating that the association between physical fitness and cognition was weaker at higher ages and differed by sex, being higher in boys. No significant interaction effects were found for screen time or socioeconomic status (Table S2).
Finally, a multigroup structural equation model by sex with age as moderator adjusted by SES, and screen time (Figure 2) showed excellent overall fit to the data (χ^2^(257) = 541.03, p = 0.001; CFI = 0.975; TLI = 0.970; RMSEA = 0.041, 90% CI [0.030, 0.042]; SRMR = 0.039), supporting the adequacy of both the measurement and structural components of the model, with a metric invariance of Δχ^2^(12) = 11.90, p = 0.454, indicating equivalent loads between sex. Physical fitness was positively and significantly associated with cognition in boys and girls (β = 0.42, p < 0.001; β = 0.47, p < 0.001), respectively. Age was also directly related to cognition (β = 0.29, p = 0.004) and significantly moderated the association between physical fitness and cognition in both groups (β_interaction = −0.13, p < 0.05), indicating that the strength of this relationship decreased with increasing age.
Multigroup factorial structural equation model between physical fitness and cognition moderated by age and adjusted by SES, and screen time. A Model for boys. B. Model for girls. Model fit indices: CFI = 0.975, TLI = 0.970, RMSEA = 0.041, 90% CI [0.030, 0.042], and SRMR = 0.051. Chi‐squared χ2(257) = 541.03, p = 0.001 (N = 458). Metric invariance: Δχ2(12) = 11.90, p = 0.454. Values in bold indicate statistical significance at p ≤ 0.05.
Logistic regression models controlling for sex, age, SES, and screen time to estimate the odds of low cognitive achievement are presented in Figure 3. Children with middle (OR = 0.37; 95% CI: 0.18–0.80; p = 0.008) and high (OR = 0.16; 95% CI: 0.04–0.79; p = 0.024) speed‐agility, and those with high levels of upper body strength (OR = 0.26; 95% CI: 0.06–0.99; p = 0.015), CRF (OR = 0.05; 95% CI: 0.01–0.60; p = 0.036), and balance (OR = 0.13; 95% CI: 0.02–0.99; p = 0.050) showed significantly lower odds of poor cognitive performance. In vocabulary, a reduced odds was observed in children with high speed‐agility (OR = 0.21; 95% CI: 0.04–0.99; p = 0.050), low body strength (OR = 0.24; 95% CI: 0.07–0.79; p = 0.018), upper body strength (OR = 0.33; 95% CI: 0.10–0.98; p = 0.050), and balance (OR = 0.17; 95% CI: 0.04–0.78; p = 0.016). For inhibition, being in the middle (OR = 0.44; 95% CI: 0.22–0.87; p = 0.019) or high (OR = 0.14; 95% CI: 0.03–0.61; p = 0.008) CRF categories was associated with a lower odd of low performance. In cognitive flexibility, children with high speed‐agility (OR = 0.33; 95% CI: 0.10–0.98; p = 0.050), high lower body strength (OR = 0.31; 95% CI: 0.10–0.98; p = 0.050), middle upper body strength (OR = 0.50; 95% CI: 0.25–0.93; p = 0.050), and balance (OR = 0.43; 95% CI: 0.20–0.90; p = 0.022) had reduced odds of low achievement. Any HRPF component predicted low achievement in working memory. The values of the OR (95% CI) are shown in the Table S3.
*Logistic regression models predicting low cognitive achievement controlling for sex, age, socioeconomic status, and screen time. CRF, Cardiorespiratory fitness. Low cognitive achievement was calculated as the lowest decile (p < 10).
Discussion
4
The results of this study showed that, even after adjusting for confounders, preschoolers with better HRPF—except lower body strength, had significantly better scores in cognition (numerical concepts, vocabulary, inhibition, and working memory). However, cognitive flexibility was only significantly associated with balance. Importantly, in addition to component‐specific analyses, we also examined a composite cognitive factor, which yielded consistent associations with health‐related physical fitness, supporting the robustness of the overall relationship between fitness and cognition beyond the differentiation of executive subcomponents. Furthermore, our findings revealed that higher levels of speed‐agility, upper body strength, CRF, and balance were associated with a lower risk of poor cognitive performance in numerical concepts, vocabulary, inhibition, and cognitive flexibility. No significant associations were found for working memory, suggesting that the relationship between HRPF and cognition may be selective depending on the cognitive domain assessed.
Beyond domain‐specific analyses, our structural equation modeling approach provides an integrated perspective on the relationship between HRPF and cognition in early childhood, congruent with previous studies [13, 40]. The strong association observed between the latent fitness and cognitive factors supports the notion that physical fitness is related not only to specific cognitive skills but also to a broader cognitive capacity underlying early learning and school readiness. This integrative finding complements the component‐level results and suggests that HRPF may act as a general correlate of cognitive development at this developmental stage. Beyond the component‐level analyses, the multigroup structural equation models provide an integrated view of the relationship between physical fitness and cognition in preschool children. Physical fitness was positively associated with global cognitive functioning in both boys and girls, with comparable effect sizes, supporting the notion that this relationship is largely independent of sex at this developmental stage, congruently with previous evidence [18, 36]. In contrast, age emerged as a relevant moderator, such that the association between physical fitness and cognition was stronger at younger ages and weakened with increasing age. Prior studies have found that age was the only predictor of cognition [18, 36]. This pattern may reflect developmental changes in both neural plasticity and the determinants of cognitive performance during the preschool years, suggesting that early preschool years may represent a sensitive period in which physical fitness is more closely linked to cognitive development [41], highlighting the potential value of early, developmentally timed fitness‐promoting interventions.
Our findings are consistent with prior research suggesting a positive relationship between HRPF and cognitive function in early childhood, especially with inhibition and working memory [13, 42] and mixed results with cognitive flexibility [16, 42]. In line with previous studies, we observed that higher CRF was linked to better inhibition and working memory [16, 43] and speed‐agility with inhibition [18]. CRF has been linked to enhanced cerebral blood flow and neurogenesis in brain areas involved in cognition [44] and speed‐agility, which involves rapid movement adaptation and coordination [45], has been associated with greater neural efficiency and increased P3 amplitude in event‐related potentials [46], suggesting a connection between complex motor skills and cognitive control [40]. The role of muscular fitness in cognitive outcomes remains less clear. While Nieto et al. found no associations with executive function [16], Zhou et al. reported a relationship between lower body strength and inhibition [18]. In contrast, our results highlighted upper body strength as being associated with inhibition, but not lower body strength. One proposed explanation involves the endocrine role of skeletal muscle, which secretes neurotrophic factors during contraction, potentially supporting brain health and cognition [47]. Nevertheless, in this study, the association between HRPF and working memory disappeared in a logistic regression model to predict low working memory achievement controlling for the confounders. Thus, inconsistencies across studies [16, 18, 48] highlight the need for further research considering confounding variables to clarify these relationships. However, these domain‐specific findings should be interpreted with caution, as executive functions in preschool‐aged children may not yet constitute clearly separable components but rather reflect partially overlapping or unitary control processes [24, 25]. Thus, observed differences across tasks may reflect task‐specific demands rather than fully distinct executive subsystems.
Our findings show associations between HRPF components and broader cognitive abilities, such as vocabulary and numerical concepts few explored in preschoolers. Although prior work in school‐aged children found no associations between HRPF domains and conceptual and verbal skills [49], to our knowledge, no previous studies have analyzed the association between HRPF and numerical comprehension. However, results in older children have found associations between HRPF components and mathematical performance [50, 51].
Furthermore, inhibition appears to be the most sensitive executive function domain to endurance and coordination training [18]. In contrast, the absence of consistent associations with cognitive flexibility aligns with prior findings and may reflect that cognitive flexibility emerges later in development and may not yet be fully established in preschool‐aged children [52]. Interestingly, only balance showed a significant association with cognitive flexibility in our study. This finding may be explained by the cognitive demands of postural control, which requires sensory integration, anticipatory planning, and the engagement of neural structures such as the cerebellum and prefrontal cortex [53, 54]. It is plausible that balance and cognitive flexibility follow similar developmental trajectories in early childhood, reflecting underlying neural integration processes. However, this result should be interpreted with caution due to the limited reliability of the one‐leg stance test in preschoolers [17].
Our logistic regression analyses revealed that higher fitness levels in speed‐agility, upper body strength, CRF, and balance were protective factors against low cognitive achievement—particularly in numerical and verbal domains, as well as inhibition. These findings reinforce the notion that HRPF may serve as a modifiable early marker of cognitive vulnerability in young children [55].
This study provides a comprehensive examination of the associations between multiple fitness and cognitive domains in a relatively large preschool sample using validated and developmentally appropriate measures. Importantly, we incorporated vocabulary and numerical concepts alongside executive functions, broadening the cognitive scope and relevance to school readiness. Second, our analytical approach accounted for multiple confounding variables including both correlational analyses and predictive modeling, offering practical insights into which specific fitness components may serve as early markers of cognitive vulnerability. Finally, the study provides evidence to a field where data remain inconsistent—preschool populations.
Nonetheless, several limitations should be noted. First, the cross‐sectional design precludes any causal inferences between HRPF and cognitive outcomes; longitudinal and intervention studies are needed to determine the directionality. Moreover, although key confounders were controlled for, other unmeasured variables may have influenced the observed relationships. Third, generalizability may be limited as participants were recruited from a specific geographic region in Spain. Fourth, difficulties in the measurement of executive function in preschoolers may not fully capture the complexity and variability of cognition. In this line, executive function in preschoolers is known to be weakly differentiated [24, 25], which may limit the interpretation of results at the component level. Fifth, the sample size was originally determined to detect intervention effects in the trial; therefore, the present analyses should be interpreted as associations within this recruited cohort rather than population‐representative estimates. No a priori sample size calculation was performed for these secondary association analyses; however, sensitivity analyses based on the achieved sample size (n = 522; α = 0.05, two‐sided) indicated adequate power to detect small effects, including correlations of |r| ≥ 0.122 and ANCOVA group effects of approximately partial ηp^2^ ≈ 0.02 (three categories, adjusted for age, sex, SES, and screen time). Finally, the one‐leg stance test has limited test–retest reliability in 3–5‐year‐old children [17]. Nevertheless, it was retained because static balance is a relevant neuromotor component, the task is commonly used in preschool motor competence batteries (e.g., MABC‐2), and it has been previously linked to cognitive performance [56]. Therefore, balance‐related findings should be considered exploratory and warrant confirmation using more reliable balance assessments in future studies.
The present findings indicate that HRPF may function both as a set of specific component‐level correlates and as a broader, integrated marker of cognitive development in early childhood. The consistent associations observed for cardiorespiratory fitness, speed‐agility, upper body strength, and balance, together with the strong latent‐level relationship between physical fitness and cognition, support the potential relevance of early fitness promotion for cognitive development and school readiness. The observed age‐related variation in these associations further suggests that intervention strategies may benefit from being developmentally sensitive rather than uniform across preschool populations. Our findings highlight the importance of HRPF from early childhood for enhancing cognitive development and reducing the risk of poor cognitive performance.
Perspective
5
This study adds novel evidence to the growing field linking physical fitness and cognitive development in early childhood. While previous research in school‐aged children has highlighted the importance of cardiorespiratory and muscular fitness for executive functions, evidence in preschoolers has remained scarce and inconsistent. Our findings extend this knowledge by analyzing different health‐related physical fitness components, cardiorespiratory fitness, speed‐agility, upper body strength, and balance as key components associated not only with the three most studied executive functions—inhibition, working memory, and cognitive flexibility, but also with broader cognitive domains including vocabulary and numerical reasoning—essential skills associated with academic achievement. In line with prior evidence, these results suggest that early promotion of health‐related physical fitness may serve as a modifiable marker of cognitive development. The potential impact of these findings lies in reinforcing preschool physical activity policies and programs that emphasize motor diverse physical activities and physical competence as foundations for learning. Future longitudinal and intervention studies should clarify causal pathways and determine whether improving specific fitness components can yield sustained cognitive benefits across childhood.
Author Contributions
Dr. María E. Visier‐Alfonso conceptualized the idea, carried out the statistical analyses, and drafted the initial manuscript. Dr. Mairena Sánchez‐López and Dr. Vicente Martínez‐Vizcaíno conceptualized and designed the study, designed the data collection instruments, and critically reviewed and revised the manuscript. Dr. Bruno Bizzozero‐Peroni, Dr. Ana Díez‐Fernández, and Dr. Abel Ruiz‐Hermosa coordinated and supervised data collection, collected data, and critically reviewed and revised the manuscript for important intellectual content. All authors approved the final manuscript as submitted and agree to be accountable for all aspects of the work.
Funding
This study was funded by the Spanish Ministry of Science, Innovation, and Universities (MICIN/AEI/10.13039/501100011033; ref.PID2019‐104160RB‐I00). The sponsor has no role in the research process. The sponsor has no role in the research process. BBP is supported by a grant from the Universidad de Castilla‐La Mancha co‐financed by the European Social Fund (2024‐UNIVERS‐12849).
Conflicts of Interest
The authors declare no conflicts of interest.
Supporting information
Figure S1: Factorial loads between physical fitness and cognition raw model. Note. Model fit indices: CFI = 0.971, TLI = 0.962, RMSEA = 0.047, 90% CI [0.031, 0.063], and SRMR = 0.038; χ^2^(34) = 68.86, p = 0.001 (N = 458). Values in bold indicate statistical significance at p ≤ 0.05.
Figure S2: Structural equation model testing the moderating effects of age and sex on the association between physical fitness and executive functions. Note: Model fit indices: CFI = 0.945, TLI = 0.923, RMSEA = 0.042, 90% CI [0.010, 0.042], and SRMR = 0.055. Chi‐squared χ^2^(257) = 361.03, p = 0.001 (N = 458). Values in bold indicate statistical significance at p ≤ 0.05. Dotted lines indicated non‐significant paths.
Table S1: Mean difference in cognition by physical fitness categories, controlling for confounders (sex, age, socioeconomic status, and screen time). Table S2: Main and Moderation Effects of Covariates on Executive Functions (Standardized Estimates). Table S3: Logistic regression models predicting risk of low cognitive achievement, without adjustment and controlling for confounders (age, sex, socioeconomic status, and screen time).
The reference list from the paper itself. Each links out to its DOI / PubMed record.
- 1A. Diamond , “Chapter 19 ‐ Executive Functions,” in Neurocognitive Development: Normative Development. Handbook of Clinical Neurology, ed. A. Gallagher , C. Bulteau , D. Cohen , and J. L. Michaud (Elsevier, 2020), 225–240.
- 2M. M. Black , S. P. Walker , L. C. H. Fernald , et al., “Early Childhood Development Coming of Age: Science Through the Life Course,” Lancet 389 (2017): 77–90.27717614 10.1016/S 0140-6736(16)31389-7PMC 5884058 · doi ↗ · pubmed ↗
- 3A. Shokrkon and E. Nicoladis , “The Directionality of the Relationship Between Executive Functions and Language Skills: A Literature Review,” Frontiers in Psychology 13 (2022): 848696.35928417 10.3389/fpsyg.2022.848696 PMC 9343615 · doi ↗ · pubmed ↗
- 4T. K. Turesky , E. S. Escalante , M. Loh , and N. Gaab , “Longitudinal Trajectories of Brain Development From Infancy to School Age and Their Relationship With Literacy Development,” Proceedings of the National Academy of Sciences of the United States of America 122 (2025): e 2414598122.40493188 10.1073/pnas.2414598122 PMC 12184337 · doi ↗ · pubmed ↗
- 5B. Daelmans , G. L. Darmstadt , J. Lombardi , et al., “Early Childhood Development: The Foundation of Sustainable Development,” Lancet 389 (2017): 9–11.27717607 10.1016/S 0140-6736(16)31659-2 · doi ↗ · pubmed ↗
- 6F. B. Ortega , C. Cadenas‐Sánchez , G. Sánchez‐Delgado , et al., “Systematic Review and Proposal of a Field‐Based Physical Fitness‐Test Battery in Preschool Children: The PREFIT Battery,” Sports Medicine 45 (2015): 533–555.25370201 10.1007/s 40279-014-0281-8 · doi ↗ · pubmed ↗
- 7J. E. Donnelly , C. H. Hillman , D. Castelli , et al., “Physical Activity, Fitness, Cognitive Function, and Academic Achievement in Children: A Systematic Review,” Medicine and Science in Sports and Exercise 48 (2016): 1197–1222.27182986 10.1249/MSS.0000000000000901 PMC 4874515 · doi ↗ · pubmed ↗
- 8T. Fühner , R. Kliegl , F. Arntz , S. Kriemler , and U. Granacher , “An Update on Secular Trends in Physical Fitness of Children and Adolescents From 1972 to 2015: A Systematic Review,” Sports Medicine 51 (2021): 303–320.33159655 10.1007/s 40279-020-01373-x PMC 7846517 · doi ↗ · pubmed ↗