Dopamine neuron specific RNA-sequencing reveals Neprilysin 1 acts downstream of the cohesin complex to suppress learning
Illia Pimenov, Courtney M. MacMullen, Chisom Ezeh, Amoolya Sai Dwijesha, Justine David, Akhila Eswaran, Ronald L. Davis, Anna Phan

TL;DR
A study in fruit flies finds that a protein called Neprilysin 1, regulated by a cohesin complex, limits learning by controlling dopamine neuron activity.
Contribution
The study identifies Neprilysin 1 as a downstream effector of the cohesin complex subunit Stromalin in regulating learning.
Findings
Neprilysin 1 is positively regulated by the cohesin complex and acts downstream of Stromalin.
Knocking down Neprilysin 1 enhances learning and increases synaptic vesicle markers in dopamine neurons.
Neprilysin 1 overexpression rescues memory and synaptic phenotypes caused by Stromalin reduction.
Abstract
We previously identified Stromalin, a cohesin complex subunit, as a learning suppressor in Drosophila melanogaster that acts by limiting synaptic vesicle numbers in dopamine neurons. However, the mechanism by which Stromalin modulates synaptic vesicles remains unclear. We hypothesized that this occurred through the cohesin complex’s function in developmental gene regulation. Through dopamine neuron-specific RNA-sequencing followed by RNAi screening, we identified Neprilysin 1 (Nep1), a zinc-dependent metallopeptidase, to be positively regulated by the cohesin complex and a key downstream effector of Stromalin. Nep1 knockdown phenocopies Stromalin knockdown effects, enhancing learning and memory and increasing synaptic vesicle markers in dopamine neurons. Like Stromalin, Nep1 suppresses synaptic strength between dopamine and mushroom body neurons. Finally, we show Nep1 overexpression…
Genes, proteins, chemicals, diseases, species, mutations and cell lines named across the full text — each resolved to its canonical identifier and authoritative record.
Click any figure to enlarge with its caption.
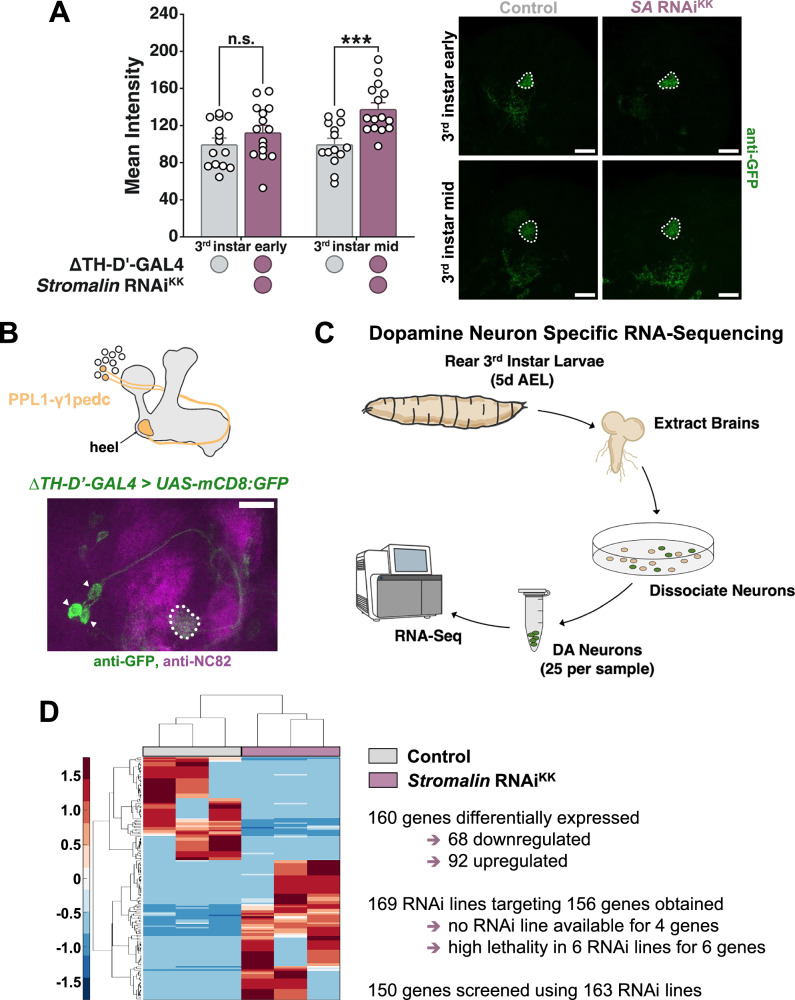 Figure 1
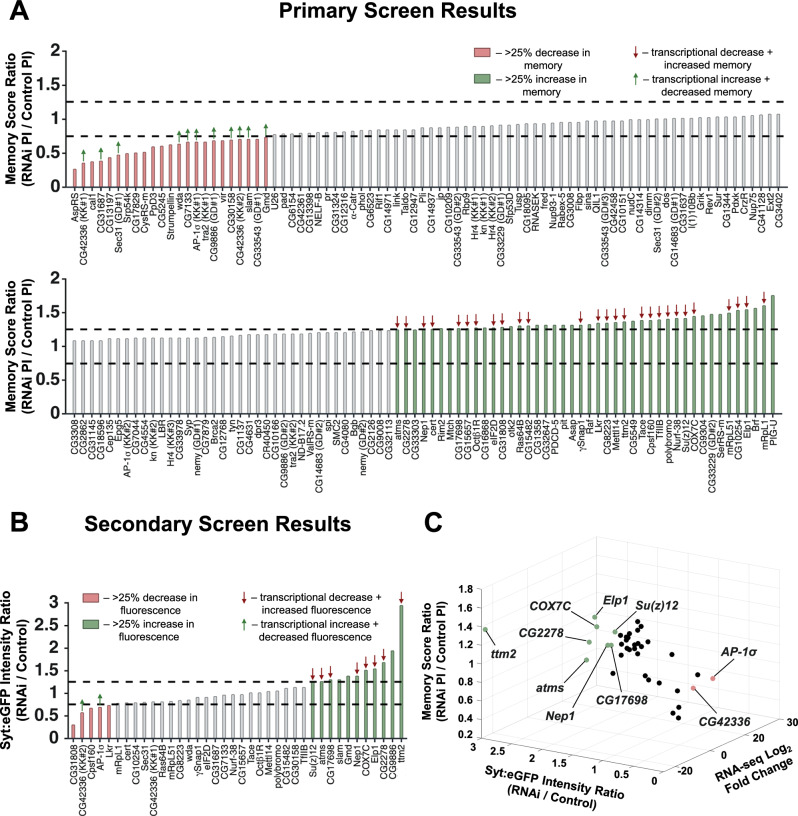 Figure 2
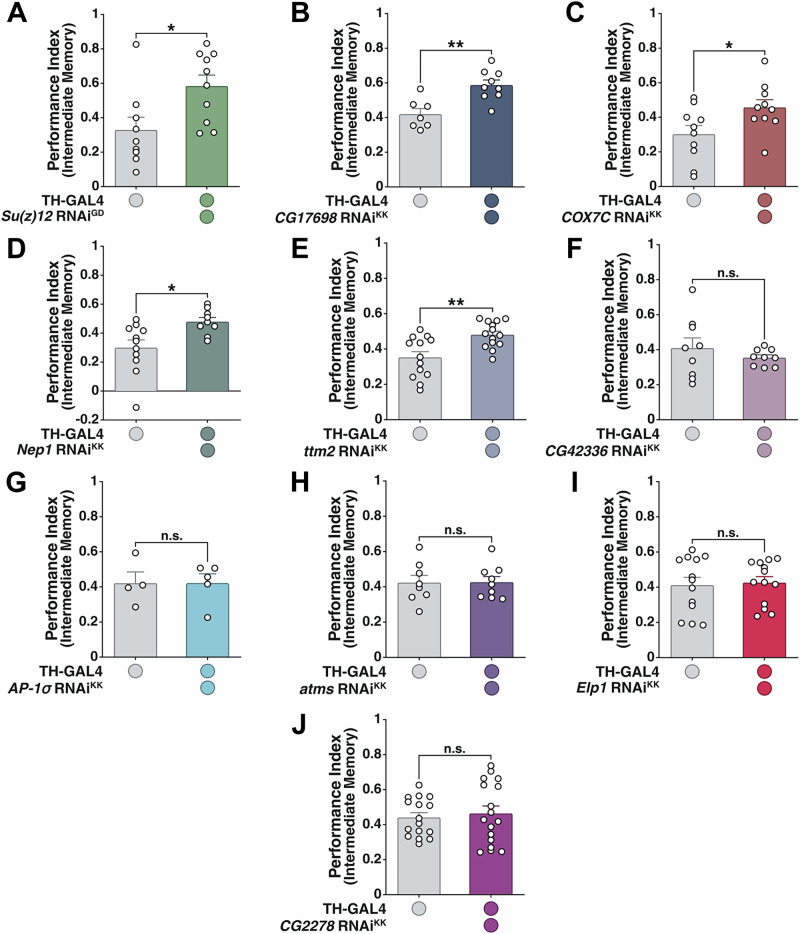 Figure 3
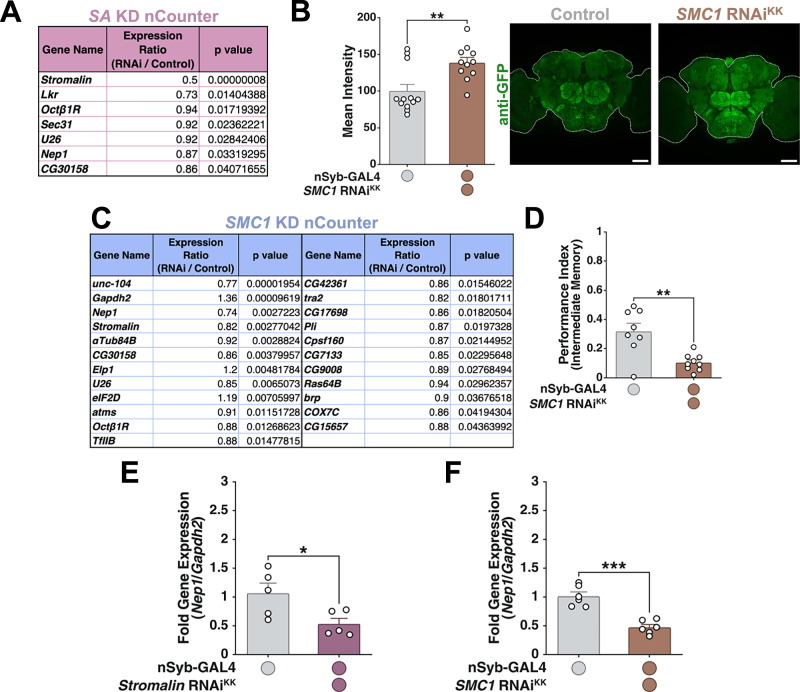 Figure 4
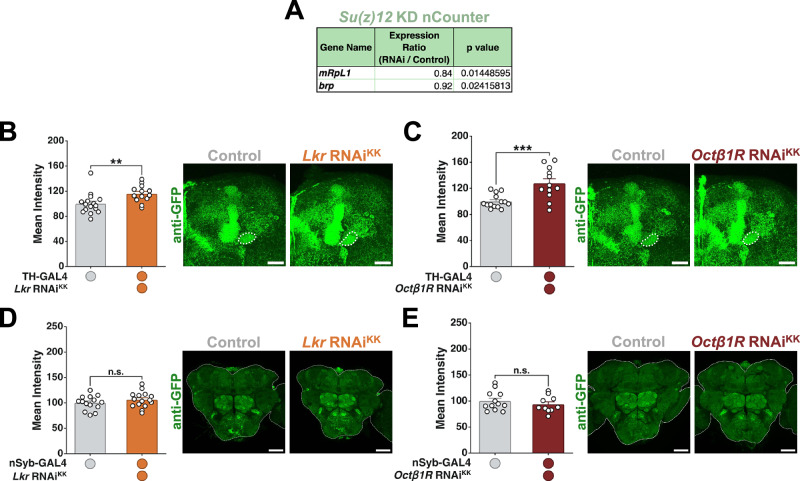 Figure 5
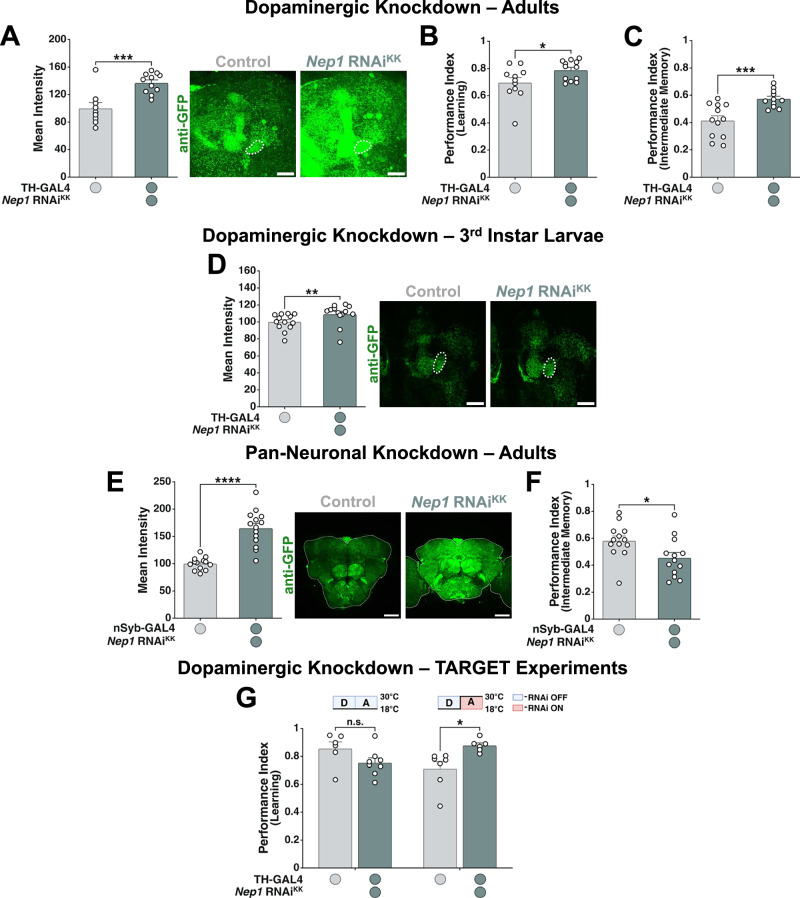 Figure 6
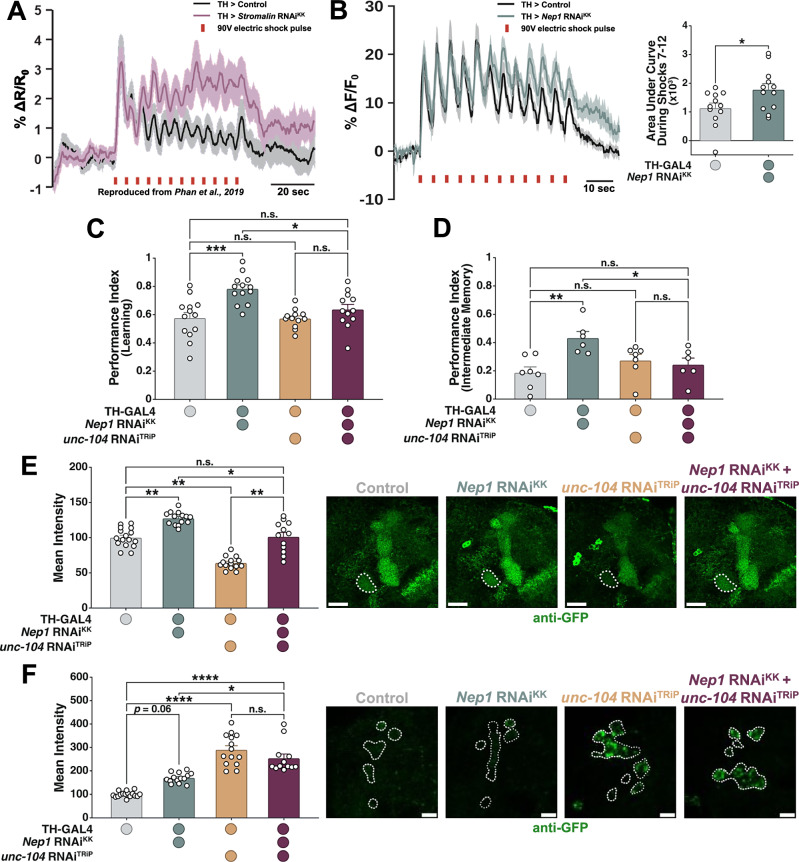 Figure 7
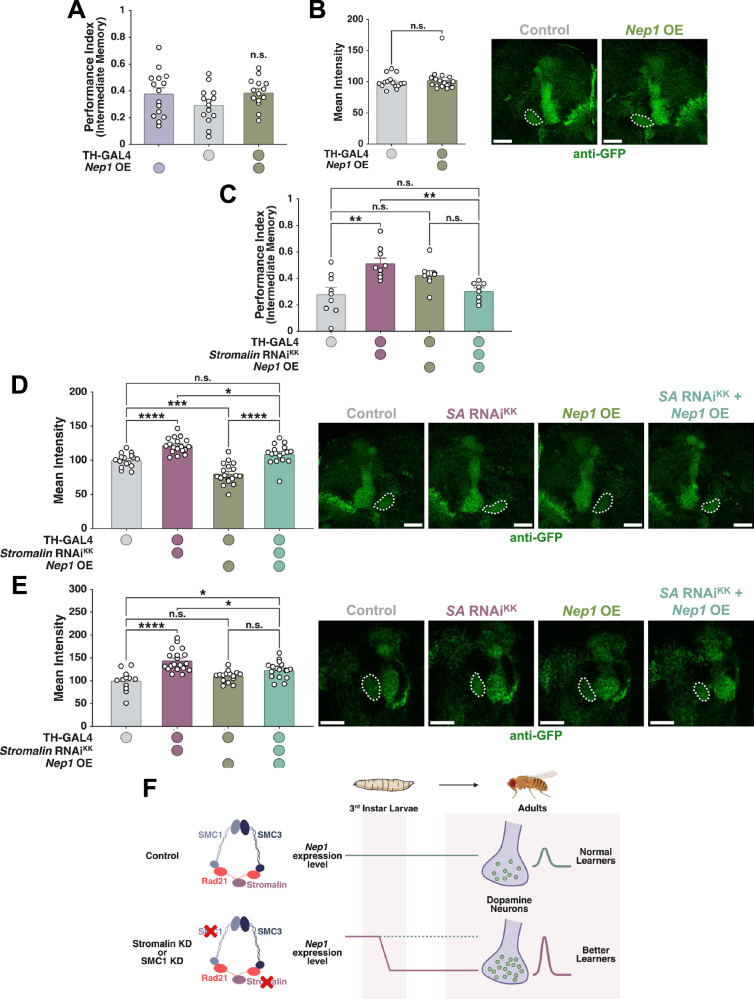 Figure 8
- —https://doi.org/10.13039/501100000038Gouvernement du Canada | Natural Sciences and Engineering Research Council of Canada (Conseil de Recherches en Sciences Naturelles et en Génie du Canada)
- —https://doi.org/10.13039/100000002U.S. Department of Health & Human Services | National Institutes of Health (NIH)
Peer Reviews
No public reviews on file for this paper yet. If you reviewed it on a platform where reviews are public (OpenReview, ICLR, NeurIPS, ICML), you can paste yours below so the community can read it here.
Videos
No videos yet. Explain this paper in a talk, walkthrough, or lecture? Add one.
Taxonomy
TopicsNeurobiology and Insect Physiology Research · Cellular transport and secretion · Developmental Biology and Gene Regulation
Introduction
Neurobiological and neurocircuit mechanisms supporting learning and memory are exquisitely complicated and tightly controlled. The function of “memory suppressor genes” that act to suppress some aspect of the learning and memory process is one way in which the nervous system exerts this control^1–3^. Thus, removing or reducing the functions of these genes leads to memory enhancements. Memory suppressors have roles during memory encoding, maintenance, and forgetting^2,3^. Although nearly 100 memory suppressor genes have been identified, only a small proportion of these have been studied in depth to reveal how they act to limit learning and/or memory processes^2,3^, significantly adding to our fundamental understanding of memory encoding and storage. For examples, studying the memory suppressors Rac1, a Rho family GTPase, and Scribble, a scaffolding protein connecting Rac1 with downstream signaling molecules, revealed they function downstream of dopamine receptor signaling to promote forgetting^4–7^. Another memory suppressor, choline/acetylcholine transporter SLC22A, was shown to limit acquisition by reducing neurotransmitter signaling^8^. Currently, most memory suppressors identified that act on acquisition appear to function by limiting neuronal excitability or neurotransmitter signaling^2,3^.
We previously identified a novel memory suppressor gene called Stromalin in Drosophila (homologous to mammalian Stromalin 1 and Stromalin 2), revealing that it acts to limit learning by constraining the number of synaptic vesicles in the dopamine neurons (DANs) required for aversive olfactory memory^9^. This is a highly unusual mechanism, compared with other known memory suppressors^2,3,5,8^. Using serial section electron microscopy and 3D reconstruction, we identified the sizes and morphology of synaptic vesicles (and dense core vesicles) are normal, but there is a 2-fold increase in the numbers of synaptic vesicles when Stromalin is knocked down in DANs (controls = 101 synaptic vesicles/μm^3^ neuropil, Stromalin KD = 239 synaptic vesicles/μm^3^ neuropil), and a similar doubling was also seen in dense core vesicles (controls = 46 vesicles/μm^3^ neuropil, Stromalin KD = 104 vesicles/μm^3^ neuropil)^9^. This resulted in increased dopamine neurotransmitter release and enhanced learning^9^. Moreover, reducing Stromalin levels does not change the number and size of synaptic boutons^9^. Little is known about how neurons regulate the numbers of synaptic vesicles that are produced, or the cellular mechanisms leading to their biogenesis in the cell body, in stark contrast to our understanding of synaptic vesicle recycling at synaptic terminals, which is far more advanced^10–12^. Thus, we pursued this effect of Stromalin to reveal more about how synaptic vesicle biogenesis occurs and is regulated.
Stromalin, together with SMC1, SMC3, and Rad21, are subunits forming the cohesin complex, canonically known for their role in maintaining sister chromatid cohesion during cell division^13^. However, they also have important roles in regulating gene transcription in cells, including in postmitotic cells^14–20^. The cohesin complex regulates gene transcription through a variety of mechanisms, including through altering three-dimensional DNA architecture, interacting with CCCTC-binding factor (CTCF), Polycomb group protein complexes, or transcription factors^14,15,18,21–23^. Heterozygous mutations in cohesin complex genes, or those of its regulators, result in rare developmental disorders known as cohesinopathies that affect multiple systems, including the nervous system, resulting in cognitive and intellectual disabilities^18,24–27^. The most well-known of these are Cornelia de Lange syndrome and Roberts syndrome^28,29^. Human, mouse, and Drosophila cells with such heterozygous mutations generally do not exhibit defects in sister chromatid cohesion^19,30,31^, leading to the speculation that the symptomatic effects of cohesinopathies may result from impairments in gene transcription, rather than defects in chromatid cohesion^14,32,33^. If cohesinopathy symptoms were primarily the result of one or a few dysregulated genes that could be manipulated at later developmental timepoints to attenuate symptoms, then identifying these genes could reveal possible treatment targets even after very early transcriptional programs have been altered.
We hypothesize that Stromalin constrains synaptic vesicle numbers and suppresses learning via transcriptional mechanisms. This is supported by the fact that Stromalin knockdown (KD) in postmitotic DANs led to learning enhancements in adult animals and our manipulation did not affect the numbers of DANs^9^. Moreover, these effects of Stromalin are likely the result of impairing cohesin complex function, rather than a cohesin-independent effect of Stromalin^34^, as SMC1 KD in DANs also enhanced memory performance, similar to Stromalin^9^. Thus, we used cell -specific RNA-sequencing (RNA-seq) to identify the transcriptional differences in 3^rd^ instar DANs when Stromalin was knocked down. We then used an RNAi screening strategy to silence differentially expressed genes (DEGs) in DANs to identify which of the transcriptional changes caused learning and synaptic vesicle changes. From these efforts, we identified reduced expression levels of a zinc-dependent metallopeptidase, Neprilysin 1 (Nep1), as the likely regulator of synaptic vesicle numbers in DANs that acts downstream of the cohesin complex. Moreover, reducing Nep1 expression only in adult flies causes the learning phenotypes. This suggests that even after developmental transcriptional programs have been set by the cohesin complex, manipulating Nep1 levels or function may be able to attenuate some cohesinopathy symptoms.
Results
Dopamine neuron specific RNA-sequencing
Previously, we demonstrated Stromalin functions developmentally to restrict synaptic vesicle (SV) pool sizes, leading to limitations on adult learning^9^. Increases in SV numbers can be observed via increases in the SV marker Synaptotagmin:eGFP (Syt:eGFP) at the synaptic terminals, even when Syt:eGFP is overexpressed (using UAS-Syt:eGFP)^9^. Following Stromalin RNAi expression in DANs using the tyrosine hydroxylase driver line TH-GAL4, Syt:eGFP increases emerge at 5 days after egg laying (AEL; corresponding to the middle of the 3^rd^ instar period), before persisting into adulthood, enhancing cognition^9^. Here, we replicated these Syt:eGFP results using the more restrictive dopaminergic GAL4 driver, ΔTH-D’-GAL4 (Fig. 1A). While in adult brains the ΔTH-D’-GAL4 expresses in all PPL1 DANs that innervate the mushroom body (MB), during the 3^rd^ instar larval stage ΔTH-D’-GAL4 only expresses in the 2-3 DANs innervating the γ1pedc MB region, known as PPL1-γ1pedc (Fig. 1A)^9^. We chose this driver because we wanted to restrict the heterogeneity of cells for DAN-specific RNA-seq as much as possible, and Stromalin KD in the PPL1-γ1pedc is sufficient to enhance learning in adult flies^9^. Additionally, ΔTH-D’-GAL4 does not strongly express the fluorescent membrane marker mCD8:GFP in any other neurons in the 3^rd^ instar central brain (unlike the TH-GAL4 driver, which expresses in non-PPL1 dopamine neurons), thus enabling the collection of PPL1-γ1pedc cell bodies for RNA-seq (Fig. 1B). We dissected larval brains from 3^rd^ instar larvae at 5 days AEL, the first time point at which we observe increased Syt:eGFP levels (Fig. 1A). Brains were dissociated and 25 GFP^+^ cell bodies were manually picked per RNA-seq sample (n = 3/genotype). RNA was isolated from these cells and subjected to RNA-seq to identify DAN-specific DEGs at the critical time window when SV numbers were increasing in Stromalin KD DANs (Fig. 1C). DESeq2 analysis revealed 160 significant DEGs (adjusted p-value; Fig. 1D, Supplementary Data 1). Log_2_ fold change values in general were higher than typical, which is most likely due to the low input RNA levels of our samples. A GO analysis conducted on the 160 significantly dysregulated genes revealed no enriched terms, which may be the result of ‘noise’ due to our low-input RNA samples or our highly restricted sample (dopamine neurons).Fig. 1. Dopamine neuron specific RNA-sequencing identifies genes dysregulated by Stromalin RNAi.A Stromalin (SA) KD in PPL1-γ1pedc dopaminergic neurons (using ∆TH-D’-GAL4 driver) increases the synaptic vesicle marker Syt:eGFP in the mushroom body heel starting at the middle of the 3^rd^ instar larval stage (3^rd^ instar mid, 5 d AEL). No significant differences were seen at 4 d AEL (3^rd^ instar early). Student’s t test, ***p < 0.001 (n = 14,15). All data points were normalized to the control group average (in %). B The expression pattern of ∆TH-D’-GAL4 driver in the 3^rd^ instar larval brain using a membrane marker UAS-mCD8:GFP. White arrowheads indicate cell bodies of the PPL1 subset of dopaminergic neurons. C GFP-positive PPL1-γ1pedc dopaminergic neurons (25 neurons per sample) were manually collected from 5 d AEL 3^rd^ instar larvae of control and SA KD conditions. Larval brains were dissected, their neurons were dissociated, and then the neurons were processed for RNA-sequencing. D Clustering and heatmap of significantly differentially expressed genes identified from our RNA-sequencing experiment (log_2_ of normalized gene counts). Relative expression changes are indicated by the color scale (red: high; blue: low). All graphs depict mean + SEM. White dotted lines on micrographs outline the mushroom body heel. Scale bar: 20 µm.
Memory and synaptic vesicle marker screening of differentially expressed genes
To identify which of the DEGs in our DAN-specific RNA-seq dataset might be responsible for Stromalin’s effects on memory and SVs, we targeted the DEGs using Drosophila RNAi lines and screened them for memory and synaptic protein effects consistent with those of Stromalin. We obtained 169 inducible RNAi lines against 156 of the 160 DEGs (2 or 3 RNAi lines were available from one RNAi library for some genes). RNAi lines against 4 genes were not available and thus were not tested: CR44474, CG6511, Hsc20, and l(3)psg2. The RNAi lines were expressed in DANs using TH-GAL4 (combined with UAS-dicer2). While we utilized the ΔTH-D’-GAL4 driver line to identify PPL1-γ1pedc cell bodies during the 3^rd^ instar larval period, the TH-GAL4 driver was used for subsequent experiments (unless otherwise stated), since our previous work with Stromalin KD revealed stronger phenotypic effects when using TH-GAL4 than with ΔTH-D’-GAL4^9^. Six RNAi lines targeting 6 genes (Bap55, Pop2, ftz-f1, CG8034, Rpt1, and CG3529) resulted in high embryonic, larval, or pupal lethality, and therefore were not tested in our screens. Thus, 163 RNAi lines targeting 150 genes were tested in a primary memory screen (n = 3/RNAi line, control genotypes included at regular intervals throughout).
Primary memory screen
We used liberal criteria for screening to reduce false negatives, reasoning that false positives would easily be detected and eliminated in downstream validation experiments as previously done for a large Drosophila RNAi memory screen^35^. The primary memory screen was conducted using an aversive olfactory conditioning assay. Associative memory is tested by pairing one naïve odor with an electric shock while a second naïve odor is not, after which the flies are given a choice test between these two odors in a T-maze. Learning and memory manifest in flies’ avoidance of the shock-associated odor that is quantified as a performance index (PI), with higher PI scores indicating better memory. RNAi lines that produced memory scores (RNAi PI score/average control PI across screen) corresponding to greater than ± 25% change were considered as potentially producing a memory effect, similar to memory screen criteria used previously^35^. From this primary screen, RNAi lines against 10 low and 27 high memory score genes were consistent with the transcriptional and behavioral effects of Stromalin KD. Specifically, they displayed either a statistically significant transcriptional increase (positive log_2_FC value from our RNA-seq dataset) along with a low memory score, or a statistically significant transcriptional decrease (negative log_2_FC value from our RNA-seq dataset) along with a high memory score (Fig. 2A and Supplementary Data 2). These 37 genes were tested in a secondary DAN synaptic protein screen, and their mRNA levels were also tested in control and Stromalin KD brains using the nCounter system from Nanostring (details below).Fig. 2RNAi screens of differentially expressed genes identify gene candidates acting downstream of *Stromalin.*A Primary aversive olfactory memory screen results. The bars indicate the intermediate (3 hr) memory score ratios (RNAi PI/Control PI). RNAis were expressed in the dopaminergic neurons using the TH-GAL4 driver. Red and green bars represent RNAi lines with a > 25% decrease or a > 25% increase in memory scores (relative to control), respectively. Of the RNAi lines that produced effects >±25%, green arrows indicate statistically significantly upregulated genes in SA KD cells, and red arrows show statistically significantly downregulated genes in SA KD cells from our RNA-sequencing dataset. Black dashed lines denote the thresholds at ±25% of control PI score. B Secondary synaptic vesicle marker (UAS-Syt:eGFP) screen results. The bars represent Syt:eGFP fluorescence intensity ratios (RNAi/Control). 38 RNAi lines were tested using TH-GAL4. Red and green bars represent RNAi lines with a > 25% decrease or a > 25% increase in fluorescence intensity (relative to control), respectively. Of the RNAi lines that produced effects >±25%, green arrows indicate statistically significantly upregulated genes in our SA KD cells, and red arrows show statistically significantly downregulated genes in our SA KD cells from our RNA-sequencing dataset. Black dashed lines denote the thresholds at ±25% of control Syt:eGFP intensity. C A 3D scatter plot of the 37 genes that passed the primary screen plotted along axes representing RNA-seq Log_2_ Fold Change (RNA-seq data), memory score ratio (primary screen results), and Syt:eGFP intensity ratio (secondary screen results). Ten genes that passed the secondary screen are indicated on the plot.
Secondary synaptic vesicle marker screen
We screened for the effects of knocking down 37 genes on Syt:eGFP levels in DANs (6 brains/RNAi line). We measured fluorescence levels in the γ1pedc region of the MB and considered RNAi lines with fluorescence intensity changes (RNAi fluorescence/control fluorescence) greater than ±25% to potentially produce an SV effect. Of the 10 low memory scoring genes, RNAi lines against 2 genes (CG42336, AP-1σ) produced a decrease in Syt:eGFP. Of the 27 high memory scoring genes tested, RNAi lines against 8 genes (atms, Elp1, CG2278, Su(z)12, CG17698, COX7C, Nep1, ttm2) produced the expected increase in Syt:eGFP levels consistent with Stromalin’s effects (Fig. 2B and Supplementary Data 2). Thus, from our secondary screen, we identified 10 gene candidates that potentially acted downstream of Stromalin and the cohesin complex to regulate SV numbers (Fig. 2C).
Retesting screen results
We then attempted to replicate both the behavioral and Syt:eGFP screening results as the first step to eliminate false positives and to validate our gene candidates. Five RNAi lines replicated both their high memory and high SV marker phenotypes seen previously: Su(z)12, CG17698, COX7C, Nep1, ttm2 (Fig. 3A-J, Supplementary Fig. 1A-1K, and Supplementary Data 2). The other 5 gene candidates failed to replicate either one or both of their memory and Syt:eGFP changes from the screens.Fig. 3. Validation of the primary behavioral RNAi screen results reveals five primary candidates potentially acting downstream of *Stromalin.*A Su(z)12 KD in DANs resulted in significantly higher intermediate memory (3 hr) scores. Student’s t test, *p < 0.05 (n = 9,10). B CG17698 KD in DANs enhanced flies’ intermediate memory retention scores. Student’s t test, **p < 0.01 (n = 7,9). C COX7C KD in DANs improved flies’ intermediate memory. Student’s t test, *p < 0.05 (n = 10). D Nep1 KD in DANs resulted in significantly increased intermediate memory scores. Student’s t test, *p < 0.05 (n = 11,9). E ttm2 KD in DANs resulted in significantly higher intermediate memory scores. Student’s t test, **p < 0.01 (n = 13,14). F CG42336 KD in DANs did not change 3 hr memory scores. Student’s t test (n = 9). G AP-1σ KD in DANs did not alter intermediate memory scores. Student’s t test (n = 4,5). H atms KD in DANs did not alter intermediate memory retention. Student’s t test (n = 8,9). I Elp1 KD in DANs did not affect intermediate memory. Student’s t test (n = 13). J CG2278 KD in DANs did not affect intermediate memory performance. Student’s t test (n = 16,17). All graphs depict mean + SEM.
Verifying transcriptional results from RNA-sequencing
The results of DAN-specific RNA-seq are difficult to verify due to the very low amounts of RNA recovered from a limited number of DANs. To address this, we used an alternative approach to verify transcriptional differences in our gene candidates. Given that Stromalin KD in all neurons enhanced learning and increased Syt:eGFP levels across the whole brain^9^, we reasoned that Stromalin likely constrained SVs in a variety of neurons, with effects extending beyond the DANs themselves. Additionally, we reasoned that transcriptional changes occurring during the 3^rd^ instar larval stage likely persist into adult brains, resulting in the adult learning and Syt:eGFP phenotypes. We expressed Stromalin RNAi in all neurons (using nSyb-GAL4), extracted RNA from adult whole brains, and then used Nanostring’s nCounter system to simultaneously measure mRNA levels of the 37 genes that passed the primary memory screen (Supplementary Data 3). The nCounter system allows for the direct quantification of mRNA without amplification and the resulting reads were quantified, normalized, and differential expression data statistically analyzed using Nanostring’s nSolver program. Our nCounter results confirmed that Stromalin mRNA levels were reduced by 50% compared to control brains (Fig. 4A), consistent with the ~50% Stromalin protein reduction previously reported using this same RNAi line^9^. Significant reductions in mRNA levels for 3 genes, LkR, Octβ1R, and Nep1 (Fig. 4A), were consistent with our DAN-specific RNA-seq effects. Of these, Nep1 was the only gene that also passed our RNAi screening experiments.Fig. 4. Cohesin complex subunit SMC1 knockdown phenocopies Stromalin’s effects.A List of genes having significantly different mRNA levels upon pan-neuronal SA KD compared to controls, measured using NanoString nCounter (n = 3). Expression was normalized to housekeeping genes αTub84B, Gapdh2, and to internal housekeeping genes Act5C, brp, dcr2, unc-104 (highly expressed and unchanged in our RNA-sequencing data). Lkr, Octβ1R, Nep1 replicated the downregulation seen in our RNA-seq experiment. Expression ratio indicates the ratio of RNAi group’s average normalized reads to control group’s average normalized reads. NanoString nSolver software was used for data analysis. B Pan-neuronal SMC1 KD increases Syt:eGFP levels in the whole brain of adult female flies. Mann-Whitney U test, **p < 0.01 (n = 12,11). All data points were normalized to the control group average (in %). C Significantly differentially expressed genes in adult brains with pan-neuronal SMC1 reduction compared to controls, quantified using NanoString nCounter. Analysis was done in the same way as for SA KD nCounter (see Fig. 4A). D Pan-neuronal SMC1 KD impairs intermediate memory retention scores. Student’s t test, **p < 0.01 (n = 8,9). E RT-qPCR demonstrates Nep1 expression is reduced when SA is knocked down in the whole adult brain, replicating NanoString nCounter results. Student’s t test, *p < 0.05 (n = 5). Gapdh2 was used as a housekeeping gene. Fold gene expression is shown as a \documentclass[12pt]{minimal} \usepackage{amsmath} \usepackage{wasysym} \usepackage{amsfonts} \usepackage{amssymb} \usepackage{amsbsy} \usepackage{mathrsfs} \usepackage{upgreek} \setlength{\oddsidemargin}{-69pt} \begin{document}$$2^{\mbox{-}(\Delta \Delta C_{T})}$$\end{document} value. F RT-qPCR shows Nep1 expression is also reduced when SMC1 is knocked down pan-neuronally in adult brains, replicating NanoString nCounter results. Student’s t test, ***p < 0.001 (n = 6). Gapdh2 was used as a housekeeping gene. Fold gene expression is shown as a \documentclass[12pt]{minimal} \usepackage{amsmath} \usepackage{wasysym} \usepackage{amsfonts} \usepackage{amssymb} \usepackage{amsbsy} \usepackage{mathrsfs} \usepackage{upgreek} \setlength{\oddsidemargin}{-69pt} \begin{document}$$2^{\mbox{-}(\Delta \Delta C_{T})}$$\end{document} value. All graphs depict mean + SEM. White dotted lines on micrographs outline the whole brain. Scale bar: 50 µm.
Knockdown of the cohesin complex subunit SMC1 in DANs also resulted in enhanced memory^9^. Similar to Stromalin, we found that SMC1 KD increases Syt:eGFP levels across the entire adult brain (Fig. 4B). Therefore, we also tested whether whole brain SMC1 KD affected the expression of the same genes as those affected by whole-brain Stromalin KD. Results for 11 genes replicated the DAN-specific RNA-seq data and the direction of the transcriptional effect: Octβ1R, CG17698, COX7C, Nep1, atms, TfIIB, tra2, Cpsf160, CG9008, Ras64B, CG15657 (Fig. 4C and Supplementary Data 4). Of these genes that are transcriptionally dysregulated by SMC1 KD, CG17698, COX7C, and Nep1 had also passed our screening experiments. Importantly, Nep1 expression is reduced upon both Stromalin and SMC1 KD. Interestingly, we observed greater transcriptional changes in SMC1 KD brains compared to Stromalin KD brains. This finding is consistent with reports in human patients, where SMC1 mutations appear to cause more severe symptoms than mutations in Stromalin 1 or Stromalin 2^36–40^. Because Nep1 showed reduced expression in both our Stromalin and SMC1 KD nCounter experiments, we further verified these Nep1 expression decreases occurred upon Stromalin and SMC1 KD using RT-qPCR (Fig. 4E, F).
Eliminating gene candidates as mediators of Stromalin’s effects on neurons
The cohesin complex regulates transcription through a variety of mechanisms, one of which is through interacting with Polycomb repressive complexes^23,41,42^. One gene that passed our screening efforts (but failed to replicate its transcriptional downregulation in Stromalin KD brains) was Su(z)12, a Polycomb repressive complex 2 (PRC2) subunit that regulates transcription. We revisited the possibility that Su(z)12 might interact with the cohesin complex to regulate SV numbers by determining if Su(z)12 KD brains could replicate any transcriptional effects seen in Stromalin or SMC1 KD brains. nCounter analysis revealed that whole brain KD of Su(z)12 significantly dysregulated mRpL1 and brp (Fig. 5A and Supplementary Data 5). Neither of these genes was identified as a candidate from our RNAi screening efforts, nor are they consistent with our Stromalin or SMC1 KD nCounter mRNA data (Fig. 4A, B, Supplementary Data 3, and Supplementary Data 4). Thus, we eliminated Su(z)12 as a potential mediator of Stromalin’s effects on learning and SVs, suggesting the cohesin complex regulates transcription through non-PRC2 mechanisms to regulate synaptic vesicle numbers.Fig. 5Su(z)12, Lkr, and Octβ1R are unlikely to mediate the effects of Stromalin knockdown.A Significantly differentially expressed genes in adult brains with pan-neuronal Su(z)12 reduction when compared to controls, quantified using NanoString nCounter. Analysis was done in the same way as for SA KD nCounter (see Fig. 4A). B Lkr KD in DANs resulted in a significant increase in Syt:eGFP levels in the PPL1-γ1pedc of adult female flies. Mann-Whitney U test, **p < 0.01 (n = 16,13). All data points were normalized to the control group average (in %). C Octβ1R KD in DANs resulted in a significant increase in Syt:eGFP levels in the PPL1-γ1pedc of adult female flies. Student’s t test, ***p < 0.001 (n = 14,12). All data points were normalized to the control group average (in %). D Pan-neuronal Lkr KD did not affect Syt:eGFP levels in the whole brain of adult female flies. Student’s t test (n = 14,15). All data points were normalized to the control group average (in %). E Pan-neuronal Octβ1R KD did not affect Syt:eGFP levels in the whole brain of adult female flies. Student’s t test (n = 12,10). All data points were normalized to the control group average (in %). All graphs depict mean + SEM. White dotted lines on micrographs outline the mushroom body heel (B, C) or whole brain (D, E). Scale bar: 20 µm (B, C) or 50 µm (D, E).
Because Lkr and Octβ1R mRNA levels were significantly reduced upon Stromalin and/or SMC1 KD (Fig. 4A, C), and they passed the primary memory screen, we revisited the possibility that they were false negatives in the secondary screen. Both Lkr and Octβ1R KD in DANs increased Syt:eGFP fluorescence in the PPL1-γ1pedc (Fig. 5B, C), phenocopying Stromalin’s effects^9^. However, when Lkr and Octβ1R RNAi lines were expressed pan-neuronally, no changes in Syt:eGFP levels were observed (Fig. 5D, E), whereas pan-neuronal Stromalin KD increased Syt:eGFP^9^. Therefore, neither Lkr nor Octβ1R decreases could fully replicate Stromalin’s effects.
The only gene that passed our screening efforts and whose mRNA levels were significantly reduced in both Stromalin and SMC1 KD adult brains was Neprilysin 1 (Nep1).
Nep1 phenocopies Stromalin’s effects
Nep1 expression appears to be positively regulated by the cohesin complex in the brain, as KD of both Stromalin and SMC1 reduce Nep1 mRNA levels in the whole brain (Fig. 4A, C, E, F). Thus, we further investigated Nep1 to assess how well it phenocopies the effects of Stromalin KD observed previously. Reducing Nep1 in DANs increased Syt:eGFP levels in adult brains (Fig. 6A), and enhanced learning and intermediate memory (Fig. 6B, C), all of which are consistent with the effects of Stromalin KD in the brain^9^. Additionally, we observed that the Nep1 RNAi-induced increase in SV marker levels was also present in the DANs of late 3^rd^ instar larvae (PPL1-γ1pedc; Fig. 6D), similar to what was found with Stromalin KD^9^. These findings were also replicated using a second independent RNAi line targeting Nep1 (Supplementary Fig. 2A-2D). When Nep1 is reduced in the whole brain, we observed an increase in synaptic protein levels in adult fly brains, similar to the increase observed in Stromalin KD brains (Fig. 6E). In contrast to our pan-neuronal Stromalin KD findings, pan-neuronal KD of Nep1 resulted in a decrease in intermediate memory (Fig. 6F), which was consistent with the effect of SMC1 KD in the whole brain (Fig. 4D). When Nep1 KD in dopaminergic neurons is restricted to adulthood only using the GAL80^ts^ TARGET system^43^, we observe an enhanced learning phenotype (Fig. 6G). Thus, Nep1 in DANs suppresses learning in adults, even though the functions of Stromalin (and presumably the cohesin complex) are necessary during development to suppress learning. This is also consistent with the decreased Nep1 mRNA levels observed in adult brains upon Stromalin reduction (Fig. 4A).Fig. 6Neprilysin 1 knockdown phenocopies the effects of Stromalin knockdown.A Nep1 KD in DANs of adult female flies increases Syt:eGFP levels in PPL1-γ1pedc. Student’s t test, ***p < 0.001 (n = 9,11). All data points were normalized to control group average (in %). B KD of Nep1 resulted in enhanced memory acquisition. Student’s t test, *p < 0.05 (n = 11,12). C Nep1 KD in DANs enhances 3 hr aversive olfactory memory. Student’s t test, ***p < 0.001 (n = 12,11). D Dopaminergic Nep1 KD increases Syt:eGFP levels in the PPL1-γ1pedc of late 3^rd^ instar larvae. Mann-Whitney U test, **p < 0.01 (n = 13). All data points were normalized to the control group average (in %). E Pan-neuronal KD of Nep1 increases Syt:eGFP levels in the whole brain of adult female flies. Student’s t test, ****p < 0.0001 (n = 13,14). All data points were normalized to the control group average (in %). F Knocking down Nep1 pan-neuronally decreases 3 hr aversive olfactory memory. Student’s t test, *p < 0.05 (n = 13). G Nep1 KD in DANs only during adulthood resulted in enhanced memory acquisition. D – development; A – adulthood. Student’s t test, *p < 0.05 (n = 6,8; 7,6). All graphs depict mean + SEM. White dotted lines on micrographs outline the mushroom body heel (A, D) or whole brain (E), Scale bar: 20 µm (A, D) or 50 µm (E).
Like Stromalin, Nep1 appears to limit synaptic vesicle numbers
Previously, we demonstrated Stromalin constrained memory by limiting the number of SVs in DANs^9^. Stromalin KD produces an increased cAMP signal in the postsynaptic mushroom body neurons (MBNs) in response to dopamine release^9,44^. Since DANs signal the foot-shock aversive stimuli in our memory paradigm (see Methods), this is consistent with the enhanced behavioral memory seen when Stromalin is reduced in these neurons. To determine if Nep1 has a similar function in DANs, we measured shock-evoked dopamine release directly from control DANs and Nep1 KD DANs using the GRAB_DA_ sensor^45^. GRAB_DA_ is a genetically encoded fluorescent sensor that allows us to measure dopamine release dynamics^45^. When dopamine is released from DANs, it binds to the sensor to increase fluorescence. As previously observed on the postsynaptic side using cAMP imaging (Fig. 7A)^9^, the initial dopamine responses in the MB heel were high in controls, then steadily decreased across the latter half of the 12 foot shocks in the PPL1-γ1pedc compartment (Fig. 7B). However, when Nep1 was reduced in DANs, the dopamine released after each shock remained consistently high, mirroring the response observed with Stromalin KD^9^. This suggests that Nep1 KD, like Stromalin KD, enhances memory acquisition by potentiating shock-induced communication between DANs and MBNs.Fig. 7. Like Stromalin, Neprilysin 1 appears to limit synaptic vesicle numbers.A SA KD in DANs resulted in increased cAMP release in response to electric shocks. The mean responses are shown as dark lines and SEM as shaded areas. R = ratio of CFP/YFP fluorescence intensity of cAMP reporter Tepac^vv^ (n = 18). Data reproduced and adapted from^9^. B Left. Dopamine release in response to 12 electric shock pulses (90 V, 1.25 s each, red bars) measured using GRAB_DA2m_. The mean responses shown as dark lines and SEM as shaded areas. Right. Quantification of second half of shock responses (7-12) as the area under the curve. Mann-Whitney U test, *p < 0.05 (n = 12). C Concurrent Nep1 and unc-104 KD in DANs rescues the learning enhancement of Nep1 KD only. One-Way ANOVA with Tukey’s post hoc, *p < 0.05, ***p < 0.001 (n = 13,13,12,12). D Concurrent Nep1 and unc-104 KD in DANs rescued the intermediate (3 hr) memory enhancement seen in Nep1 KD flies. One-Way ANOVA with Tukey’s post hoc, *p < 0.05, **p < 0.01 (n = 7,6,7,6). E Simultaneous KD of Nep1 and unc-104 in DANs normalized the Syt:eGFP levels in the PPL1-γ1pedc terminals of adult female flies. Kruskal-Wallis test with Dunn’s post hoc, *p < 0.05, **p < 0.01 (n = 16,14,14,12). All data points were normalized to the control group average (in %). F Simultaneous KD of Nep1 and unc-104 in DANs, like unc-104 KD alone, increases Syt:eGFP levels in the cell bodies of PPL1 DANs. Kruskal-Wallis test with Dunn’s post hoc, *p < 0.05, ****p < 0.0001 (n = 16,14,14,12). All data points were normalized to the control group average (in %). All graphs depict mean + SEM. White dotted lines on micrographs outline the mushroom body heel (E) or cell bodies (F). Scale bar: 20 µm (E) or 10 µm (F).
The Drosophila homolog of the mammalian motor protein KIF1A, unc-104, is responsible for the anterograde trafficking of SVs from their site of production in the cell body to the synaptic terminal^46,47^. Previously, it was shown that unc-104 KD was sufficient to rescue learning and SV marker enhancements in Stromalin KD flies^9^. Therefore, if Nep1 constricts SV numbers in the same way as Stromalin, we expect unc-104 KD to also rescue learning and SV marker enhancements in Nep1 KD flies. While unc-104 RNAi expression in DANs previously resulted in learning impairments^9^, we did not observe this effect here. Animal behavior can be quite variable and thus, this may have resulted from a number of environmental factors that changed, including our laboratory location. However, the unc-104 RNAi was still effective at rescuing the Nep1 RNAi-induced learning and memory enhancements, bringing them back to control levels (Fig. 7C, D). Reducing unc-104 also normalized the increased Syt:eGFP levels found in PPL1-γ1pedc compartment of Nep1 KD adult animals (Fig. 7E). Knockdown of unc-104 alone reduced the Syt:eGFP signal at the synaptic terminal (Fig. 7E), consistent with previous observations^9^. Because unc-104 traffics SV precursors in an anterograde fashion from the cell body to the axon terminal^46,47^, we also assessed Syt:eGFP expression levels in the PPL1 cell bodies. As expected, control and Nep1 KD DANs showed low Syt:eGFP fluorescence in the cell bodies, while unc-104 KD alone, as well as concurrent KD of unc-104 and Nep1 resulted in significant increases in SV marker fluorescence in the cell bodies (Fig. 7F).
In summary, our data indicate that both Stromalin and Nep1 act to suppress the synaptic strength between DANs and MBNs.
Nep1 is Stromalin’s downstream effector regulating learning and synaptic vesicle pool size
Our results suggest that Nep1 is the most likely candidate to mediate Stromalin’s effects on learning and SV pool size. To test this, we assessed whether overexpression of Nep1 could rescue the effects of Stromalin KD on memory and SV marker levels. We used the Nep1^EY21255^ line to overexpress Nep1, as it was previously shown to result in a 2.4-fold increase in Nep1 mRNA expression when paired with a GAL4 driver^48^.
Overexpression of Nep1 in DANs did not affect intermediate memory (Fig. 8A), nor did it alter Syt:eGFP fluorescence levels in the PPL1-γ1pedc compartment (Fig. 8B). However, when Nep1 was overexpressed while simultaneously reducing Stromalin in DANs, the flies’ memory performance was significantly impaired compared to flies expressing Stromalin RNAi alone, and their performance was not different from control flies (Fig. 8C). Similarly, overexpression of Nep1 while knocking down Stromalin also normalized Syt:eGFP levels in the PPL1-γ1pedc compartment of adult brains, making them indistinguishable from controls (Fig. 8D). In this experiment, Nep1 overexpression alone led to a decreased level of Syt:eGFP, which was not observed in our initial imaging test (Fig. 8B). Since Stromalin KD is both necessary and sufficient during the 3^rd^ instar larval stage of Drosophila development to elicit its effects on Syt:eGFP and memory in adulthood (Fig. 1A)^9^, we also imaged the Syt:eGFP signal in late 3^rd^ instar PPL1-γ1pedc while overexpressing Nep1. Concurrent KD of Stromalin with Nep1 overexpression reduced Syt:eGFP levels compared to the Stromalin RNAi-only condition but remained elevated relative to controls (Fig. 8E).Fig. 8. Overexpressing Neprilysin 1 rescues Stromalin RNAi effects on enhanced learning and increased synaptic vesicle numbers.A Overexpressing Nep1 in DANs did not lead to changes in flies’ intermediate memory retention when compared to the genetic controls. One-Way ANOVA with Tukey’s post hoc (n = 15,14,14). B Nep1 overexpression in dopaminergic neurons did not change Syt:eGFP fluorescence intensity in the PPL1-γ1pedc. Mann-Whitney U test (n = 15,17). All data points were normalized to the control group average (in %). C Nep1 overexpression with a simultaneous SA KD resulted in a rescue of a memory enhancement caused by SA KD alone. One-Way ANOVA with Tukey’s post hoc, **p < 0.01 (n = 9,9,8,8). D Nep1 overexpression with concurrent SA KD resulted in a rescue of a synaptic vesicle pool size enhancement in the PPL1-γ1pedc observed upon SA KD alone. One-Way ANOVA with Tukey’s post hoc, *p < 0.05, ***p < 0.001, ****p < 0.0001 (n = 16,18,18,17). All data points were normalized to the control group average (in %). E Nep1 overexpression combined with SA KD in dopaminergic neurons of late 3^rd^ instar larvae resulted in a significant decrease in fluorescence intensity in the PPL1-γ1pedc when compared to SA KD alone. One-Way ANOVA with Tukey’s post hoc, *p < 0.05, ****p < 0.0001 (n = 12,19,15,17). All data points were normalized to the control group average (in %). F A summary of the findings presented in this paper. Our current hypothesis is that Nep1 expression levels are set by the cohesin complex during a previously identified critical developmental window at the 3^rd^ instar larval stage and the expression level changes persist into adulthood, resulting in the learning and synaptic vesicle numbers phenotypes observed. Created in BioRender. Pimenov, I. (2026) https://BioRender.com/6tajfd8. All graphs depict mean + SEM. White dotted lines on micrographs outline the mushroom body heel. Scale bar: 20 µm.
When Nep1 KD is combined with Stromalin KD in DANs, there is an increase in intermediate memory relative to controls that is no different from knocking down either Nep1 or Stromalin individually (Supplementary Fig. 3A). This suggests that KD of Nep1 or Stromalin individually is producing a loss-of-function phenotype that increases memory performance to near maximum levels within one particular pathway (increased synaptic vesicles^9^), and therefore simultaneous knockdown of Nep1 and Stromalin does not produce an additive effect. Furthermore, building on our previous findings, we also assessed Nep1’s ability to rescue the intermediate memory and SV marker level enhancements in the whole brain. Overexpression of Nep1 did not affect intermediate memory (Supplementary Fig. 3B) and only trended toward an increase in Syt:eGFP marker levels in adult brains (Supplementary Fig. 3C). However, when Nep1 overexpression was combined with Stromalin KD, we observed a rescue of the memory enhancement in Stromalin KD flies, although memory retention was reduced compared with the controls (Supplementary Fig. 3D). By overexpressing Nep1 alongside concurrent Stromalin KD, we were able to reverse the Syt:eGFP marker increase induced by Stromalin KD in adult flies (Supplementary Fig. 3E). Thus, Nep1 overexpression rescues both the memory and SV phenotypes in Stromalin KD flies, both in DANs and pan-neuronally.
Discussion
Through DAN-specific RNA-seq and RNAi screening, we identified Nep1 dysregulation as being responsible for Stromalin’s effects on learning and SV numbers (Figs. 1–6 and Supplementary Fig. 2). Nep1 KD phenocopies a variety of Stromalin KD effects, including learning and memory enhancements (Fig. 6B, C, and Supplementary Fig. 2A and 2B), increased SV marker levels during development (Fig. 6D and Supplementary Fig. 2D) and adulthood (Fig. 6A and Supplementary Fig. 2C), and potentiates shock-induced communication between DANs and MBNs (Fig. 7B). Finally, Nep1 overexpression is sufficient to rescue memory and SV marker changes caused by Stromalin KD, both in DANs and in whole brains (Fig. 8 and Supplementary Fig. 3B-E). These data support our conclusion that changes in Nep1 expression levels result in the neurobiological effects of Stromalin KD we identified previously (Fig. 8F)^9^. However, it is possible that changes in other genes identified from our screening efforts (CG17698, Su(z)12, ttm2, and COX7C) may also contribute to the phenotypes observed in one or more neuronal populations.
The reduction of another cohesin complex subunit, SMC1, has similar effects on memory and SV marker levels as Stromalin (Fig. 4B)^9^, and Nep1 mRNA levels are also significantly reduced in SMC1 KD brains (Fig. 4C, F). Thus, we speculate that Nep1 dysregulation also occurs when the function of other cohesin complex subunits is impaired or reduced, which should be tested in future studies. Interestingly, expression of RNAi against SMC1 resulted in greater transcriptional dysregulation in whole brains compared with Stromalin RNAi (Fig. 4C). These findings are consistent with reports in patients with cohesinopathies, where individuals with mutations in SMC1 typically exhibit more severe symptoms than those with mutations in Stromalin 1 or Stromalin 2^36–40^, although for our studies, these differences may arise from the SMC1 RNAi line possibly having a greater KD efficiency than the Stromalin RNAi line. Human patients with mutations in SMC1, Stromalin 1, or Stromalin 2 cohesin complex genes typically exhibit intellectual disabilities of varying severity^36–40^. While whole-brain (pan-neuronal) KD of Stromalin results in improved aversive olfactory learning, flies with whole-brain KD of SMC1 or Nep1, and mutant Nep1 flies, are all impaired in learning and memory (Figs. 4D, 6F, and Supplementary Fig. 2E, respectively), consistent with what is seen in human patients. This could be caused by Stromalin RNAi differentially affecting transcription in different subsets of Drosophila neurons, leading to stronger Nep1 transcriptional reductions in DANs to enhance learning, while in other neurons it produces weaker or no effects on Nep1 transcription. This would also explain why we find less Stromalin KD-induced transcriptional changes in the whole brain (Fig. 4A) compared to DAN-specific KD in our RNA-seq (Supplementary Data 1) or whole brain SMC1 KD (Fig. 4C). Cohesin complex control of gene expression can be highly cell-specific and sensitive to dosage^49^.
While Nep1 expression levels appear to be set by the cohesin complex during a critical developmental window, this ‘expression level setting’ persists into adulthood to affect adult neural communication. Thus, in theory, increasing Nep1 expression levels or function in adult Drosophila may rescue the effects of reduced cohesin complex function on learning. Interestingly, several RNA-seq experiments conducted in mouse models for cohesinopathies have also identified mouse Neprilysin (NEP; also known as membrane metalloendopeptidase, MME; homologous to Drosophila Nep1^50^) as being differentially regulated in their transcriptomic datasets^41,51,52^. Homologs of two other Drosophila genes that survived our screening efforts, CG17689 and Su(z)12, also appear in several human or mouse cohesinopathy RNA-seq datasets (homologous to mammalian CAMKK1/CAMKK2 and SUZ12, respectively)^30,41,51,53,54^. Thus, transcriptional changes in NEP (or perhaps CAMKK1/CAMKK2 or SUZ12) may also contribute to the phenotypes identified in mouse models, or to cohesinopathy patient symptomatology.
Drosophila Nep1 is known to be highly expressed in MBNs^55^ (Supplementary Fig. 2F) and was found to support middle- and long-term memory formation in the α/β subset of MBNs^48,56,57^, different from Nep1 functions in the DANs we observe in this study. How exactly Drosophila Nep1 functions in DANs or MBNs to affect memory remains unclear. Nep1 is a membrane-bound zinc metalloendopeptidase known to cleave peptides on the extracellular surface^50^. Neprilysin’s functions were first identified in mammalian brains, where it was shown to cleave several neuropeptides to inhibit their signaling, including enkephalin and tachykinins^58,59^. Thus, one possibility is that reducing Nep1 expression in Drosophila neurons results in increased neuropeptidergic signaling, leading to an indirect increase in synaptic vesicle numbers that may happen as a result of increased neural communication. Alternatively, Nep1 may cleave other unknown proteins to exert its effects on neural physiology and memory. For example, mammalian NEP and Drosophila Nep1 are known to cleave amyloid-β and their functions have been implicated in attenuating the progression of Alzheimer’s disease^48,60,61^. Thus, it is possible that Nep1 may cleave some proteins that are involved in directly regulating synaptic vesicle numbers or biogenesis. Identification of the genes and molecules that control synaptic vesicle numbers in neurons continues to remain rather elusive. It is possible that some other genes that were identified in our RNA-seq and subsequent screening might have a direct role in regulating the numbers of synaptic vesicles that neurons produce.
Methods
All data were collected from independent, experimentally naïve animals (no animals were repeatedly tested). Information about fly lines and key reagents used in this study can be found in Supplementary Table 1, Supplementary Data 2, and Supplementary Data 4.
Drosophila Husbandry
Drosophila stocks were maintained on standard food at room temperature. Experimental crosses were kept on standard food at 25°C on a 12 hr light-dark cycle. A mix of male and female flies was used for behavioral experiments. For larval imaging experiments, Drosophila larvae were not discriminated by sex, whereas only female flies were used for adult imaging experiments. For TARGET experiments (Fig. 6G), flies were reared at 18°C or 30°C, as specified above the graph bars, on a 12 hr light-dark cycle.
Dopamine Neuron Cell Isolation for RNA-sequencing – Larval Brain Dissection
Several hundred parent flies were crossed and allowed to lay eggs on grape juice agar Petri dishes with active yeast paste for approximately 1.5 hr. These dishes were then discarded. Flies were then allowed to lay eggs for 2 hr on fresh plates. These eggs were then washed with dH_2_O and transferred to vials containing standard fly food medium, and incubated at 25°C. These larvae expressing UAS-mCD8:GFP, UAS-dicer2, and control or UAS-Stromalin^RNAi^ transgenes under the control of the ∆TH-D’-GAL4 driver were then harvested starting at 120 hr AEL at which time their brains were dissected in dissecting saline (9.9 mM HEPES-KOH pH 7.4, 137 mM NaCl, 5.4 mM KCl, 0.17 mM NaH_2_PO_4_, 0.22 mM KH_2_PO_4_, 3.3 mM glucose, and 43.8 mM sucrose; filter sterilized) at room temperature. The ventral nerve cord was manually removed, then brains were placed into cold S2 medium on ice in a low retention 1.5 mL Eppendorf tube. Dissections were limited to under 1 hr by two experimenters, resulting in approximately 140 brains.
Dopamine Neuron Cell Isolation for RNA-sequencing – Tissue Dissociation
Samples were then centrifuged at 2000 rpm for 1 min, and the S2 medium was removed. The brains were washed three times in dissecting saline with the addition of neural activity inhibitors (20 µM DNQX, 50 µM APV, 0.1 µM TTX). Brains were centrifuged at 2000 rpm for 1 min, then the dissecting saline was removed. A solution of 0.004% (w/v) collagenase (Abnova, cat. #P5279) combined with 5 units of L-cysteine-activated papain in 100 µL volume of dissecting saline (Worthington, cat. #LK003176) was added to the brains and a micropipette set at a volume of 30 µL was used to pipette the brains and solution 30x. The brains were left on a nutator for 20 min at room temperature, pipetting 30x every 5 min. 500 µL of SM active medium (4.18 mM KH_2_PO_4_, 1.05 mM CaCl_2_, 0.7 mM MgSO_4_•7H_2_O, 116 mM NaCl, 8 mM NaHCO_3_, 11.1 mM glucose, 5.29 mM trehalose, 2.4 mM α-ketoglutaric acid, 0.52 mM fumaric acid, 4.47 mM malic acid, 0.51 mM succinic acid, 0.2% (w/v) yeast extract, 20% (v/v) non heat-inactivated FBS, 2 µg/mL insulin, 5 mM Bis-Tris (pH 6.8); solution was adjusted to pH 6.8-6.9 with NaOH and filter sterilized, stored in aliquots at -80°C; inhibitors with final concentrations of 20 µM DNQX, 50 µM APV, and 0.1 µM TTX were added before use) was then added to the brains with papain and collagenase, centrifuged at 2000 rpm for 1 min, and the supernatant removed. The brains were washed 3x in SM active medium. Following the washes, a fresh volume of 500 µL SM active medium was added to the brains. A 1 mL syringe with a 26 G needle was then used to triturate the larval brains until no clumps of tissue were visible, then the solution with dissociated neurons was added to a 30 mm diameter Petri dish containing 750 µL of SM active medium (1.25 mL total) on ice. Cells were left to settle at the bottom of the plate for 30 min.
Dopamine Neuron Cell Isolation for RNA-sequencing – Neuron Collection
Using a glass pipette with a diameter opening of ~10-20 μm (~2-3x the diameter of our cells) mounted in a micromanipulator and under an inverted fluorescence microscope using a 20x objective, approximately 50-60 GFP^+^ neurons were collected and transferred to a second 35 mm Petri dish containing 1 mL of SM active medium. From this second plate, new glass pipettes were used to collect 25 GFP^+^ neurons while visually excluding GFP^-^ neurons using differential interference contrast (DIC) and fluorescence imaging, ensuring no GFP^-^ cells were included in our sample. The amount of medium carryover was minimized (estimated at <0.5 µL) as the salt in the medium can interfere with the DNase step when preparing libraries for RNA-seq. The 25 GFP^+^ neurons were added to the buffer from a PicoPure RNA isolation kit (Arcturus, cat. #KIT0204). Manufacturer instructions were followed to extract the RNA from the sample, which was eluted in 13 µL of buffer, then stored at -80°C until all samples for the experiment were collected. One 25-neuron sample was collected from one genotype per day, and collections of control and Stromalin KD neurons were completed on alternating days, for a total of 3 samples per genotype.
RNA-sequencing
The NuGEN Ovation SoLo RNA-seq kit with SoLo AnyDeplete Probe Mix for Drosophila was used for library preparation. The samples were run on an Illumina NextSeq 500 to obtain approximately 30 million reads per sample using the 2x40bp read chemistry. The results were analyzed by the Center for Computational Biology & Bioinformatics at the University of Florida Scripps Institute for Biomedical Innovation & Technology. The sequence quality for our samples was high as measured by Phred scores were greater than 30. Due to the nature of our samples and low RNA input, RNA quality could not be assessed prior to library creation. However, the number of expressed genes detected in our samples (~2700-4500) were similar or greater than that obtained from Drosophila neuron single cell RNA-sequencing experiments (majority of cells ~2000-3400)^62^, which are the most comparable dataset with our dopamine neuron specific RNA-sequencing dataset. Thus, we moved forward with analysis. Transcriptomic data were analyzed using DESeq2.
The RNA-seq data revealed 160 significantly differentially expressed genes between control and Stromalin KD samples (adjusted p < 0.05). Log_2_ fold change values are higher than typically found for RNA-seq studies, which are most likely due to the low-input RNA levels of our samples. 92 genes were significantly upregulated and 68 genes were downregulated. We included both up- and downregulated genes in our RNAi screen below, as the cohesin complex is thought to have both enhancer and silencing functions. We looked first for RNAi lines that corresponded to each of these differentially regulated genes in the Vienna Drosophila Resource Center (VDRC) RNAi library (preferentially obtaining RNAi lines from the KK library, and if not available, then from the GD library). Five RNAi lines were not available from the VDRC, and thus we obtained them from the Transgenic RNAi Project (TRiP) RNAi library at the Bloomington Drosophila Stock Center (BDSC; long non-coding RNA CR40450, Sfp53D, RNASEK, CG4631, CG31808). Four genes had no corresponding RNAi line available (long non-coding RNA CR44474, CG6511, Hsc20, l(3)psg2) in any of the VDRC or TRiP RNAi libraries. Altogether, we obtained 169 RNAi lines that corresponded to 156 genes identified from our RNA-seq data (due to 2 or 3 RNAi lines being available from one RNAi library for some of our genes of interest).
RNAi Primary and Secondary Screens
During the RNAi screening process, experimenters were blinded to the RNAi line tested.
The above 169 RNAi lines were crossed with ;UAS-dicer2;TH-GAL4 flies to produce progeny with gene KD in the DANs. 6 RNAi lines resulted in either high embryonic or pupal lethality when crossed with ;UAS-dicer2;TH-GAL4 (CG3529, CG8034, Bap55, ftz-f1, Pop2, Rpt1) and therefore were not tested in our screens.
The progeny then underwent a primary learning and memory behavioral screen as adult flies (5-7 days old). We used the olfactory aversive memory assay (3 hr time point^35^), for which methods are described in the “Aversive Olfactory Conditioning” section. We performed the screen with n = 4, and then eliminated 1n whose value was the farthest from the mean of each group so that any outliers would not greatly affect the screen results. A control group (corresponding to the appropriate control for the RNAi library used) was included throughout the screen to serve as a reference value. The control groups across the screen were averaged, and this value was used to divide the mean PI scores for each RNAi line (RNAi PI/average control PI across screen). We considered any magnitude greater than ±0.25 to indicate a potential memory effect (corresponding to > 25% change, equivalent to ± ~1 standard deviation, the same criterion used previously for an RNAi memory screen^35^). From this primary screen, RNAi lines against 22 genes (23 RNAi lines) produced low memory scores, while 44 produced high memory scores. Of these, 10 low and 27 high memory score genes were consistent with the transcriptional and behavioral effects of Stromalin KD (i.e., statistically significant transcriptional increase and low memory or statistically significant transcriptional decrease and high memory).
These 37 genes (38 RNAi lines) were subjected to a secondary screen by crossing them with ;UAS-Syt:eGFP;UAS-dicer2,TH-GAL4 flies, producing progeny with RNAi and Syt:eGFP expression in the DANs. Six fly (5-6 days old) brains were dissected from each genotype and immunostained for GFP, as we have done for previous experiments^9^, along with a control group (corresponding to the appropriate control for the RNAi library used). The average fluorescence intensity (FI) for the dopaminergic innervation of the mushroom body heel area was calculated. The relative fluorescence intensity (RNAi FI/control FI) was calculated for each RNAi line, and we considered any magnitude greater than ±0.25 to indicate a potential effect on SVs (corresponding to a > 25% change). Of the 10 low memory scoring genes tested, RNAi lines against 2 genes (CG42336, AP-1σ) produced a corresponding decrease in Syt:eGFP relative fluorescence. Of the 27 high memory scoring genes tested, RNAi lines against 8 genes (atms, Elp1, CG2278, Su(z)12, CG17698, COX7C, Nep1, ttm2) produced a corresponding increase in Syt:eGFP relative fluorescence.
For the 10 RNAi lines that passed both the primary and secondary screen (2 low hits and 8 high hits), we then retested them for 3 hr memory and Syt:eGFP effects. For retesting Syt:eGFP effects, we combined the UAS-Syt:eGFP transgenes with the RNAi line, then crossed with ;UAS-dicer2;TH-GAL4 flies to avoid any potential problems resulting from constitutively expressing Syt:eGFP. Five of the 8 high-hit RNAi lines reproduced both significantly higher 3 hr memory scores and higher Syt:eGFP fluorescence intensity compared to controls, while neither of the 2 low hits had scores significantly different from controls. These genes were Su(z)12, CG17698, COX7C, Nep1, and ttm2.
NanoString nCounter mRNA Analysis
Stromalin RNAi, Su(z)12 RNAi, or SMC1 RNAi with their respective control lines were crossed to ;UAS-dicer2;nSyb-GAL4 line to allow for pan-neuronal expression of the transgenes. 5-6 day old adult fly brains (male and female) were dissected in RNAlater^TM^ (Sigma-Aldrich, cat. #R0901) solution and frozen in 1.5 mL test tubes in RNAlater^TM^ at -20°C. 150 brains were dissected per genotype per sample, with 4 biological replicates per experiment. RNA extraction procedure was done 1-2 days after dissections using Qiagen RNeasy^®^ Lipid Tissue Mini Kit (Qiagen, cat. #74804) according to the manufacturer’s protocol and treated with DNase (TURBO DNA-free^TM^ Kit, Invitrogen, cat. #AM1907). RNA quality was assessed (Agilent 2100 Bioanalyzer G2938C), then samples were run using a custom designed probe set on the nCounter system (nCounter Prep Station 5 s & nCounter Digital Analyzer 5 s) at the University of Alberta LMP Pathology Core as per manufacturer’s protocol. RNA was used directly in the nCounter system to quantify mRNA reads (no amplification). As recommended by the manufacturer, we used 6 housekeeping genes for normalization, 2 of which are commonly used for qPCR (αTub84B and Gapdh2), and 4 genes that were highly expressed and whose expression remained unchanged in our Stromalin KD samples, based on our DAN RNA-seq data (Act5C, brp, unc-104, and dicer2; dicer2 was artificially overexpressed using the GAL4-UAS system in our samples). Of note, our SMC1 and Su(z)12 samples did show significant gene expression changes in some of the genes designated as housekeeping genes; in future experiments a different set of housekeeping genes should be considered. We used NanoString’s nSolver program to analyze gene expression changes and perform statistical analyses, as per manufacturer’s instructions.
Reverse Transcription-quantitative Polymerase Chain Reaction (RT-qPCR)
Stromalin RNAi or SMC1 RNAi lines, together with their respective controls, were crossed to ;UAS-dicer2;nSyb-GAL4 line to allow for pan-neuronal expression of the transgenes. 5-7 day old adult fly brains (male and female) were dissected in RNAlater^TM^ (Sigma-Aldrich, cat. #R0901) solution and frozen in 1.5 mL test tubes in RNAlater^TM^ at -20°C. 80-100 brains were dissected per genotype per sample, with 5-6 biological replicates per experiment. RNA extraction procedure was done 1-2 days after dissections using Qiagen RNeasy^®^ Lipid Tissue Mini Kit (Qiagen, cat. #74804) according to the manufacturer’s protocol and treated with DNase (TURBO DNA-free^TM^ Kit, Invitrogen, cat. #AM1907). RNA quality was assessed (Agilent 2100 Bioanalyzer G2938C), then samples were reverse-transcribed with oligo(dT)20 primers using the SuperScript^TM^ III First-Strand kit (Invitrogen, cat. #18080-051) according to the manufacturer’s protocol. Amplification was performed using the Applied Biosystems 7500 Fast Real-Time PCR System and 2X SYBR Green qPCR Master Mix (Dynamite, a proprietary mix developed and distributed by the Molecular Biology Service Unit (MBSU) in the Department of Biological Sciences at the University of Alberta). Reactions were performed in triplicate. We used Gapdh2 housekeeping gene for normalization. Fold gene expression is shown as a \documentclass[12pt]{minimal} \usepackage{amsmath} \usepackage{wasysym} \usepackage{amsfonts} \usepackage{amssymb} \usepackage{amsbsy} \usepackage{mathrsfs} \usepackage{upgreek} \setlength{\oddsidemargin}{-69pt} \begin{document}$$2^{\mbox{-}(\Delta \Delta C_{T})}$$\end{document} value.
Aversive Olfactory Conditioning
Behavioral experiments were conducted using a standard aversive olfactory conditioning paradigm described previously^35^. Mixed-sex 1-5 day old flies were used for all experiments, unless stated otherwise. The experiments were conducted at 24-26°C under red light, and in ~60-80% humidity. Flies were collected ~24 hr prior to experiments, 60 flies per food vial x 2 for each data point (counterbalancing the trained odor). On the testing day, flies were acclimated for >15 min in a new food vial before aversive olfactory training. Flies were transferred into training tubes where they were exposed to 30 sec of air, 30 sec or 1 min of odor A paired with electric shock (CS^+^), 30 sec of fresh air, 30 sec or 1 min of odor B without electric shock (CS^-^), then 30 sec of air. For learning experiments, flies received 6 shocks across 30 sec while for intermediate memory experiments they received 12 shocks across 1 min, each shock delivered at 90 V for 1.25 sec in duration at 5 sec intervals^9^. Three min or 3 hr after training for learning and intermediate experiments, respectively, flies were placed in a T-maze, where they acclimated for 1 min, then were given 2 min to choose between an arm with the CS^+^ odor and the arm with the CS^-^ odor. Afterwards, the flies were tapped into collection tubes, frozen at -20°C, and counted. A preference index (PI) score was calculated as follows: (CS^-^ - CS^+^)/(CS^-^ + CS^+^). Odors used were diluted in mineral oil (0.05-0.15%), counterbalanced, and pairs of odors were: Benzaldehyde and OCT (3-octanol) that were used for screening, and MCH (4-methylcyclohexanol) and OCT used for all other experiments.
Immunohistochemistry
Unless otherwise stated, 1-5 day old adult female or larval brains were used for immunohistochemistry experiments. The dissections and processing of whole brains was performed as described previously^63^. Briefly, brains were dissected in Schneider’s Insect Medium (Sigma-Aldrich, cat. #S0146), then fixed with 1% PFA in S2 medium at 4°C overnight. Brains were washed in PAT3 (0.5% Triton X-100, 0.5% BSA in 1x PBS), blocked in PAT3 containing 3% normal goat serum (NGS; 1 hr at room temperature), then incubated with primary antibodies in PAT3 with 3% NGS (3 hr at room temperature, then overnight at 4°C). Brains were washed in PAT3, then incubated with secondary antibodies in 3% NGS in PAT3 (3 hr at room temperature, then for 5 days at 4°C). Brains were washed in PAT3, rinsed quickly in PBS (phosphate buffered saline), then in dH_2_O before mounting between two glass coverslips held apart by spacers on a glass slide. Primary antibodies used include rabbit anti-GFP (1:1000, Invitrogen, cat. #A11122) and mouse monoclonal anti-NC82 (1:25 or 1:50, Developmental Studies Hybridoma Bank, AB_2314866). Secondary antibodies used include goat anti-rabbit Alexa Fluor^TM^ 488 (1:1000, Invitrogen, cat. #A11008) and goat anti-mouse Alexa Fluor^TM^ 633 (1:400, Invitrogen, cat. #A21050).
Confocal Imaging of Fixed Samples
The brains were imaged on Leica TCS SP5, SP8 or STELLARIS 5 confocal microscope using a 10x, 20x water immersion, or 25x water immersion objective with 488 nm and/or 638 nm laser excitation. All brain images were imaged using 1 µm image stacks. Images were analyzed using ImageJ. For whole brain fluorescence analysis, a region of interest (ROI) was drawn outlining the brain. For measuring the fluorescence in the mushroom body heel, the fluorescence intensity values were obtained by drawing a circular ROI of a consistent size within the heel per experiment. For analysis of dopaminergic PPL1 cell bodies, ROIs were drawn around all visible individual cell bodies. The mean fluorescence intensity values were averaged between the anterior and posterior limits of the structure of interest. Data from both brain hemispheres (for heel and cell body analyses) were collected and then averaged to obtain a single value per region per animal. If the region of interest was obscured (e.g., with debris), a hemisphere (whole brain) was excluded from the analysis. All imaging data, unless stated otherwise, were normalized to the control group and expressed as % of the control value for ease of comparison.
Functional Imaging
Female flies (5-6 days old) were used for in vivo functional imaging experiments as described previously^7^. Non-anesthetized flies were aspirated and their proboscis was glued with myristic acid. Flies were inserted in a custom-designed platform, then their thorax and head were glued to an opening in the platform using UV glue (Fotoplast^®^ Gel, Dreve #44691). A window in the dorsal cuticle of the fly head was cut using a 23 G syringe needle and physiological saline (124 mM NaCl, 3 mM KCl, 20 mM MOPS, 1.5 mM CaCl_2_, 4 mM MgCl_2_•6H_2_O, 5 mM NaHCO_3_, 1 mM NaH_2_PO_4_•H_2_O, 10 mM trehalose, 7 mM sucrose, 10 mM glucose; pH 7.2) was immediately applied. Forceps were used to remove the cuticle, fat tissue, and trachea on the surface of the brain. Flies were checked for normal activity levels before and after imaging. Flies were then mounted under the 25x water immersion objective on Leica STELLARIS 5. The legs of the fly were positioned on a copper grid used to deliver 12 electric shock pulses (90 V, 1.25 sec duration at 5 sec intervals). Dopamine sensor GRAB_DA2m_^45^ was expressed in the MBNs, and the shock responses in the heel region of one hemisphere of the mushroom body were analyzed. Time series fluorescence images were collected across 2 min 30 sec (45 sec baseline, 1 min shock, 45 sec recovery) using 488 nm laser excitation and a frame rate of 4 Hz using a resonance scanner. Fluorescence intensity changes were calculated as ((F_t_ – F_0_)/F_0_) x 100% (where F_0 = mean fluorescence across 5 sec prior to foot shock and F_t = fluorescence intensity at time t) using ImageJ and MATLAB.
Statistics and Reproducibility
Data were compiled using Excel and/or MATLAB. Statistical analyses were performed using SPSS Statistics. All tests were two-tailed and α = 0.05. All behavioral experiments were analyzed using parametric statistics, as memory PI scores are normally distributed^35^, whereas imaging experiments were analyzed using parametric or nonparametric tests as appropriate. The exact statistical tests and sample sizes used are listed in the figure legends. The graphs were plotted in Excel, Matlab, or BioRender. Exact statistical analysis values can be found in Supplementary Data 5.
Reporting summary
Further information on research design is available in the Nature Portfolio Reporting Summary linked to this article.
Supplementary information
Supplementary Information Description of Additional Supplementary Files Supplementary Data 1 Supplementary Data 2 Supplementary Data 3 Supplementary Data 4 Supplementary Data 5 Supplementary Data 6 Reporting Summary