Predictive value of OGTT parameters and clinical markers in gestational diabetes mellitus: a prospective randomized controlled trial from a tertiary center in Türkiye
Batuhan Turgay, Uğurcan Zorlu, Harun Kılıçkıran, Kayra Turgay, Gülşah Aynaoğlu Yıldız, Elif Gül Yapar Eyi, A. Seval Ozgu-Erdinc

TL;DR
This study compares two methods for diagnosing gestational diabetes and finds that a one-step glucose test identifies more cases but doesn't improve outcomes, with 2-hour glucose levels being most predictive of complications.
Contribution
Demonstrates that 2-hour OGTT values are better predictors of pregnancy complications than diagnostic thresholds alone.
Findings
One-step OGTT identifies more GDM cases but doesn't improve maternal or neonatal outcomes compared to two-step strategy.
2-hour OGTT glucose levels show strongest predictive value for polyhydramnios and insulin requirement (AUC up to 0.816 and 0.808).
Rates of complications like macrosomia and preterm birth are similar between diagnostic approaches.
Abstract
Gestational diabetes mellitus (GDM) remains a major obstetric concern, yet the optimal screening strategy and the prognostic value of oral glucose tolerance test (OGTT) parameters remain debated. We aimed to compare the diagnostic yield and clinical outcomes of a two-step OGTT strategy (50 g glucose challenge followed by 100 g OGTT) versus a one-step 75 g OGTT approach, and to evaluate the predictive performance of individual OGTT time points for pregnancy complications and treatment requirement. In this prospective randomized controlled trial, 1,439 pregnant women undergoing routine screening at 24–28 weeks of gestation were randomized to either a two-step OGTT strategy (n=719) or a one-step 75 g OGTT strategy (n=720). GDM was classified as diet-controlled or insulin-requiring. Maternal risk factors, obstetric outcomes, and neonatal outcomes were recorded. Receiver operating…
Genes, proteins, chemicals, diseases, species, mutations and cell lines named across the full text — each resolved to its canonical identifier and authoritative record.
Click any figure to enlarge with its caption.
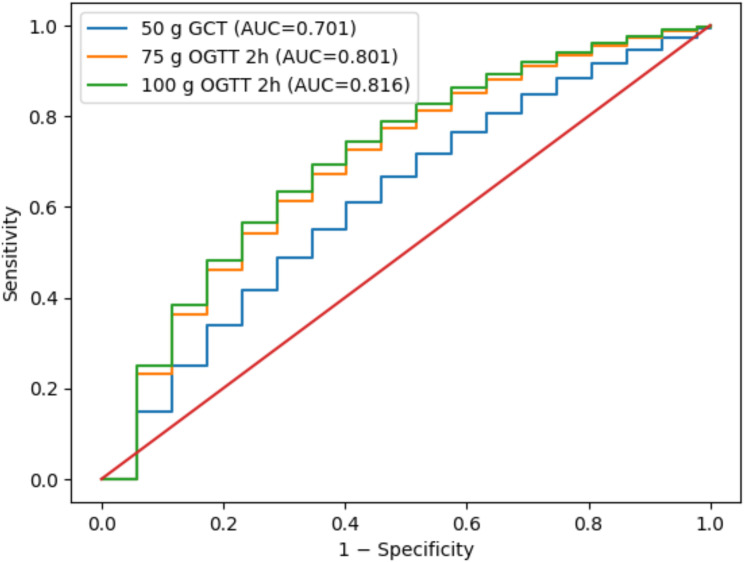 Figure 1
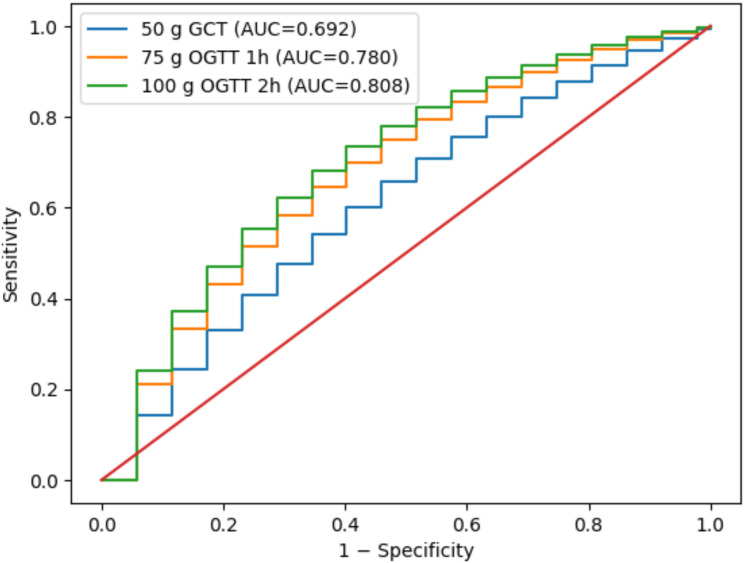 Figure 2
| Characteristic | Diet (n=121) | Insulin (n=56) | Control (n=1262) | 50 g group (n=719) | 75 g group (n=720) | P-value |
|---|---|---|---|---|---|---|
| Age (mean ± SD) | 30.4 ± 3.3 | 30.6 ± 3.6 | 29.8 ± 3.5 | 30.0 ± 3.4 | 30.2 ± 3.5 | 0.640 |
| BMI (mean ± SD) | 26.7 ± 2.4 | 26.9 ± 2.6 | 26.3 ± 2.3 | 26.5 ± 2.3 | 26.6 ± 2.4 | 0.258 |
| Gravida (median [min–max]) | 2 (1–3) | 2 (1–3) | 2 (1–3) | 2 (1–3) | 2 (1–3) | 0.721 |
| Parity (median [min–max]) | 1 (0–2) | 1 (0–2) | 1 (0–2) | 1 (0–2) | 1 (0–2) | 0.148 |
| Characteristic | Diet (%) | Insulin (%) | Control (%) | 50 g group (%) | 75 g group (%) | P-value |
|---|---|---|---|---|---|---|
| Presence of comorbidities | 28.9 | 29.4 | 20.1 | 23.5 | 25.3 | 0.220 |
| History of IUFD | 5.8 | 8.7 | 5.2 | 5.5 | 6.1 | 0.331 |
| IVF/IUI conception | 12.4 | 15.9 | 10.8 | 11.1 | 11.8 | 0.287 |
| Hypertension | 7.4 | 9.1 | 4.6 | 6.1 | 6.3 | 0.185 |
| History of embolism | 0.8 | 3.7 | 0.7 | 1.5 | 1.9 | 0.273 |
| Family history of DM | 25.6 | 26.5 | 10.1 | 14.8 | 15.6 | <0.001 |
| GDM in sister | 14.9 | 20.4 | 2.8 | 7.1 | 7.8 | <0.001 |
| Previous pregnancy with GDM | 13.2 | 22.1 | 2.1 | 6.5 | 7.0 | <0.001 |
| Previous infant >4 kg | 18.2 | 21.5 | 8.5 | 12.2 | 13.1 | <0.001 |
| Previous polyhydramnios | 9.9 | 12.3 | 4.7 | 6.4 | 7.2 | 0.195 |
| Characteristic | Diet (%) | Insulin (%) | Control (%) | 50 g group (%) | 75 g group (%) | P-value |
|---|---|---|---|---|---|---|
| Regular exercise | 25.2 | 23.0 | 27.0 | 25.8 | 26.2 | 0.685 |
| Presence of PCOS | 17.8 | 18.2 | 7.9 | 11.1 | 11.5 | <0.001 |
| Smoking | 9.9 | 8.7 | 10.7 | 9.8 | 9.9 | 0.870 |
| Alcohol consumption | 2.4 | 2.0 | 4.1 | 3.5 | 3.1 | 0.520 |
| Vitamin supplementation | 89.5 | 89.0 | 87.3 | 88.4 | 88.2 | 0.712 |
| Polyhydramnios (current) | 7.6 | 10.9 | 5.3 | 6.0 | 6.5 | 0.210 |
| Gestational weight gain (kg, mean ± SD) | 11.7 ± 3.1 | 13.0 ± 3.8 | 12.0 ± 2.9 | 11.9 ± 3.1 | 12.1 ± 3.2 | 0.018 |
| Group | Total N | GDM, n (%) | Diet-GDM, n (%) | Insulin-GDM, n (%) | Control, n (%) |
|---|---|---|---|---|---|
| 50 g two-step group | 719 | 84 (11.7) | 56 (7.8) | 28 (3.9) | 635 (88.3) |
| 75 g one-step group | 720 | 93 (12.9) | 65 (9.0) | 28 (3.9) | 627 (87.1) |
| Outcome | 50 g group (%) | 75 g group (%) | P-value |
|---|---|---|---|
| Polyhydramnios | 6.1 | 6.5 | 0.742 |
| Hypertensive disorders | 5.9 | 6.1 | 0.801 |
| Macrosomia (>4000 g) | 9.0 | 9.4 | 0.851 |
| Preterm birth (<37 wks) | 8.1 | 8.3 | 0.877 |
| NICU admission | 10.2 | 10.5 | 0.903 |
| Cesarean section | 38.5 | 39.1 | 0.715 |
| Test | AUC | 95% CI | Cut-off (Youden) | Sensitivity | Specificity |
|---|---|---|---|---|---|
| 50 g OGTT | 0.701 | 0.639–0.767 | 142 mg/dL | 0.658 | 0.689 |
| 75 g OGTT – 0h | 0.664 | 0.592–0.731 | 92 mg/dL | 0.623 | 0.674 |
| 75 g OGTT – 1h | 0.782 | 0.724–0.835 | 184 mg/dL | 0.740 | 0.757 |
| 75 g OGTT – 2h | 0.801 | 0.748–0.855 | 158 mg/dL | 0.769 | 0.776 |
| 100 g OGTT – 0h | 0.677 | 0.615–0.735 | 96 mg/dL | 0.642 | 0.687 |
| 100 g OGTT – 1h | 0.789 | 0.734–0.842 | 185 mg/dL | 0.747 | 0.764 |
| 100 g OGTT – 2h | 0.816 | 0.768–0.864 | 160 mg/dL | 0.782 | 0.780 |
| 100 g OGTT – 3h | 0.773 | 0.716–0.831 | 143 mg/dL | 0.732 | 0.753 |
| Test | AUC | 95% CI | Cut-off (Youden) | Sensitivity | Specificity |
|---|---|---|---|---|---|
| 50 g OGTT | 0.692 | 0.631–0.750 | 147 mg/dL | 0.700 | 0.662 |
| 75 g OGTT – 0h | 0.751 | 0.691–0.804 | 95 mg/dL | 0.728 | 0.707 |
| 75 g OGTT – 1h | 0.780 | 0.723–0.832 | 186 mg/dL | 0.745 | 0.750 |
| 75 g OGTT – 2h | 0.765 | 0.706–0.823 | 162 mg/dL | 0.713 | 0.760 |
| 100 g OGTT – 0h | 0.762 | 0.703–0.822 | 97 mg/dL | 0.734 | 0.742 |
| 100 g OGTT – 1h | 0.787 | 0.732–0.839 | 188 mg/dL | 0.758 | 0.766 |
| 100 g OGTT – 2h | 0.808 | 0.756–0.859 | 161 mg/dL | 0.780 | 0.770 |
| 100 g OGTT – 3h | 0.770 | 0.710–0.827 | 143 mg/dL | 0.727 | 0.759 |
Peer Reviews
No public reviews on file for this paper yet. If you reviewed it on a platform where reviews are public (OpenReview, ICLR, NeurIPS, ICML), you can paste yours below so the community can read it here.
Videos
No videos yet. Explain this paper in a talk, walkthrough, or lecture? Add one.
Taxonomy
TopicsGestational Diabetes Research and Management · Pregnancy and preeclampsia studies · Bariatric Surgery and Outcomes
Introduction
Gestational diabetes mellitus (GDM) is a common metabolic complication of pregnancy and is associated with increased risks of polyhydramnios, hypertensive disorders, macrosomia, operative delivery, and long-term metabolic disease in both mothers and their offspring (1–3). Given its growing prevalence worldwide, accurate screening and clinically meaningful risk stratification remain central objectives of modern perinatal care (1, 2). Globally, GDM prevalence is estimated to range between approximately 7% and 15%, largely depending on diagnostic criteria and population characteristics (4, 5). In Türkiye, prospective cohort studies and randomized screening trials conducted in tertiary referral populations have reported prevalence rates broadly ranging between 8% and 17%, reflecting both regional metabolic risk profiles and variability in screening strategies (6, 7). These findings highlight a substantial and increasing national disease burden and emphasize the need for optimized risk-based screening approaches.
Currently, two main screening strategies are used in clinical practice: the two-step oral glucose tolerance test (OGTT) approach, consisting of a 50 g glucose challenge test followed by a diagnostic 100 g OGTT using Carpenter–Coustan criteria, and the one-step 75 g OGTT approach based on the International Association of Diabetes and Pregnancy Study Groups (IADPSG) recommendations (3, 8–10). Although the one-step strategy consistently increases the prevalence of GDM diagnosis, concerns persist regarding potential overdiagnosis and the lack of consistent evidence demonstrating improved maternal or neonatal outcomes (11–13). Randomized clinical studies comparing one-step and two-step screening strategies have suggested that broader diagnostic thresholds may increase case detection without proportionate reductions in clinically meaningful complications, contributing to ongoing debate regarding optimal screening policies in both global and regional populations (5).
Beyond screening strategy selection, increasing attention has focused on the prognostic significance of individual OGTT parameters. Previous studies suggest that post-load glucose values, particularly at later time points, may better reflect disease severity and predict adverse pregnancy outcomes or the need for insulin therapy (4, 14). However, most existing investigations have primarily evaluated diagnostic performance rather than prognostic stratification, and prospective randomized trials examining whether specific OGTT time points provide clinically actionable predictive information remain limited. This represents an important gap in the literature, especially within intermediate-risk populations such as those represented in Turkish tertiary-care cohorts (6, 7). Therefore, this study aimed to compare the diagnostic yield and clinical impact of the two-step and one-step screening approaches and to assess the predictive performance of OGTT parameters for pregnancy complications and treatment modality. We hypothesized that, irrespective of screening strategy, post-load OGTT values—particularly 2-hour glucose levels—would demonstrate superior predictive performance for clinically relevant outcomes compared with fasting measurements alone, supporting a more individualized risk-stratified framework for GDM management.
Materials and methods
Study design and setting
This investigation was conducted as a prospective, randomized controlled trial at Ankara Bilkent City Hospital, one of the largest tertiary referral centers in Türkiye, between 2022 and December 2023. The aim was to evaluate two different screening strategies for GDM and to assess their diagnostic yield and impact on maternal and neonatal outcomes. The study protocol was approved by the Institutional Ethics Committee (Approval No: E1-20-800). Written informed consent was obtained from all participants in accordance with the Declaration of Helsinki. NCT number is NCT04585204.
The study compared a two-step OGTT approach (50 g glucose challenge test followed by diagnostic 100 g OGTT using Carpenter–Coustan criteria) with a one-step 75 g OGTT approach based on International Association of Diabetes and Pregnancy Study Groups (IADPSG) recommendations.
Sample size estimation was based on detecting a clinically meaningful difference in GDM prevalence between screening strategies with an alpha level of 0.05 and a statistical power of 80%. The target sample size exceeded 1,400 participants to ensure adequate power for subgroup and ROC analyses.
Our randomized design allowed:
Comparison of GDM prevalence between the two-step OGTT and one-step 75 g OGTT approaches.Assessment of whether the higher diagnosis rate translated into different maternal or neonatal outcomes.Evaluation of the predictive performance of OGTT parameters for complications and treatment modality.
A total of 1,439 pregnant women presenting for routine GDM screening at 24–28 weeks of gestation were screened. Age ≥18 years, singleton pregnancy, no pregestational diabetes, and ability to provide consent were inclusion criteria. Pre-existing type 1 or type 2 diabetes, multiple gestation, chronic hepatic/renal/autoimmune disease, corticosteroid or glucose-altering drug use, refusal of consent, or incomplete OGTT data were exclusion criteria.
Participants were randomized in a 1:1 ratio using a computer-generated sequence prepared by an independent statistician. Allocation was concealed in sequential opaque envelopes. Participants and clinicians were not blinded due to the nature of glucose testing, but outcome assessors and statisticians remained blinded to allocation. Randomization was not stratified; however, maternal age and pre-pregnancy BMI were prespecified variables for adjusted and stratified analyses.
Diagnostic protocols
Group A — Two-step OGTT approach (n=719):
50 g glucose challenge test (non-fasting, 1 h).If plasma glucose ≥140 mg/dL, a diagnostic 100 g OGTT was performed (fasting, 1-2–3 h).Carpenter–Coustan diagnostic thresholds were applied: fasting ≥95 mg/dL, 1 h ≥180 mg/dL, 2 h ≥155 mg/dL, and 3 h ≥140 mg/dL; ≥2 abnormal values were required for GDM diagnosis.
Group B — One-step 75 g OGTT approach (n=720):
75 g OGTT performed in the fasting state (0-1–2 h).IADPSG thresholds were used: fasting ≥92 mg/dL, 1 h ≥180 mg/dL, and 2 h ≥153 mg/dL; ≥1 abnormal value was sufficient for diagnosis.
Following diagnosis, women were classified as diet-controlled GDM (GDM-D), insulin-requiring GDM (GDM-I), or controls (normoglycemic). Women with incomplete OGTT results were excluded from per-protocol analysis but included in intention-to-treat analysis when possible. Missing categorical data (<5%) were excluded case-wise. Sensitivity analyses were conducted to evaluate the potential impact of missing data, and no significant differences were observed compared with the primary analysis.
Outcomes
Primary outcomes:
GDM prevalence and distribution (diet vs insulin) between screening strategies.Predictive value of OGTT parameters for polyhydramnios and treatment modality.
Secondary outcomes:
Maternal outcomes: hypertensive disorders of pregnancy (including gestational hypertension, preeclampsia, and eclampsia), polyhydramnios, cesarean section, gestational weight gain.Neonatal outcomes: macrosomia, preterm delivery, NICU admission, low birth weight, small for gestational age (SGA), and intrauterine growth restriction (IUGR); outcomes with limited event numbers were reported descriptively.Risk factor associations, including pre-pregnancy body mass index (BMI), family history of diabetes mellitus, polycystic ovary syndrome (PCOS), and obstetric history.
Statistical analysis
Analyses were conducted with SPSS version 25. Continuous variables were tested for normality using the Kolmogorov–Smirnov test. Parametric data are presented as mean ± standard deviation (SD), and non-parametric data as median [minimum–maximum]. Between-group comparisons were performed using the independent samples t-test or one-way ANOVA for parametric variables, and the Mann–Whitney U test or Kruskal–Wallis test for non-parametric variables. Categorical variables are expressed as frequencies and percentages and were compared using the Chi-square test or Fisher’s exact test, as appropriate.
Receiver operating characteristic (ROC) analyses were performed to evaluate the diagnostic performance of OGTT parameters for (i) prediction of polyhydramnios and (ii) differentiation between diet- and insulin-treated patients. AUC values with 95% confidence intervals, optimal cut-off values determined by the Youden Index, sensitivity, and specificity were calculated. ROC curves are presented graphically in Figures 1, 2.
Hybrid ROC curves for prediction of polyhydramnios.
Stepwise ROC curves of OGTT parameters for prediction of insulin requirement.
Multivariable logistic regression analyses were conducted to determine independent predictors of GDM diagnosis and insulin requirement, adjusting for maternal age, pre-pregnancy BMI, family history of diabetes, and PCOS. Additional stratified analyses were performed according to maternal age categories and BMI groups to evaluate potential effect modification.
All analyses were two-tailed, and a p value <0.05 was considered statistically significant.
Results
Baseline characteristics
A total of 1,439 women were randomized into two groups: 719 underwent the two-step OGTT approach (50 g screening followed by diagnostic 100 g OGTT) and 720 underwent the one-step 75 g OGTT approach. Of these, 177 (12.3%) were diagnosed with GDM, including 121 (8.4%) diet-controlled (GDM-D) and 56 (3.9%) insulin-requiring (GDM-I) cases, while 1,241 (87.7%) served as controls.
Baseline demographic characteristics are presented in Table 1. Maternal age was comparable across groups (Diet: 30.4 ± 3.3; Insulin: 30.6 ± 3.6; Control: 29.8 ± 3.5 years; p = 0.640). BMI values were also similar (Diet: 26.7 ± 2.4; Insulin: 26.9 ± 2.6; Control: 26.3 ± 2.3; p = 0.258). Gravida and parity distributions did not differ significantly among subgroups or between screening strategies. These findings confirm that randomization achieved well-balanced baseline demographics.
Additional stratified analyses according to maternal age categories and pre-pregnancy BMI were performed, demonstrating no statistically significant interaction between screening strategy and these variables.
Clinical and obstetric history
Clinical and obstetric characteristics are presented in Table 2. Women with GDM (both diet and insulin groups) had significantly higher prevalence of family history of diabetes, GDM in a first-degree relative, previous GDM, and previous infant >4,000 g (all p < 0.001). Other comorbidities (hypertension, history of embolism, IVF conception, prior polyhydramnios) were not significantly different between groups (all p > 0.05), confirming comparable baseline obstetric risk profiles between screening strategies.
Lifestyle and pregnancy factors
Lifestyle characteristics are summarized in Table 3. Rates of regular exercise (25–27%), smoking (8–11%), alcohol consumption (2–4%), and vitamin supplementation (87–90%) were similar across groups (all p > 0.05). However, PCOS prevalence was higher among women with GDM (Diet: 17.8%; Insulin: 18.2%; Control: 7.9%; p < 0.001). Gestational weight gain was significantly higher in the insulin group (13.0 ± 3.8 kg) compared to diet-treated (11.7 ± 3.1 kg) and control women (12.0 ± 2.9 kg; p = 0.018). Current pregnancy polyhydramnios was numerically higher in the insulin group but did not reach statistical significance.
Diagnostic yield of screening protocols
A total of 177 women (12.3%) were diagnosed with gestational diabetes mellitus. Although the prevalence of GDM was numerically higher in the one-step 75 g OGTT approach compared with the two-step OGTT approach, this difference did not reach statistical significance (12.9% vs 11.7%, p = .318) (Table 4).
Maternal and neonatal outcomes
Maternal and neonatal outcomes are summarized in Table 5. No significant differences were observed between screening strategies in polyhydramnios (6.1% vs 6.5%), hypertensive disorders of pregnancy (5.9% vs 6.1%), macrosomia (>4000 g: 9.0% vs 9.4%), preterm birth (<37 weeks: 8.1% vs 8.3%), NICU admission (10.2% vs 10.5%), or cesarean delivery (38.5% vs 39.1%) (all p > 0.05).
Rates of fetal growth–related outcomes remained low overall. The prevalence of small for gestational age (SGA) was 7.4% and intrauterine growth restriction (IUGR) was 4.2%, values consistent with expected ranges reported in comparable obstetric populations. No statistically or clinically meaningful differences were observed between the two-step OGTT and one-step 75 g OGTT screening strategies for these outcomes (all p > 0.05). These findings indicate that the increased diagnostic rate observed with the one-step approach did not translate into improved neonatal growth-related outcomes.
Predictive performance of OGTT parameters
The predictive ability of OGTT parameters for polyhydramnios is presented in Table 6 and illustrated in Figure 1. The strongest predictors were the 100 g OGTT 2 h value (AUC = 0.816) and the 75 g OGTT 2 h value (AUC = 0.801), both demonstrating high discriminatory power. The 75 g 1 h value also showed good predictive performance (AUC = 0.782), whereas the 50 g screening test demonstrated only moderate predictive ability (AUC = 0.701).
For differentiating diet-controlled versus insulin-requiring GDM (Table 7, Figure 2), the 100 g OGTT 2 h value again performed best (AUC = 0.808). The 75 g OGTT 1 h and 2 h values also demonstrated strong discrimination (AUC range: 0.765–0.780), while the 50 g challenge test showed lower performance (AUC = 0.692). These findings highlight that post-load OGTT parameters, particularly 2-hour glucose values, provide the most clinically useful predictive information for both complications and treatment stratification.
Discussion
GDM remains a major obstetric challenge due to its well-established associations with adverse maternal and neonatal outcomes and its long-term metabolic implications. Screening strategies aim to balance early identification of at-risk pregnancies with avoidance of unnecessary medicalization. In this prospective randomized controlled trial, we compared two widely used screening approaches and evaluated the prognostic value of individual OGTT parameters within a tertiary-care population.
Although the one-step 75 g OGTT strategy has been increasingly adopted in clinical practice, concerns remain regarding whether expanded diagnostic thresholds translate into meaningful improvements in outcomes. Our findings demonstrate that despite a numerically higher rate of GDM diagnosis with the one-step approach, maternal and neonatal outcomes were largely comparable between screening strategies. These results are consistent with prior randomized and observational data suggesting that broader diagnostic criteria may increase case detection without proportional clinical benefit.
A key strength of this study lies in evaluating OGTT parameters as prognostic markers rather than solely diagnostic thresholds. We observed that post-load glucose values, particularly 2-hour measurements, provided the strongest predictive performance for polyhydramnios and for distinguishing diet-controlled from insulin-requiring GDM. Previous investigations have similarly reported that elevated OGTT values are closely associated with increased likelihood of pharmacologic treatment and metabolic severity (15). Furthermore, evidence from randomized trials evaluating treatment effects in mild GDM indicates that glucose patterns across the OGTT may better reflect clinical risk than fasting glucose values alone (16). Together, these findings support the concept that dynamic glycemic responses provide clinically actionable information beyond binary diagnostic cut-offs.
From a biological standpoint, elevated late OGTT values may reflect impaired peripheral glucose utilization and progressive insulin resistance mediated by placental hormones. Studies examining selective screening strategies have demonstrated that post-challenge glucose levels correlate with metabolic burden and adverse outcomes even within intermediate-risk populations (17). Similarly, early pregnancy metabolic and inflammatory markers have been linked to subsequent GDM development, underscoring the multifactorial nature of glucose dysregulation during pregnancy (18, 19). When interpreted alongside our findings, these data support a multidimensional risk-stratified approach that integrates OGTT profiles with additional metabolic indicators.
Importantly, although the one-step strategy identified more women with milder glycemic abnormalities, this increase did not result in significant differences in clinically relevant outcomes, including polyhydramnios, hypertensive disorders, macrosomia, small for gestational age, intrauterine growth restriction, or neonatal intensive care unit admission. These observations suggest that expanding diagnostic thresholds alone may increase healthcare utilization without clear clinical benefit, highlighting the need for individualized risk assessment rather than universal diagnostic expansion.
To our knowledge, this study represents one of the few prospective randomized investigations conducted in a Turkish tertiary-care population that simultaneously compares screening strategies while evaluating the prognostic performance of individual OGTT time points. Unlike prior studies primarily focused on diagnostic prevalence, our analysis integrates ROC-based predictive modeling with clinically meaningful maternal and neonatal outcomes, providing a more comprehensive framework for risk-stratified GDM management. This dual diagnostic–prognostic approach may help refine screening policies in populations with intermediate metabolic risk profiles.
The strengths of this trial include its randomized design, large sample size, standardized screening protocols, and comprehensive assessment of maternal and neonatal outcomes. Nevertheless, several limitations should be acknowledged. The single-center design may limit generalizability, and long-term metabolic follow-up of mothers and offspring was not evaluated.
From a clinical and public health perspective, our findings suggest that individualized interpretation of OGTT profiles—particularly post-load glucose patterns—may offer greater value than expanding diagnostic thresholds alone. Future multicenter studies integrating OGTT-derived metrics with emerging metabolic and inflammatory biomarkers may further enhance personalized screening and management strategies for gestational diabetes mellitus.
Conclusion
While the one-step 75 g OGTT strategy may identify a numerically greater proportion of women with GDM, this does not necessarily translate into improved clinical outcomes. Individual OGTT parameters—particularly 2-hour post-load glucose values—appear to offer greater prognostic utility for complications and treatment requirements. Future research should focus on validating OGTT-based risk stratification models and integrating them with emerging biomarkers to optimize personalized management of GDM.
The reference list from the paper itself. Each links out to its DOI / PubMed record.
- 1American Diabetes Association Professional Practice Committee . Management of diabetes in pregnancy: Standards of Care in Diabetes—2026. Diabetes Care. (2026) 49:S 321–38. doi: 10.2337/dc 26-S 015, PMID: 41358885 PMC 12690181 · doi ↗ · pubmed ↗
- 2American College of Obstetricians and Gynecologists . ACOG Practice Bulletin No. 190: Gestational diabetes mellitus. Obstet Gynecol. (2018) 131:e 49–64. doi: 10.1097/AOG.0000000000002501, PMID: 29370047 · doi ↗ · pubmed ↗
- 3International Association of Diabetes and Pregnancy Study Groups Consensus Panel . Recommendations on the diagnosis and classification of hyperglycemia in pregnancy. Diabetes Care. (2010) 33:676–82. doi: 10.2337/dc 09-1848, PMID: 20190296 PMC 2827530 · doi ↗ · pubmed ↗
- 4HAPO Study Cooperative Research Group . Hyperglycemia and adverse pregnancy outcomes. N Engl J Med. (2008) 358:1991–2002. doi: 10.1056/NEJ Moa 0707943, PMID: 18463375 · doi ↗ · pubmed ↗
- 5Farrar D Simmonds M Bryant M Sheldon TA Tuffnell D Golder S . Hyperglycaemia and risk of adverse perinatal outcomes: systematic review and meta-analysis. BMJ. (2016) 354:i 4694. doi: 10.1136/jech-2016-208064.216, PMID: 27624087 PMC 5021824 · doi ↗ · pubmed ↗
- 6Kansu-Celik H Ozgu-Erdinc AS Kisa-Karakaya B Tasci Y Erkaya S . Fasting and post-prandial plasma glucose screening for gestational diabetes mellitus. East Mediterr Health J. (2019) 25:282–9. doi: 10.26719/emhj.18.038, PMID: 31210349 · doi ↗ · pubmed ↗
- 7Yeral MI Ozgu-Erdinc AS Uygur D Seckin KD Karsli MF Danisman AN . Prediction of gestational diabetes mellitus in the first trimester. Endocrine. (2014) 46:512–8. doi: 10.1007/s 12020-013-0111-z, PMID: 24282036 · doi ↗ · pubmed ↗
- 8Carpenter MW Coustan DR . Criteria for screening tests for gestational diabetes. Am J Obstet Gynecol. (1982) 144:768–73. doi: 10.1016/0002-9378(82)90349-0, PMID: 7148898 · doi ↗ · pubmed ↗