Reply to Chen: Methodological and analytical considerations in the study of H3-Dendra2 distribution
Anqi Li, Dong Tong, Benjamin Ohlstein, Zheng Guo

Abstract
Genes, proteins, chemicals, diseases, species, mutations and cell lines named across the full text — each resolved to its canonical identifier and authoritative record.
Click any figure to enlarge with its caption.
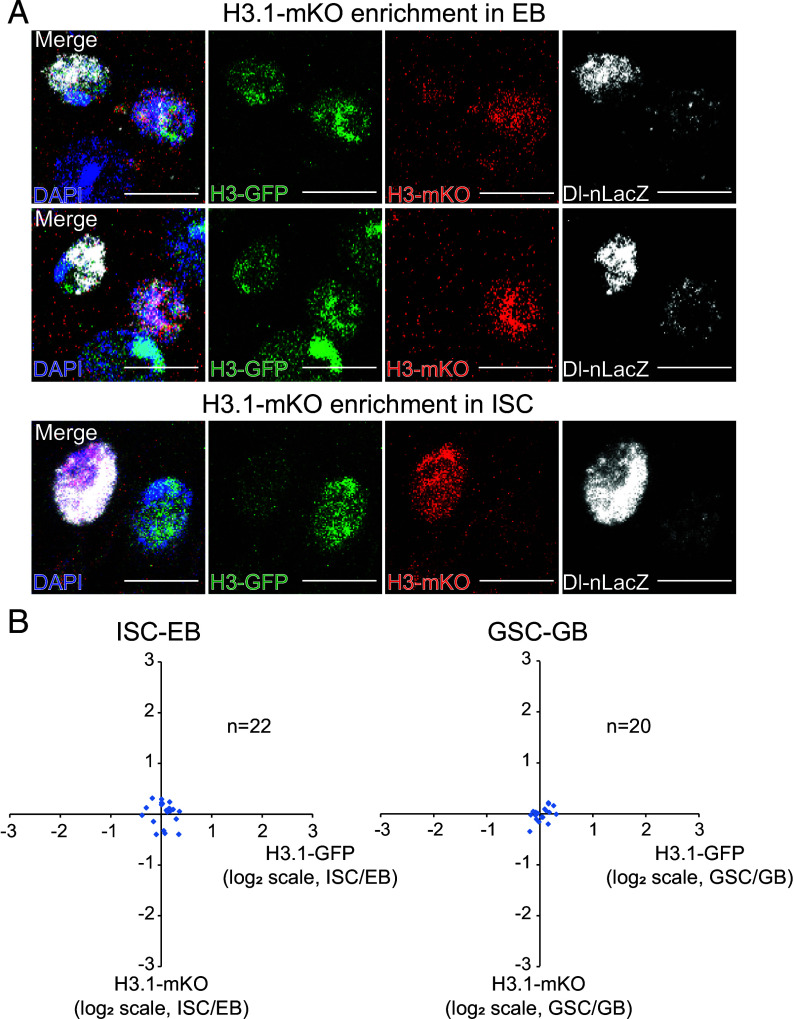 Figure 1
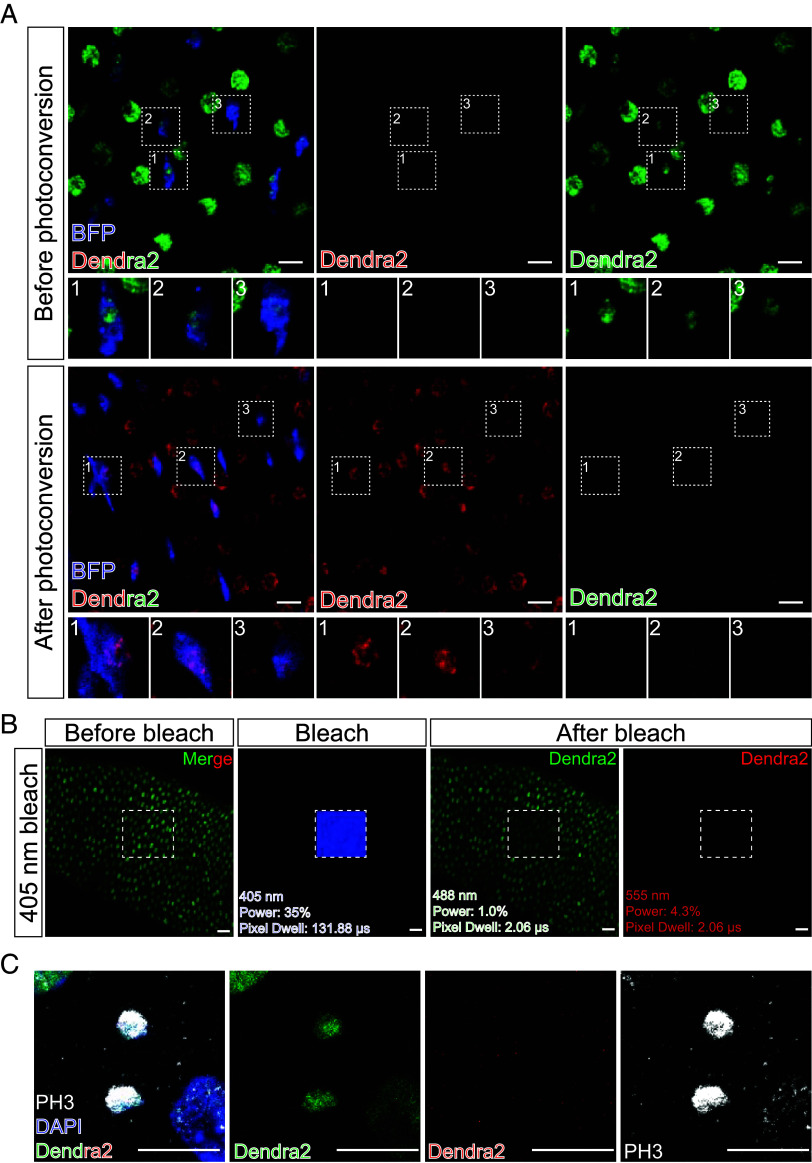 Figure 2
- —National Natural Science Foundation of China
- —National Natural Science Foundation of China
- —National Natural Science Foundation of China
- —National Natural Science Foundation of China
Peer Reviews
No public reviews on file for this paper yet. If you reviewed it on a platform where reviews are public (OpenReview, ICLR, NeurIPS, ICML), you can paste yours below so the community can read it here.
Videos
No videos yet. Explain this paper in a talk, walkthrough, or lecture? Add one.
Taxonomy
TopicsComplex Systems and Time Series Analysis · Statistical Distribution Estimation and Applications · Statistical Mechanics and Entropy
A recent comment by Chen (1) questions some conclusions of our study regarding histone segregation in Drosophila stem cells (2). Our detailed point-by-point response, which includes all experimental controls and data re-analyses, is publicly available (3). Herein, we address the central critiques regarding statistical interpretation, methodology, and technical rigor.
Chen reanalyzed our data obtained using the Gal4/Upstream Activation Sequence (UAS) Flp-out system, correctly noting a statistically significant deviation (P < 0.05) from a perfect 1:1 ratio for H3.1 in Intestinal Stem Cell-Enteroblast (ISC-EB) pairs. However, this metric alone cannot support her model of consistent “old” histone (H3.1-Green Fluorescent Protein (GFP)) enrichment in the stem cell (4). A significant P value merely rejects the null hypothesis of perfect symmetry; it does not specify the direction of bias. In fact, the mean H3.1-GFP fluorescence ratio (ISC:EB, log_2_ scale) in ISC-EB pairs is less than 0 (SI Appendix, figure S8B in ref. 2), which directly contradicts the specific prediction of increased signal in the ISC. Furthermore, our imaging data contradict the predicted unidirectional pattern. We observe H3.1-mKO could be enriched in either the ISC or the EB across different cell pairs (Fig. 1A). The variability likely arises because in the constitutive Gal4/UAS Flp-out system, recombination can occur independently in either the ISC or the EB of a pair, not necessarily reflecting a recent mitotic event. To unambiguously assess H3.1-GFP and H3.1-mKO segregation during division, we focused our analysis on mitotic ISC-EB pairs identified by phospho-histone H3 (PH3) staining (SI Appendix, figure S9 in ref. 2). The distribution from these dividing cells, visualized in 2D plots (Fig. 1B), clusters symmetrically around the origin, supporting a general lack of systematic asymmetry.
Chen raised specific concerns regarding photoconversion efficiency and potential imaging artifacts, all of which we have addressed through dedicated control experiments detailed in our full response (3). Regarding photoconversion efficiency, the variation in postconversion red-to-green fluorescence ratios stems from inherent cell-to-cell differences in total H3-Dendra2 protein expression, not from incomplete conversion [Fig. 2A and (3)]. Crucially, following our in vivo photoconversion protocol, the green-Dendra2 signal is reduced to background levels in every analyzed esg^+^ cell, confirming highly efficient conversion (Fig. 2A). To rule out the possibility of accidental photoswitching during confocal imaging, we performed sequential high-power laser illumination tests on fixed samples. We demonstrated that neither the 405 nm nor the 488 nm laser lines on our microscope, even at elevated power, could generate the red fluorescence of photoconverted Dendra2; they could only cause photobleaching [Fig. 2B and (3)]. This confirms that our standard image acquisition settings do not artifactually create the “old” histone signal. Finally, regarding potential spectral bleed-through, we demonstrate that the PH3 signal detected in the far-red channel (Alexa Fluor 647) is absent in the red Dendra2 channel under our imaging conditions, thereby confirming the quantitative accuracy of our segregation measurements (Fig. 2C). Together, these controls validate the integrity of our photoconversion-based tracking method.
In summary, data obtained using endogenously regulated histones, backed by stringent technical validation, robustly demonstrate symmetric segregation of old and new H3.1 histones in each of the several asymmetric stem cell divisions assayed in our study.
The reference list from the paper itself. Each links out to its DOI / PubMed record.
- 1X. Chen, Reassessing evidence for symmetric histone inheritance in Drosophila stem cells. Proc. Natl. Acad. Sci. U.S.A. 123, e 2531792123 (2026).41790926 10.1073/pnas.2531792123 · doi ↗ · pubmed ↗
- 2A. Li, D. Tong, B. Ohlstein, Z. Guo, Reevaluation of whether histones are asymmetrically segregated during asymmetric divisions of stem cells in Drosophila. Proc. Natl. Acad. Sci. U.S.A. 122, e 2513015122 (2025).41166424 10.1073/pnas.2513015122 PMC 12595462 · doi ↗ · pubmed ↗
- 3A. Li, D. Tong, B. Ohlstein, Z. Guo, Point-by-point reply to Xin Chen: Methodological and analytical considerations in the study of His 3-Dendra 2 distribution. Figshare [Preprint] (2026). 10.6084/m 9.figshare.31421489 (Accessed 31 January 2026).41790927 · doi ↗ · pubmed ↗
- 4E. H. Zion , Old and newly synthesized histones are asymmetrically distributed in Drosophila intestinal stem cell divisions. EMBO Rep. 24, e 56404 (2023).37255015 10.15252/embr.202256404 PMC 10328082 · doi ↗ · pubmed ↗