Trends and future projections of cancer prevalence in patients with cardiovascular admissions
Guia Ferrari Ardicini, Andrija Matetic, Evangelos Kontopantelis, Alaide Chieffo, Carmen Maria Moldovan, Zahra Raisi-Estabragh, Elad Asher, Christian Mallen, Mamas A Mamas

TL;DR
This study finds that cancer prevalence among patients with cardiovascular admissions is rising and predicts a significant increase by 2040, emphasizing the need for integrated care.
Contribution
The study provides the first predictive model of cancer prevalence trends in cardiovascular admissions over the next 20 years.
Findings
Cancer prevalence among cardiovascular inpatients increased from 4.8% in 2016 to 5.4% in 2020.
Predictive modeling estimates cancer prevalence will rise to 11.9% by 2040, with liver, breast, and renal cancers showing the fastest growth.
Haematological and lung cancers are projected to remain the most prevalent among cardiovascular inpatients.
Abstract
Patients with cancer have an increased risk of cardiovascular (CV) events, although there is limited data on future trends in cancer prevalence amongst patients with an acute cardiovascular admission. The aim of this study was to evaluate trends in cancer prevalence among CV admissions with an attempt to predict future cancer and CV co-morbidity over the next 20 years. The analysis included all hospital admissions with a primary CV diagnosis from the US National Inpatient Sample (NIS), from 2016 to 2020. The sample was stratified by specific CV admission and by cancer status and type. The chi-square and the Kruskal–Wallis tests were used to compare categorical and continuous data, respectively, across the years. A Poisson regression model was used to predict the prevalence of overall and specific cancer types through 2040, based on the 5-year baseline period. Among 4.79 million CV…
Genes, proteins, chemicals, diseases, species, mutations and cell lines named across the full text — each resolved to its canonical identifier and authoritative record.
Click any figure to enlarge with its caption.
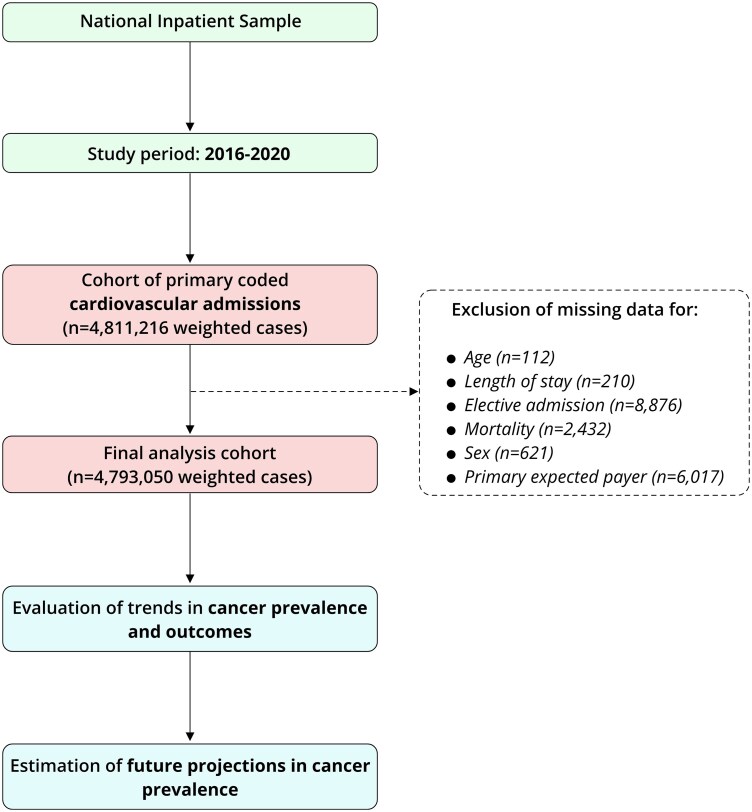 Figure 1
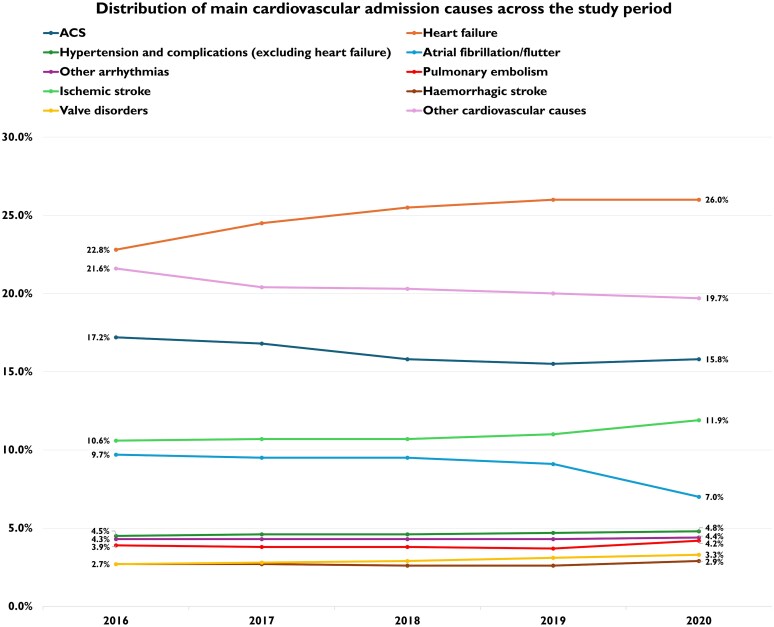 Figure 2
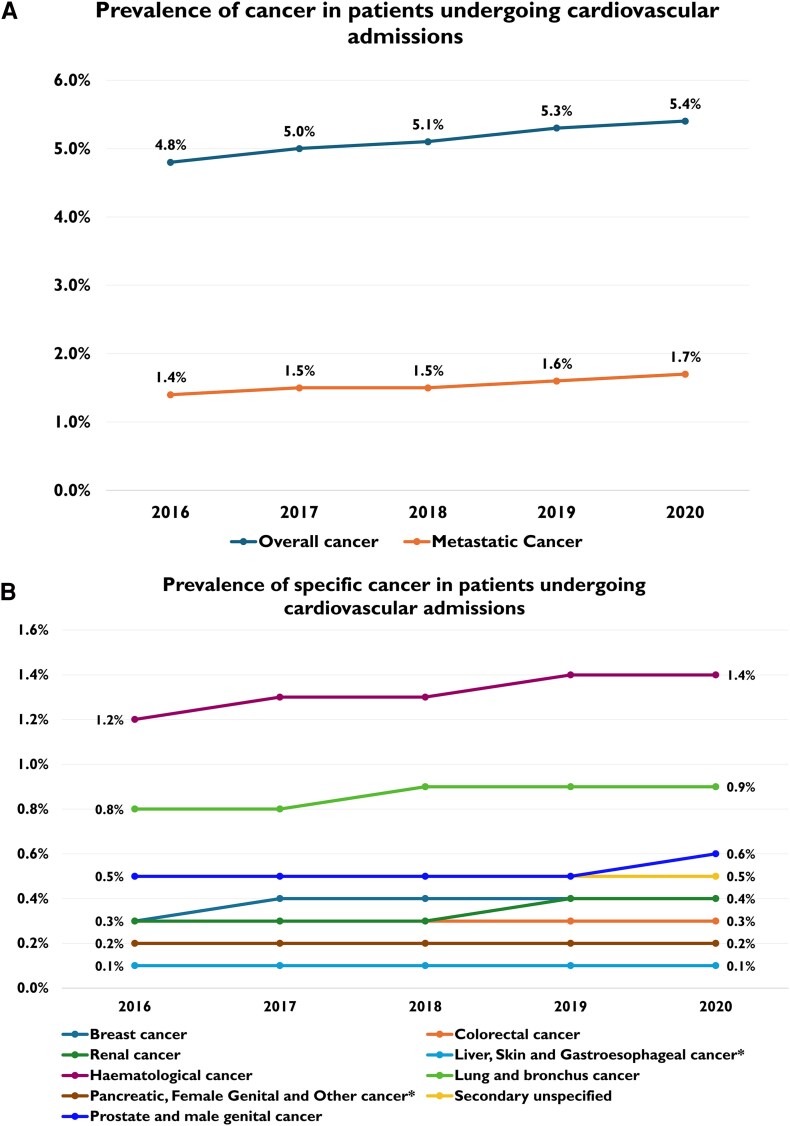 Figure 3
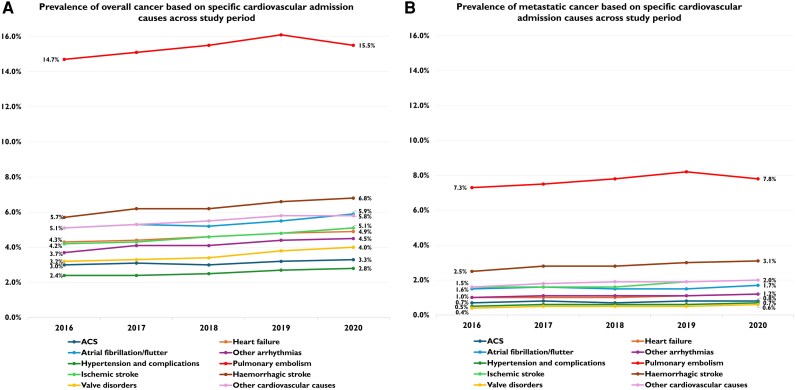 Figure 4
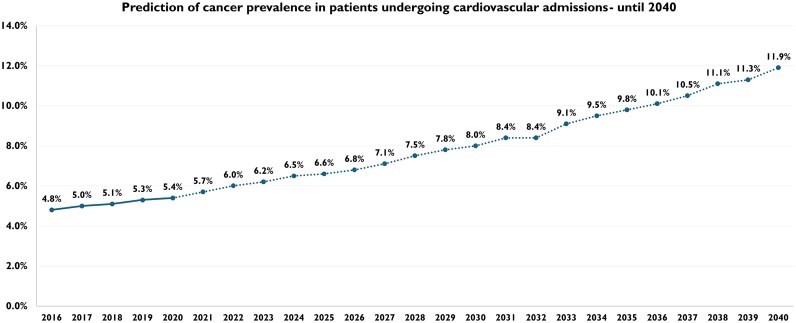 Figure 5
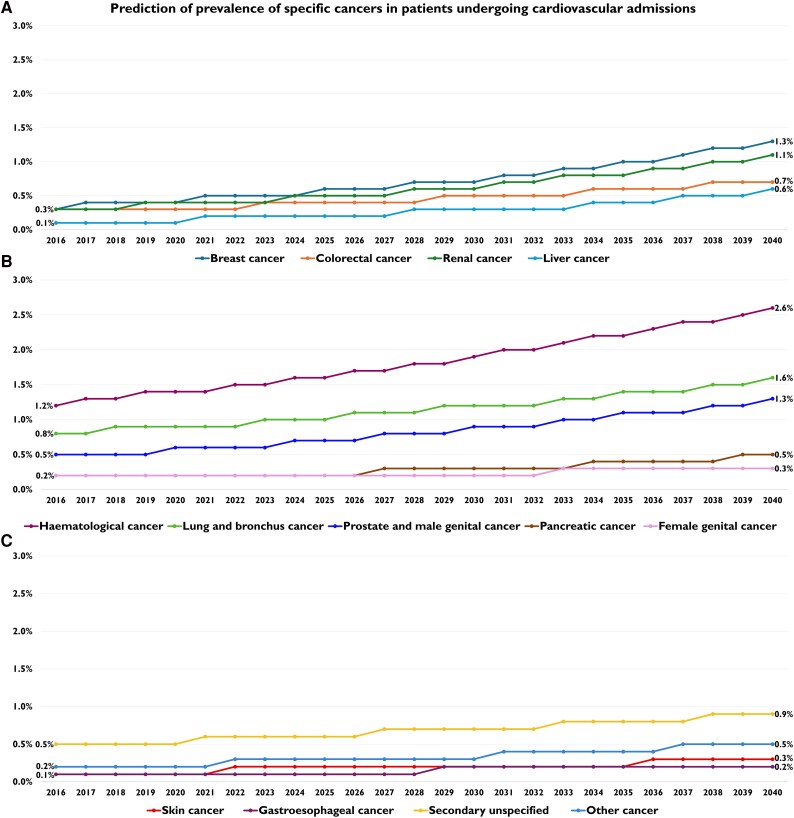 Figure 6
| Characteristics | Years |
| ||||
|---|---|---|---|---|---|---|
| 2016 | 2017 | 2018 | 2019 | 2020 | ||
| Primary CV admissions with cancer | 44 063 | 46 732 | 48 530 | 51 579 | 45 512 | <0.001 |
| Age (years), median (IQR) | 72 (64, 81) | 73 (64, 81) | 73 (64, 81) | 73 (65, 81) | 73 (64, 81) | <0.001 |
| Female sex, % | 44.0 | 43.7 | 43.7 | 43.1 | 43.3 | 0.03 |
| Weekend admission, % | 20.9 | 21.2 | 21.7 | 21.6 | 20.6 | <0.001 |
| Primary expected payer, % | <0.001 | |||||
| Medicare | 72.0 | 72.9 | 73.2 | 73.1 | 71.7 | |
| Medicaid | 6.8 | 6.8 | 6.5 | 6.6 | 6.8 | |
| Private Insurance | 17.9 | 17.2 | 16.9 | 16.7 | 17.5 | |
| Self-pay | 1.3 | 1.1 | 1.3 | 1.4 | 1.4 | |
| No charge | 0.1 | 0.1 | 0.1 | 0.1 | 0.1 | |
| Other | 2.0 | 1.9 | 2.0 | 2.2 | 2.6 | |
| Race, % | <0.001 | |||||
| White | 75.7 | 75.1 | 74.6 | 74.7 | 75.1 | |
| Black | 13.9 | 14.1 | 14.2 | 14.3 | 14.2 | |
| Hispanic | 5.8 | 6.0 | 6.5 | 6.1 | 5.9 | |
| Other | 4.6 | 4.8 | 4.7 | 4.9 | 4.8 | |
| Median Household Income (percentile), % | <0.001 | |||||
| 0–25th | 27.7 | 26.9 | 26.0 | 27.3 | 26.6 | |
| 26th–50th | 25.1 | 26.4 | 27.1 | 24.7 | 27.2 | |
| 51st–75th | 24.7 | 24.3 | 24.7 | 25.5 | 23.8 | |
| 76th–100th | 22.5 | 22.4 | 22.1 | 22.5 | 22.4 | |
| Homelessness, % | 0.2 | 0.2 | 0.3 | 0.3 | 0.3 | <0.001 |
| Cardiogenic shock, % | 1.5 | 1.8 | 1.9 | 2.0 | 2.3 | <0.001 |
| Cardiac arrest, % | 1.7 | 1.7 | 1.8 | 1.7 | 1.8 | 0.305 |
| Do-not-resuscitate, % | 16.9 | 18.0 | 18.8 | 19.0 | 20.0 | <0.001 |
| Comorbidities, % | ||||||
| Chronic pulmonary disease | 25.7 | 25.9 | 26.2 | 26.5 | 25.5 | 0.002 |
| Chronic pancreatitis | 0.2 | 0.3 | 0.2 | 0.2 | 0.3 | 0.017 |
| Peptic ulcer disease | 1.0 | 1.1 | 0.9 | 1.0 | 1.1 | 0.140 |
| Inflammatory bowel disease | 0.5 | 0.6 | 0.5 | 0.6 | 0.6 | 0.023 |
| Weight loss | 9.7 | 11.2 | 13.1 | 13.5 | 13.3 | <0.001 |
| HIV status | 0.3 | 0.3 | 0.3 | 0.3 | 0.3 | 0.801 |
| Neurologic disorders | 6.6 | 6.9 | 5.8 | 5.8 | 6.0 | <0.001 |
| Psychoses | 1.7 | 1.6 | 0.7 | 0.6 | 0.7 | <0.001 |
| Atrial fibrillation/flutter | 35.9 | 36.3 | 37.2 | 37.3 | 35.9 | <0.001 |
| Dyslipidaemia | 45.7 | 46.8 | 48.4 | 50.6 | 52.5 | <0.001 |
| Smoking | 10.4 | 10.2 | 10.4 | 10.5 | 10.6 | 0.345 |
| Previous stroke | 8.1 | 8.2 | 8.3 | 8.6 | 8.9 | <0.001 |
| Previous AMI, PCI or CABG | 21.0 | 20.9 | 20.9 | 20.9 | 20.0 | <0.001 |
| Anaemias | 37.6 | 37.6 | 37.7 | 37.6 | 38.4 | 0.040 |
| Fluid and electrolyte disorders | 32.9 | 33.8 | 35.6 | 36.3 | 39.6 | <0.001 |
| Hypertension | 74.0 | 76.2 | 77.2 | 78.5 | 78.8 | <0.001 |
| Peripheral artery disease | 11.0 | 11.5 | 10.6 | 10.9 | 11.3 | <0.001 |
| Diabetes mellitus | 18.2 | 13.0 | 12.2 | 11.6 | 11.0 | <0.001 |
| Coagulopathy | 12.5 | 12.9 | 12.6 | 12.5 | 14.1 | <0.001 |
| Depression | 10.9 | 11.0 | 11.3 | 11.5 | 11.7 | <0.001 |
| Dementia | 5.7 | 5.9 | 5.6 | 5.5 | 5.8 | 0.060 |
| Liver disease | 4.0 | 4.3 | 4.5 | 4.8 | 5.2 | <0.001 |
| Chronic renal failure | 27.4 | 28.6 | 29.6 | 31.1 | 31.2 | <0.001 |
| Valvular disease | 3.2 | 3.0 | 2.7 | 2.8 | 2.7 | <0.001 |
| Alcohol or drug abuse | 3.6 | 3.9 | 4.0 | 4.2 | 4.6 | <0.001 |
| Obesity | 12.1 | 13.1 | 13.5 | 13.7 | 15.2 | <0.001 |
| Hypothyroidism | 15.7 | 15.6 | 16.2 | 16.4 | 17.2 | <0.001 |
| Bed size of hospital, % | <0.001 | |||||
| Small | 18.0 | 17.1 | 18.2 | 19.1 | 19.5 | |
| Medium | 28.2 | 28.3 | 28.4 | 28.3 | 27.1 | |
| Large | 53.9 | 54.6 | 53.4 | 52.5 | 53.4 | |
| Location/teaching status of hospital, % | <0.001 | |||||
| Metropolitan non-teaching | 21.0 | 22.3 | 20.3 | 17.6 | 17.4 | |
| Metropolitan teaching | 70.1 | 69.6 | 71.8 | 74.6 | 74.9 | |
| Non-metropolitan hospital | 8.1 | 8.2 | 7.9 | 7.7 | 7.7 | |
| Hospitalization-related factors, median (IQR) | ||||||
| Length of stay (days) | 4 (2, 7) | 4 (2, 7) | 4 (2, 7) | 4 (2, 7) | 4 (2, 7) | 0.171 |
| Total charges (USD) | 36 508 (19,603, 72,130) | 38 550 (20,765, 76,048) | 41 030 (22,103, 81,139) | 43 754 (23,687, 86,778) | 47 900 (25,801, 95,408) | <0.001 |
| Prevalence | Years |
| ||||
|---|---|---|---|---|---|---|
| 2016 | 2017 | 2018 | 2019 | 2020 | ||
| Overall Cancer, % | 4.8 ( | 5.0 ( | 5.1 ( | 5.3 ( | 5.4 ( | <0.001 |
| Metastatic cancer, % | 1.4 ( | 1.5 ( | 1.5 ( | 1.6 ( | 1.7 ( | <0.001 |
| Specific cancer type, % | ||||||
| Breast cancer | 0.3 | 0.4 | 0.4 | 0.4 | 0.4 | <0.001 |
| Colorectal cancer | 0.3 | 0.3 | 0.3 | 0.3 | 0.3 | <0.001 |
| Renal cancer | 0.3 | 0.3 | 0.3 | 0.4 | 0.4 | <0.001 |
| Liver cancer | 0.1 | 0.1 | 0.1 | 0.1 | 0.1 | <0.001 |
| Haematological cancer | 1.2 | 1.3 | 1.3 | 1.4 | 1.4 | <0.001 |
| Lung and bronchus cancer | 0.8 | 0.8 | 0.9 | 0.9 | 0.9 | <0.001 |
| Prostate and male genital cancer | 0.5 | 0.5 | 0.5 | 0.5 | 0.6 | <0.001 |
| Pancreatic cancer | 0.2 | 0.2 | 0.2 | 0.2 | 0.2 | <0.001 |
| Female genital cancer | 0.2 | 0.2 | 0.2 | 0.2 | 0.2 | 0.008 |
| Skin cancer | 0.1 | 0.1 | 0.1 | 0.1 | 0.1 | <0.001 |
| Gastroesophageal cancer | 0.1 | 0.1 | 0.1 | 0.1 | 0.1 | <0.001 |
| Secondary unspecified | 0.5 | 0.5 | 0.5 | 0.5 | 0.5 | <0.001 |
| Other cancer | 0.2 | 0.2 | 0.2 | 0.2 | 0.2 | <0.001 |
| Prevalence | Years |
| |||||
|---|---|---|---|---|---|---|---|
| 2016 | 2017 | 2018 | 2019 | 2020 | |||
| Overall cancer, % | ACS | 3.0 | 3.1 | 3 | 3.2 | 3.3 | <0.001 |
| Heart failure | 4.3 | 4.4 | 4.6 | 4.8 | 4.9 | <0.001 | |
| Atrial fibrillation/flutter | 5.1 | 5.3 | 5.2 | 5.5 | 5.9 | <0.001 | |
| Other arrhythmias | 3.7 | 4.1 | 4.1 | 4.4 | 4.5 | <0.001 | |
| Hypertension and complications (excluding heart failure) | 2.4 | 2.4 | 2.5 | 2.7 | 2.8 | <0.001 | |
| Pulmonary embolism | 14.7 | 15.1 | 15.5 | 16.1 | 15.5 | <0.001 | |
| Ischemic stroke | 4.2 | 4.3 | 4.6 | 4.8 | 5.1 | <0.001 | |
| Haemorrhagic stroke | 5.7 | 6.2 | 6.2 | 6.6 | 6.8 | <0.001 | |
| Valve disorders | 3.2 | 3.3 | 3.4 | 3.8 | 4.0 | <0.001 | |
| Other cardiovascular causes | 5.1 | 5.3 | 5.5 | 5.8 | 5.8 | <0.001 | |
| Metastatic cancer, % | ACS | 0.7 | 0.8 | 0.7 | 0.8 | 0.8 | 0.020 |
| Heart failure | 1.0 | 1.0 | 1.0 | 1.1 | 1.2 | <0.001 | |
| Atrial fibrillation/flutter | 1.5 | 1.6 | 1.5 | 1.5 | 1.7 | 0.001 | |
| Other arrhythmias | 1.0 | 1.1 | 1.1 | 1.1 | 1.2 | 0.002 | |
| Hypertension and complications (excluding heart failure) | 0.5 | 0.6 | 0.6 | 0.6 | 0.7 | 0.001 | |
| Pulmonary embolism | 7.3 | 7.5 | 7.8 | 8.2 | 7.8 | <0.001 | |
| Ischemic stroke | 1.6 | 1.6 | 1.6 | 1.9 | 2.0 | <0.001 | |
| Haemorrhagic stroke | 2.5 | 2.8 | 2.8 | 3.0 | 3.1 | <0.001 | |
| Valve disorders | 0.4 | 0.5 | 0.5 | 0.5 | 0.6 | 0.008 | |
| Other cardiovascular causes | 1.6 | 1.8 | 1.9 | 1.9 | 2.0 | <0.001 | |
| Specific cancer type, % | |||||||
| Breast cancer | ACS | 0.2 | 0.2 | 0.2 | 0.2 | 0.2 | 0.213 |
| Heart failure | 0.3 | 0.3 | 0.4 | 0.4 | 0.4 | <0.001 | |
| Atrial fibrillation/flutter | 0.4 | 0.4 | 0.4 | 0.4 | 0.5 | 0.181 | |
| Other arrhythmias | 0.3 | 0.3 | 0.3 | 0.3 | 0.4 | <0.001 | |
| Hypertension and complications | 0.2 | 0.2 | 0.2 | 0.3 | 0.2 | 0.376 | |
| Pulmonary embolism | 1.3 | 1.4 | 1.3 | 1.4 | 1.3 | 0.865 | |
| Ischaemic stroke | 0.3 | 0.3 | 0.4 | 0.4 | 0.4 | <0.001 | |
| Haemorrhagic stroke | 0.3 | 0.3 | 0.4 | 0.4 | 0.4 | 0.234 | |
| Valve disorders | 0.2 | 0.2 | 0.3 | 0.3 | 0.3 | 0.012 | |
| Other cardiovascular causes | 0.3 | 0.3 | 0.4 | 0.4 | 0.4 | <0.001 | |
| Colorectal cancer | ACS | 0.2 | 0.2 | 0.2 | 0.2 | 0.2 | 0.002 |
| Heart failure | 0.2 | 0.2 | 0.2 | 0.2 | 0.3 | <0.001 | |
| Atrial fibrillation/flutter | 0.2 | 0.2 | 0.2 | 0.3 | 0.3 | 0.042 | |
| Other arrhythmias | 0.2 | 0.2 | 0.2 | 0.2 | 0.2 | 0.275 | |
| Hypertension and complications | 0.1 | 0.1 | 0.1 | 0.1 | 0.1 | 0.934 | |
| Pulmonary embolism | 1.1 | 1.1 | 1.1 | 1.2 | 1.2 | 0.671 | |
| Ischaemic stroke | 0.2 | 0.2 | 0.2 | 0.3 | 0.3 | 0.005 | |
| Haemorrhagic stroke | 0.1 | 0.2 | 0.2 | 0.2 | 0.2 | 0.248 | |
| Valve disorders | 0.1 | 0.1 | 0.2 | 0.2 | 0.2 | 0.154 | |
| Other Cardiovascular causes | 0.4 | 0.4 | 0.4 | 0.4 | 0.4 | 0.887 | |
| Renal cancer | ACS | 0.2 | 0.2 | 0.2 | 0.3 | 0.3 | 0.050 |
| Heart failure | 0.3 | 0.3 | 0.3 | 0.4 | 0.3 | <0.001 | |
| Atrial Fibrillation/flutter | 0.3 | 0.3 | 0.3 | 0.3 | 0.3 | 0.002 | |
| Other arrhythmias | 0.2 | 0.2 | 0.2 | 0.3 | 0.3 | 0.001 | |
| Hypertension and complications | 0.3 | 0.3 | 0.3 | 0.3 | 0.3 | 0.777 | |
| Pulmonary embolism | 0.7 | 0.8 | 0.8 | 0.8 | 0.9 | 0.310 | |
| Ischaemic stroke | 0.3 | 0.2 | 0.3 | 0.2 | 0.3 | 0.122 | |
| Haemorrhagic stroke | 0.3 | 0.3 | 0.3 | 0.4 | 0.3 | 0.232 | |
| Valve disorders | 0.2 | 0.2 | 0.3 | 0.3 | 0.3 | 0.036 | |
| Other cardiovascular causes | 0.3 | 0.4 | 0.4 | 0.4 | 0.4 | <0.001 | |
| Liver cancer | ACS | 0.1 | 0.1 | 0.1 | 0.1 | 0.1 | 0.536 |
| Heart failure | 0.1 | 0.1 | 0.1 | 0.1 | 0.1 | <0.001 | |
| Atrial fibrillation/flutter | 0.1 | 0.1 | 0.1 | 0.1 | 0.1 | 0.154 | |
| Other arrhythmias | 0.1 | 0.1 | 0.1 | 0.1 | 0.1 | 0.508 | |
| Hypertension and complications | 0.1 | 0.1 | 0.1 | 0.1 | 0.1 | 0.736 | |
| Pulmonary embolism | 0.3 | 0.3 | 0.3 | 0.4 | 0.3 | 0.219 | |
| Ischaemic stroke | 0.1 | 0.1 | 0.1 | 0.1 | 0.1 | 0.001 | |
| Haemorrhagic stroke | 0.2 | 0.2 | 0.2 | 0.1 | 0.2 | 0.995 | |
| Valve disorders | 0.1 | 0.1 | 0.1 | 0.1 | 0.1 | 0.819 | |
| Other cardiovascular causes | 0.2 | 0.2 | 0.2 | 0.2 | 0.2 | 0.015 | |
| Haematological cancer | ACS | 0.9 | 0.9 | 0.9 | 0.9 | 0.9 | 0.249 |
| Heart failure | 1.6 | 1.6 | 1.6 | 1.7 | 1.7 | 0.003 | |
| Atrial fibrillation/flutter | 1.4 | 1.4 | 1.4 | 1.5 | 1.6 | 0.017 | |
| Other arrhythmias | 1.1 | 1.1 | 1.2 | 1.2 | 1.3 | 0.037 | |
| Hypertension and complications | 0.7 | 0.7 | 0.7 | 0.8 | 0.8 | 0.584 | |
| Pulmonary embolism | 1.8 | 1.9 | 1.9 | 2.0 | 1.9 | 0.095 | |
| Ischaemic stroke | 0.9 | 0.9 | 1.0 | 1.0 | 1.0 | 0.007 | |
| Haemorrhagic stroke | 1.3 | 1.5 | 1.3 | 1.5 | 1.6 | 0.004 | |
| Valve disorders | 1.3 | 1.3 | 1.3 | 1.4 | 1.5 | 0.035 | |
| Other cardiovascular causes | 1.1 | 1.2 | 1.2 | 1.2 | 1.3 | <0.001 | |
| Lung cancer | ACS | 0.5 | 0.5 | 0.5 | 0.5 | 0.5 | 0.540 |
| Heart failure | 0.6 | 0.6 | 0.7 | 0.7 | 0.7 | <0.001 | |
| Atrial fibrillation/flutter | 1.2 | 1.2 | 1.2 | 1.2 | 1.3 | 0.062 | |
| Other arrhythmias | 0.6 | 0.6 | 0.6 | 0.6 | 0.6 | 0.605 | |
| Hypertension and complications | 0.2 | 0.2 | 0.2 | 0.2 | 0.2 | 0.167 | |
| Pulmonary embolism | 3.4 | 3.4 | 3.4 | 3.6 | 3.4 | 0.462 | |
| Ischaemic stroke | 0.8 | 0.8 | 0.9 | 0.9 | 1.0 | <0.001 | |
| Haemorrhagic stroke | 0.8 | 1.0 | 0.8 | 0.9 | 0.9 | 0.323 | |
| Valve disorders | 0.3 | 0.3 | 0.3 | 0.3 | 0.4 | 0.046 | |
| Other cardiovascular causes | 0.8 | 0.8 | 0.8 | 0.9 | 0.9 | 0.009 | |
| Prostate and male genital cancer | ACS | 0.4 | 0.4 | 0.4 | 0.5 | 0.5 | <0.001 |
| Heart failure | 0.5 | 0.5 | 0.5 | 0.5 | 0.5 | 0.137 | |
| Atrial fibrillation/flutter | 0.5 | 0.5 | 0.5 | 0.5 | 0.6 | 0.009 | |
| Other arrhythmias | 0.5 | 0.6 | 0.6 | 0.6 | 0.6 | 0.029 | |
| Hypertension and complications | 0.2 | 0.3 | 0.3 | 0.3 | 0.3 | 0.030 | |
| Pulmonary embolism | 0.8 | 0.9 | 0.8 | 0.9 | 0.9 | 0.184 | |
| Ischaemic stroke | 0.4 | 0.4 | 0.4 | 0.5 | 0.5 | 0.050 | |
| Haemorrhagic stroke | 0.5 | 0.5 | 0.6 | 0.5 | 0.7 | 0.018 | |
| Valve disorders | 0.5 | 0.5 | 0.5 | 0.6 | 0.6 | 0.160 | |
| Other cardiovascular causes | 0.5 | 0.5 | 0.5 | 0.6 | 0.6 | <0.001 | |
| Pancreatic cancer | ACS | 0.1 | 0.1 | 0.1 | 0.1 | 0.1 | 0.903 |
| Heart failure | 0.1 | 0.1 | 0.1 | 0.1 | 0.1 | 0.205 | |
| Atrial fibrillation/flutter | 0.1 | 0.1 | 0.1 | 0.1 | 0.1 | 0.796 | |
| Other arrhythmias | 0.1 | 0.1 | 0.1 | 0.1 | 0.1 | 0.668 | |
| Hypertension and complications | <0.1 | <0.1 | <0.1 | 0.1 | 0.1 | 0.140 | |
| Pulmonary embolism | 0.8 | 0.9 | 1.0 | 1.0 | 0.9 | 0.016 | |
| Ischaemic stroke | 0.2 | 0.2 | 0.3 | 0.3 | 0.3 | <0.001 | |
| Haemorrhagic stroke | 0.1 | 0.1 | 0.1 | 0.1 | 0.2 | 0.409 | |
| Valve disorders | <0.1 | <0.1 | <0.1 | 0.1 | <0.1 | 0.166 | |
| Other cardiovascular causes | 0.2 | 0.2 | 0.2 | 0.2 | 0.3 | 0.021 | |
| Female genital cancer | ACS | 0.1 | 0.1 | 0.1 | 0.1 | 0.1 | 0.756 |
| Heart failure | 0.1 | 0.1 | 0.1 | 0.1 | 0.1 | 0.194 | |
| Atrial fibrillation/flutter | 0.1 | 0.1 | 0.2 | 0.2 | 0.2 | 0.062 | |
| Other arrhythmias | 0.1 | 0.1 | 0.1 | 0.1 | 0.1 | 0.725 | |
| Hypertension and complications | 0.1 | 0.1 | 0.2 | 0.1 | 0.2 | 0.259 | |
| Pulmonary embolism | 1.1 | 1.1 | 1.0 | 1.1 | 1.1 | 0.711 | |
| Ischaemic stroke | 0.2 | 0.2 | 0.2 | 0.2 | 0.2 | 0.468 | |
| Haemorrhagic stroke | 0.1 | 0.1 | 0.1 | 0.1 | 0.2 | 0.544 | |
| Valve disorders | 0.1 | 0.1 | 0.1 | 0.1 | 0.1 | 0.616 | |
| Other cardiovascular causes | 0.3 | 0.3 | 0.3 | 0.3 | 0.3 | 0.428 | |
| Skin cancer | ACS | 0.1 | 0.1 | 0.1 | 0.1 | 0.1 | 0.873 |
| Heart failure | 0.1 | 0.1 | 0.1 | 0.1 | 0.1 | 0.243 | |
| Atrial fibrillation/flutter | 0.1 | 0.1 | 0.1 | 0.2 | 0.2 | 0.017 | |
| Other arrhythmias | 0.1 | 0.1 | 0.1 | 0.2 | 0.1 | 0.113 | |
| Hypertension and complications | 0.1 | 0.1 | 0.1 | 0.1 | 0.1 | 0.079 | |
| Pulmonary embolism | 0.2 | 0.2 | 0.3 | 0.2 | 0.3 | 0.007 | |
| Ischaemic stroke | 0.1 | 0.1 | 0.1 | 0.1 | 0.1 | 0.063 | |
| Haemorrhagic stroke | 0.3 | 0.2 | 0.3 | 0.3 | 0.3 | 0.071 | |
| Valve disorders | 0.1 | 0.1 | 0.1 | 0.1 | 0.1 | 0.786 | |
| Other cardiovascular causes | 0.1 | 0.1 | 0.1 | 0.1 | 0.1 | 0.113 | |
| Gastroesophageal cancer | ACS | 0.1 | 0.1 | <0.1 | 0.1 | 0.1 | 0.495 |
| Heart failure | 0.1 | 0.1 | 0.1 | 0.1 | 0.1 | 0.908 | |
| Atrial fibrillation/flutter | 0.1 | 0.1 | 0.1 | 0.1 | 0.2 | 0.321 | |
| Other arrhythmias | 0.1 | 0.1 | 0.1 | 0.1 | 0.1 | 0.023 | |
| Hypertension and complications | <0.1 | <0.1 | <0.1 | <0.1 | <0.1 | 0.720 | |
| Pulmonary embolism | 0.4 | 0.4 | 0.5 | 0.5 | 0.5 | 0.028 | |
| Ischaemic stroke | 0.1 | 0.1 | 0.1 | 0.1 | 0.1 | 0.006 | |
| Haemorrhagic stroke | 0.1 | <0.1 | <0.1 | 0.1 | 0.1 | 0.192 | |
| Valve disorders | <0.1 | <0.1 | <0.1 | <0.1 | <0.1 | 0.465 | |
| Other cardiovascular causes | 0.1 | 0.1 | 0.1 | 0.1 | 0.1 | 0.649 | |
| Secondary unspecified | ACS | 0.2 | 0.3 | 0.2 | 0.3 | 0.3 | 0.006 |
| Heart failure | 0.3 | 0.4 | 0.4 | 0.4 | 0.4 | <0.001 | |
| Atrial fibrillation/flutter | 0.4 | 0.5 | 0.4 | 0.5 | 0.5 | <0.001 | |
| Other arrhythmias | 0.3 | 0.4 | 0.4 | 0.4 | 0.3 | 0.071 | |
| Hypertension and complications | 0.2 | 0.2 | 0.2 | 0.2 | 0.3 | 0.036 | |
| Pulmonary embolism | 1.9 | 2.0 | 2.2 | 2.1 | 2.0 | <0.001 | |
| Ischaemic stroke | 0.5 | 0.6 | 0.5 | 0.5 | 0.6 | <0.001 | |
| Haemorrhagic stroke | 1.0 | 1.1 | 1.2 | 1.2 | 1.1 | 0.001 | |
| Valve disorders | 0.2 | 0.2 | 0.2 | 0.2 | 0.2 | 0.062 | |
| Other cardiovascular causes | 0.6 | 0.6 | 0.6 | 0.6 | 0.6 | <0.001 | |
| Other cancer | ACS | 0.1 | 0.1 | 0.1 | 0.1 | 0.1 | 0.090 |
| Heart failure | 0.1 | 0.1 | 0.1 | 0.1 | 0.1 | <0.001 | |
| Atrial fibrillation/flutter | 0.2 | 0.2 | 0.2 | 0.2 | 0.2 | 0.349 | |
| Other arrhythmias | 0.1 | 0.2 | 0.2 | 0.2 | 0.2 | 0.020 | |
| Hypertension and complications | 0.1 | 0.1 | 0.1 | 0.1 | 0.1 | 0.854 | |
| Pulmonary embolism | 0.8 | 0.9 | 0.9 | 0.8 | 0.8 | 0.121 | |
| Ischaemic stroke | 0.2 | 0.2 | 0.2 | 0.2 | 0.2 | 0.043 | |
| Haemorrhagic stroke | 0.7 | 0.7 | 0.6 | 0.7 | 0.7 | 0.686 | |
| Valve disorders | <0.1 | 0.1 | 0.1 | 0.1 | 0.1 | 0.003 | |
| Other cardiovascular causes | 0.3 | 0.3 | 0.3 | 0.3 | 0.3 | <0.001 | |
- —NIHR HeatlhTech Research Centre
- —Manchester British Heart Foundation
- —Centre for Research Excellence
Peer Reviews
No public reviews on file for this paper yet. If you reviewed it on a platform where reviews are public (OpenReview, ICLR, NeurIPS, ICML), you can paste yours below so the community can read it here.
Videos
No videos yet. Explain this paper in a talk, walkthrough, or lecture? Add one.
Taxonomy
TopicsChemotherapy-induced cardiotoxicity and mitigation · Cardiac tumors and thrombi · Cancer, Lipids, and Metabolism
Introduction
The overlap between cardiovascular (CV) disease and cancer poses a significant challenge to healthcare systems globally. CV disease and cancer are leading drivers of mortality worldwide,^1^ with a strong bidirectional relationship. Both CV disease and cancer potentially increase the risk of each other through shared risk factors, chronic disease burden, and common pathophysiological pathways.^2^ With innovative therapeutic options available, mortality in patients diagnosed with cancer has declined, yielding an increased number of cancer survivors,^3^ who are at increased risk of CV morbidity and mortality. Among cancer survivors, CV disease is the major cause of non-cancer death^4^ with CV mortality overtaking cancer mortality in the longer term.^5^
How this growing burden of CV disease in patients with cancer will evolve over the next few decades is unclear. Whilst the prevalence of cancer in patients with a primary CV diagnosis has been estimated to be in the order of ∼4.5%, with haematological malignancy and lung cancer being the most prevalent,^6,7^ there is a significant literature gap on their future projections. Understanding cancer prevalence and its trends among patients with CVD is therefore essential for proper healthcare planning, education and policy development.
Therefore, this study aimed to determine the baseline prevalence of cancer and its specific types in patients with acute cardiovascular admissions. Importantly, this analysis aimed to determine the future predictions and trends in cancer prevalences within this patient population over the next 20 years. Finally, we aimed to determine the association of cancer prevalence, patient characteristics and future trends across different specific cardiovascular admission causes.
Methods
Ethical and reporting considerations
This study was conducted using publicly available data from the National Inpatient Sample (NIS) database, which is de-identified and anonymized, ensuring compliance with the Health Insurance Portability and Accountability Act (HIPAA). This provides exemption from approval by institutional boards or ethics committees. Moreover, the manuscript adheres to the Strengthening The Reporting of Observational Studies in Epidemiology (STROBE) guidelines for reporting observational studies (see Supplementary material online, Table S1).
Setting, participants and data sources
The NIS database was developed by the Agency for Healthcare Research and Quality (AHRQ) under the Healthcare Cost and Utilization Project (HCUP).^8^ It generates nationally representative estimates of inpatient utilization, access, charges, quality, and outcomes in the United States (US).^8^ The NIS contains anonymized discharge data from more than seven million hospitalizations yearly, representing the largest publicly available all-payer inpatient database in the US.
The analysis included all adult cases (≥18 years) with any primary cardiovascular (CV) admission, between January 2016 and December 2020, defined using the International Classification of Diseases—10th Edition (ICD-10) [Supplementary material online, Table S1]. The CV admissions were further categorized to focus on the most clinically relevant diagnoses that can be reliably ascertained from clinical coding systems into acute coronary syndrome (ACS), heart failure (HF), atrial fibrillation/flutter, other arrhythmias, hypertension and its complications (excluding heart failure), pulmonary embolism (PE), ischaemic stroke, haemorrhagic stroke, valve disorders, and other CV causes. Furthermore, the study sample was stratified by cancer status and further categorized by primary cancer site (based on ICD-10 codes): Breast cancer, colorectal cancer, renal/urinary cancer, liver cancer, haematological cancer, lung/bronchus cancer, prostate and male genital cancer, pancreatic cancer, female genital cancer, skin cancer, and gastroesophageal cancer. Cancer cases were also stratified by metastatic status. It should be noted that the NIS does not contain clinical information to differentiate active cancer from cancer in remission. In this study, cancer status was defined using ICD-10 C-codes, which reflect current or recent malignancy. Z-codes (personal history of malignancy) were not included.
Analyses were weighted by the discharge weights provided, following HCUP recommendations.^8^ The analysis was performed after exclusion of cases due to missing data, which accounted for 0.38% (n = 18 268) [Figure 1].
Flow diagram.
Variables—study outcomes
First, this study aimed to determine the baseline prevalence of overall and specific cancers in patients with a CV admission. Second, the analysis included an assessment of demographic and clinical characteristics of cancer patients across the study period. Finally, using the baseline 5-year period, we aimed to establish future projections in the prevalence of all cause cancer and specific cancer types among different CV admissions over the next 20 years.
Statistical analysis
The statistical analyses were performed using Statistical Package for the Social Sciences (SPSS, version 29; IBM Corp, Armonk, NY) and Stata (version MP17, StataCorp, College Station, TX). Descriptive statistics were used to summarize patient demographic and clinical characteristics. Data were expressed as frequencies and percentages for categorical data and median (interquartile range) for continuous data. The Chi-squared test was used to compare categorical data across the years, whilst the Kruskal–Wallis test was used to compare continuous data. The Mantel–Haenszel test was used to assess linear temporal trends in the prevalence of cancer among CV admissions and in the prevalence of specific CV admissions between 2016 and 2020.
To estimate the future burden of cancer among patients hospitalized with a primary CV diagnosis, a predictive model was created. The models were based on data from 2016 to 2020. Predictions were made up to the year 2040. Different cancer subtypes were analysed separately, allowing independent estimation of trajectories for each malignancy. For each cancer group, a Poisson regression model was fitted with calendar year as a continuous predictor. Moreover, an exposure offset was incorporated into each model, to ensure relative incidence rates over time, instead of raw counts. Goodness-of-fit of the model was evaluated through the log-likelihood and pseudo R^2^, and standard errors were derived with the delta method. The projections were summarized using model-based incidence rate ratios (IRR) to describe relative temporal trends, along with 95% confidence intervals, using the delta method, which provides valid uncertainty quantification under standard maximum-likelihood theory. Statistical significance was defined by a P-value of <0.05.
Results
Baseline patient characteristics of cancer patients with a primary CV admission
The median age of the cohort ranged from 72 years in 2016 (IQR: 64, 81) to 73 years in 2020 (IQR: 64, 81), and there were fewer female patients within the cohort (44.0% in 2016 and 43.3% in 2020). Most patients had Caucasian ethnicity (75.7% in 2016 and 75.1% in 2020) [Table 1].
Most patients had prevalent hypertension, with a statistically significant increase from 74.0% in 2016 to 78.8% in 2020 (P < 0.001). Dyslipidaemia was the second most prevalent, with a rise from 45.7% in 2016 to 52.5% in 2020 (P < 0.001). Prevalence of anaemias was also high, with a significant variation in frequency across the study period (37.6% in 2016 to 38.4% in 2020; P = 0.040). Atrial fibrillation/flutter remained relatively constant over time, with a prevalence of 35.9% in 2016, reaching a peak of 37.3% in 2019, and then going back to 35.9% in 2020 (P < 0.001). Chronic renal failure increased from 27.4% in 2016 to 31.2% in 2020 (P < 0.001), although some comorbidities, such as diabetes, exhibited a downward trend in prevalence over time (18.2% in 2016 and 11.0% in 2020; P < 0.001) [Table 1].
Distribution of specific cardiovascular admissions in the sample
Considering the total study population (both patients with cancer and without cancer), the most prevalent CV admission across the study period was HF, with a significant increase from 2016 (22.8%) to 2020 (26.0%), followed by ACS (17.2% in 2016, 15.8% in 2020) and ischaemic stroke (10.6% in 2016, 11.9% in 2020). Less frequent were atrial fibrillation/flutter (9.7% in 2016, 7.0% in 2020), other arrhythmias (4.3% in 2016, 4.4% in 2020), hypertension and complications (4.5% in 2016, 4.8% in 2020), PE (3.9% in 2016, 4.2% in 2020), haemorrhagic stroke (2.7% in 2016, 3.3% in 2020) and valve disorders (2.7% in 2016, 3.3% in 2020). ACS and atrial fibrillation/flutter both showed a decreasing trend across the 5-year period [Supplementary material online, Table S4 and Figure 2].
Distribution of main cardiovascular admission causes across the study period.
The prevalence of cancer among patients with acute cardiovascular admissions (2016–2020)
The study included 4 793 050 patients hospitalized with a primary CV diagnosis, between 2016 and 2020. The prevalence of cancer increased significantly from 4.8% in 2016 to 5.4% in 2020 (P < 0.001) [Table 2 and Figure 3A]. Among patients admitted with an acute CV event, 1.4% had metastatic cancer in 2016, increasing to 1.7% in 2020 (P < 0.001) [Table 2, Figure 3A and Supplementary material online, Table S2]. In relative terms, the proportion of metastatic cases among all cancers increased from 31.1% in 2016 to 32.1% in 2020 [Supplementary material online, Table S3].
*( A ) Prevalence of overall cancer and metastatic cancer in patients undergoing cardiovascular admissions across the study period. (B) Prevalence of specific cancer in patients undergoing cardiovascular admissions across the study period. Cancer subtypes with equal prevalence trajectories are represented by a single line.
In general, most cancer types showed a statistically significant linear increase in prevalence across the duration of the study (P < 0.001), although the magnitude of change in prevalence and corresponding clinical significance varied across cancer types [Table 2 and Figure 3B]. Trends in both relative and absolute proportions of metastatic and non-metastatic cancers across cancer types are also reported [Supplementary material online, Tables S2 and S3]. Haematological cancer was the most prevalent across all years, ranging from 1.2% in 2016 to 1.4% in 2020.
Lung cancer was the second most prevalent, growing from 0.8% in 2016 to 0.9% in 2020. Prevalence of metastatic disease among lung cancer patients increased significantly from 0.3% in 2016 to 0.4% in 2020, with a relative proportion spanning from 39.1% in 2016 to 41.4% in 2020 (P = 0.023) [Supplementary material online, Tables S2 and S3].
Regarding breast cancer, its prevalence rose from 0.3% in 2016 to 0.4% in 2020. Trends in the prevalence of breast cancer patients with metastatic disease showed non-significant variations across the study period [Supplementary material online, Tables S2 and S3].
Even though the prevalence of colorectal cancer was substantial among patients undergoing CV admission, it remained stable over the study period, with a rate of 0.3%, while there was no significant change in colorectal cancer’s metastatic disease burden [Supplementary material online, Tables S2 and S3].
A growth in prostate/male genital cancer was observed, from 0.5% in 2016 to 0.6% in 2040, with metastatic cancer cases rising from 0.1% in 2016 to 0.2% in 2020, and their relative proportions growing from 29.2% in 2016 to 31.4% in 2020 (P = 0.108) [Supplementary material online, Tables S2 and S3].
Renal/urinary tract cancer showed a modest growth in prevalence from 0.3% in 2016 to 0.4% in 2020. Burden of metastatic cancer was steady at 0.1% during the study period, with a statistically non-significant increase in relative proportion from 25.9% in 2016 to 26.4% in 2020 (P = 0.828) [Supplementary material online, Tables S2 and S3].
The prevalence of pancreatic and female genital cancers remained stable between 2016 and 2020, both at approximately 0.2%. Prevalence of metastatic cancer among pancreatic cancer patients was 0.1% across the 5-years period, and a larger share of pancreatic cancer cases were metastatic compared to non-metastatic, ranging from 58.7% in 2016 to 60.9% in 2020 (P = 0.094). Metastatic burden among female genital cancer patients was also steady at 0.1%, with a significant increase in relative proportions, from 37.8% in 2016 to 42.5% in 2020 (P = 0.023) [Supplementary material online, Tables S2 and S3].
Liver, skin, and gastroesophageal cancers not only were less prevalent but also showed less notable temporal changes across the study period. Among these, the most relevant change in prevalence of metastatic disease can be observed for skin cancer, whose burden was constant at <0.1% in absolute terms, with a steady rise in prevalence of metastatic cases compared to non-metastatic cases, from 20.8% in 2016 to 26.5% in 2020 (P = 0.001) [Supplementary material online, Tables S2 and S3].
Prevalence of cancer across specific cardiovascular admissions
The analysis of overall and specific cancer prevalence by CV admission type, as detailed below, is based on data reported in Table 3, Figure 4A and B and Supplementary material online, Figures S3–S15.
Prevalence of overall and metastatic cancer based on specific cardiovascular admission causes across study period.
Overall cancer
In general, the prevalence of overall cancer showed significant variations between 2016 and 2020 for all CV admissions analysed (P < 0.001), and its prevalence increased across all CV admission types. Likewise, the proportion of cancers with metastatic disease was observed to increase across all CV admissions from 2016 to 2020 (P < 0.05). Overall, cancer was most prevalent in patients with PE, significantly increasing from 14.7% in 2016 to 15.5% in 2020. Cancer was also very prevalent in patients presenting with haemorrhagic stroke, with a steady increase from 5.7% in 2016 to 6.8% in 2020. Atrial Fibrillation/flutter was the third most common CV admission in cancer patients; in this case, the rate of cancer patients increased from 5.1% in 2016 to 5.9% in 2020. Similarly, cancer prevalence also showed an increasing trend in other cardiovascular admissions, both in overall and metastatic cases, as shown in Table 3 and Figure 4A and B.
Similar prevalence analysis was also performed for each cancer type among specific cardiovascular admissions across the study period [Table 3 and Supplementary material online, Figures S3–S15]. Haematological cancer was the most common across all CV admissions, except for PE, for which lung cancer showed the highest prevalence. Moreover, haematological cancer showed the most significant increase in prevalence in patients hospitalized for HF, atrial fibrillation/flutter, ischemic and haemorrhagic stroke, and valve disorders. Lung cancer showed a notable increase in frequency in patients with HF, ischaemic stroke, and valve disorders. Other relevant findings are shown in Table 3 and Supplementary material online, Figures S3–S15.
Future projections through 2040
When looking at the trends in the following 20 years, until 2040, the prevalence of cancer in CV admissions is expected to nearly triple by 2040, starting from a rate of 4.8% in 2016 and reaching an estimated 11.9% in 2040 (2.48-fold increase from baseline) [Supplementary material online, Table S5 and Figure 5]. The modelled projections show consistent linear increases across all major cancer types [Supplementary material online, Table S5, Supplementary material online, Tables S6A-D, and Figure 6A–C, Supplementary material online, Figures S1A-F and S2A-G]. While haematological and lung cancers are expected to remain the cancers with the highest total burden, other malignancies show faster growth trajectories, with bigger relative growth. Liver cancer showed the steepest annual increase in prevalence, from 0.1% in 2016 to 0.6% in 2040 (IRR 1.069, 95% CI 1.049–1.089; P < 0.001) [Supplementary material online, Figure S1D], followed by breast cancer, which is expected to increase from 0.3% in 2016 to 1.3% in 2040 (IRR 1.056, 95% CI 1.045–1.068; P < 0.001) [Supplementary material online, Figure S1A], and renal cancer, which showed a future increasing trend from 0.3% in 2016 to 1.1% in 2040 (IRR 1.055, 95% CI 1.043–1.067; P < 0.001) [Supplementary material online, Figure S1C]. Pancreatic and colorectal cancers are also expected to more than double in prevalence, with the former that is expected to rise from 0.2% in 2016 to 0.5% in 2040 (IRR 1.049, 95% CI 1.032–1.066; P < 0.001) [Supplementary material online, Figure S2B], while the latter is projected to rise from 0.3% in 2016 to 0.7% in 2040 (IRR 1.044, 95% CI 1.031–1.056; P < 0.001) [Supplementary material online, Figure S1B]. Skin cancer shows similar trends, tripling from a rate of 0.1% in 2016 to 0.3% in 2040 (IRR 1.038, 95% CI 1.019–1.057; P < 0.001) [Supplementary material online, Figure S2D]. Prostate and male genital cancer are predicted to show a quite linear and constant increase across the years, from 0.5% in 2016 to 1.3% in 2040 (IRR 1.042, 95% CI 1.033–1.052; P < 0.001) [Supplementary material online, Figure S2A]. Similarly, haematological cancer is projected to rise from 1.2% in 2016 to 2.6% in 2040 (IRR 1.032, 95% CI 1.026–1.037; P < 0.001) [Supplementary material online, Figure S1E]. Lung and bronchus cancer is projected to double from 0.8% in 2016 to 1.6% in 2040 (IRR 1.028, 95% CI 1.021–1.035; P < 0.001) [Supplementary material online, Figure S1F]. Comparable findings are evident in case of gastroesophageal cancer, with a growth rate ranging from 0.1% in 2016, expected to rise to 0.2% in 2040 (IRR 1.038, 95% CI 1.017–1.060; P < 0.001) [Supplementary material online, Figure S2E]. Female genital cancer has a less relevant rate of increase until 2040, increasing from 0.2% in 2016 to 0.3% in 2040 (IRR 1.017, 95% CI 1.015–1.032; P = 0.031) [Supplementary material online, Figure S2C]. In terms of absolute changes, haematological cancer is expected to remain the most common across the years and is predicted to show the highest absolute increase (+1.4% absolute increase), followed by breast cancer (+1.0% absolute increase) and lung and bronchus cancer (+0.8% absolute increase). These represent the cancers with a highest total burden.
Prediction of cancer prevalence in patients undergoing cardiovascular admissions—until 2040. The solid line represents baseline data, while the dotted line represents projected data.
Prediction of prevalence of specific cancers in patients undergoing cardiovascular admissions—until 2040. (A) Breast, colorectal, renal, and liver cancer; (B) Haematological, lung, prostate and male genital, pancreatic, and female genital cancer; (C) Skin, gastroesophageal, secondary unspecified, and other cancers.
Discussion
This nationwide analysis of US hospitalized patients with primary CV diagnosis and co-existing cancer adds important data on contemporary status and future projections of cancer in this high-risk population. The study revealed a steady rise in cancer prevalence in the period from 2016 to 2020. Consistently, the present projections indicate a continuous increase in the cancer prevalence among CV inpatients, meaning that by 2040, roughly one out of eight patients admitted for a CV condition may also carry a diagnosis of concurrent cancer. Importantly, the magnitude of these projections should be interpreted with caution and viewed as exploratory and illustrative of potential population-level trajectories. These findings emphasize a growing co-existence of cancer and CV disease. This is in line with the improvement in both CVD and cancer treatment, leading to prolonged survival in both cohorts, and with the presence of a rising ageing population on a global scale,^9^ which greatly contributes to the growing prevalence of multimorbidity,^10^ and represents a major risk factor for many CV and cancer pathologies.^11,12^ Consistent with the population-level trends observed in our study, Global Burden of Disease (GBD) forecasts indicate that the absolute (crude) burden of disability-adjusted life years (DALYs) attributable to CVD and cancer has increased from 1990 to 2021, and is projected to rise further by 2050, largely driven by population ageing and growth. In contrast, age-standardized DALY rates attributable to these conditions have declined and are expected to keep decreasing by 2050, which is reflective of improved preventive and treatment measures.^13^
To the best of our knowledge, this is the first national analysis of future cancer projections in patients admitted with an acute CV event. Among the few published studies on this topic, Okura et al. analysed a local Japanese cancer registry and estimated a 23.4% increase in cancer patients with co-existing CV disease by 2039, with a growth rate (1.23) outpacing the cancer-only population (1.18). Atrial fibrillation was predicted to be the most common CV comorbidity, with a more pronounced growth in females, though absolute numbers remained higher in males.^14^
Several mechanisms may explain the rising cancer prevalence among patients with CV disease. First, a shared risk hypothesis suggests that increasing rates of common risk factors and comorbidities contribute to both cancer and CVD. These include smoking, obesity, type 2 diabetes, hypertension, metabolic syndrome, sedentary lifestyle, and poor diet. Obesity and diabetes are strongly linked to several cancer types and are well-established drivers of CVD, including coronary artery disease, stroke, and HF.^15^ The World Obesity Atlas (2025) projects that about three billion adults will be overweight by 2030, with 1.1 billion classified as obese and more prevalent among women (643 million).^16^ The prevalence of diabetes is also predicted to rise to 43% and affect approximately 1 in 8 adults worldwide (∼853 million) by 2050.^17^ Smoking is causally implicated in the pathogenesis of several cancers, especially lung cancer, whose risk is 15- to 30-fold higher in smokers,^18^ and is also linked to an elevated risk of CVD.^19^ While smoking rates are projected to decline by 25.9% in males and 30.0% in females by 2050, total numbers will remain substantial.^20^ According to GBD forecasts, high systolic blood pressure, dietary risks and air pollution are projected to be the leading risk factors driving the shared burden of CVD and cancer in 2050.^13^ Inflammation underlies many of these risks, promoting both tumorigenesis and atherogenesis. Chronic inflammation supports tumour growth by encouraging cellular transformation, reactive oxygen, tissue damage, and angiogenesis dysfunction.^21^ Pro-inflammatory cytokines like IL-6, TNF-α and IL-1β activate pathways that promote tumour proliferation, angiogenesis, and apoptosis resistance.^22^ Similarly, inflammation promotes atherogenesis through immune cell recruitment, endothelial dysfunction, and atherosclerosis, promoting plaque growth and disruption.^23^
Second, increased survival with better treatment modalities, as well as the rising issue of cardiotoxicity could greatly contribute to increased prevalence. It is well established that many cancer drugs are associated with an increased risk of CV disease, such as left ventricular dysfunction, HF, hypertension, myocardial ischaemia, and rhythm abnormalities.^24^ A US-based study predicts an increase in the proportion of cancer survivors, from an estimated 18.1 million in 2022 to 26 million by 2040.^25^ Notably, recent studies confirm there is an overall ∼42% higher risk of CVD in cancer survivors than people without cancer, and that survivors of breast, lung, and haematological cancers experience some of the highest rates of CV adverse events.^26^ Observational studies confirm that cancer survivors are at increased risk of hospitalization (HR 1.11) and/or death from CVD (HR 1.31) compared to individuals without a history of cancer, especially survivors of lung cancer, multiple myeloma, and non-Hodgkin lymphoma and breast cancer.^27^ Another study highlighted a 55% higher risk of mortality from CVD in cancer survivors compared to the general population.^4^
Third, another important factor contributing to the increasing prevalence of cancer in the general population, and consequently among those with CV admissions, is the continuous trend towards population ageing. This demographic shift is expected to significantly raise cancer incidence in the next decades. This is supported by the International Agency for Research on Cancer (IARC), which estimated a projected rise of new cancer cases from 19.3 million in 2020 to 28.4 million in 2040, which corresponds to a 47% increase.^28^ Even more recent estimates suggest an increase to over 35 million annual cases by 2050, corresponding to a 77% increase from the 20 million cases in 2022.^29^ Projections suggest that breast, prostate, lung, and colorectal cancers will remain the most frequent, with female breast cancer predicted to rise by about 52% by 2050 due to demographic changes.^30^ These trends align with our findings, as higher cancer prevalence will be associated with increasing CV complications.
When looking at the specific cancers, liver, breast, renal, and pancreatic cancer showed the highest relative increase in prevalence. This trend is supported by epidemiological projections indicating a significant rise in both liver and pancreatic cancers worldwide by 2040. In particular, liver cancer, which was the one with the overall steepest relative projected increase in patients with CV admissions, is expected to surge dramatically in the general population, with a predicted 55% increase in incidence from 2020 to 2040.^31^
In terms of absolute increase and prevalence, haematological, breast, prostate, and lung cancers are predicted to remain the most common until 2040. Haematological cancer was the most prevalent among patients admitted with CVD. It was especially frequent in patients with PE, HF, and atrial fibrillation, likely due to shared pathogenesis and treatment-related cardiotoxicity.^32^ Breast cancer also had one of the highest predicted absolute and relative rise in prevalence among CV admissions, possibly related to cardiotoxic effects of therapies like anthracyclines and HER2-targeted agents, known to cause left ventricular dysfunction and HF, particularly when combined with anthracyclines.^33^ In addition, radiation therapy to the thorax can also affect the heart, increasing the risk of CV complications.^34^ Lung cancer also demonstrated a significant projected absolute rise and prevalence, remaining the most frequent malignancy among patients with PE, which is consistent with the literature.^35^ Among cardiotoxic treatments, immune checkpoint inhibitors have been linked to CV adverse events including myocarditis, pericardial diseases, and arrhythmias,^36^ while targeted therapies such as EGFR tyrosine kinase inhibitors, used to treat non-small-cell lung cancer, have been associated with systolic dysfunction and HF.^37^
It is important to keep in mind that our projections were derived using a Poisson Regression approach that models observed temporal trends in cancer prevalence among patients with cardiovascular disease, without explicitly incorporating individual-level determinants. This approach is well-suited for prediction when trends are stable and show no statistical evidence of non-linearity, as observed in our data. Accordingly, the projections reflect extrapolations of observed temporal trends rather than assumptions regarding future changes in the underlying determinants of cancer and CVD prevalence. Nonetheless, future deviations from the projected trends may occur if such determinants evolve over time. Such changes may include improvements in cancer prevention and early detection, improved treatments, reduced exposure to cardiotoxic agents, or advances in CV management leading to modified hospitalization patterns. Conversely, population ageing, increasing multimorbidity, and increased exposure to risk factors could accelerate the predicted trends. In this context, public health plays a fundamental role in trying to counterbalance this increase by implementing broader primary and secondary prevention strategies. Although our analysis does not evaluate clinical interventions directly, the observed and projected trends provide context for healthcare systems to anticipate a growing need for integrated care models that incorporate CV prevention into oncology pathways and survivorship care.
Managing such a fragile and growing cohort highlights the relevance of enhanced clinical education. International guidelines increasingly endorse the integrated management of these patients. European Society of Cardiology (ESC) Guidelines on cardio-oncology (2022) already suggest a multidisciplinary approach to patients developing CV complications from cancer therapy.^38^ The American Heart Association (AHA) has introduced the concept of cardio-oncology rehabilitation (CORE), which focuses on strategies to identify cancer patients or survivors at risk of CVD and to prevent or cope with such adverse events. These strategies, which adapt cardiac rehab principles to cancer patients, include counseling on exercise training and on CV risk factors management (weight, blood pressure, lipid profile, weight loss, diabetes mellitus, tobacco cessation).^39^ ESC and American Society of Clinical Oncology (ASCO) guidelines advocate for baseline CV risk stratification, using tools like the HFA-ICOS risk assessment and cardiac tests (e.g. electrocardiogram, biomarkers, and imaging) before starting potentially cardiotoxic treatments. This enables the identification of at-risk patients and to tailor primary or secondary preventive measures according to pre-existing CVD, individual risk of CV toxicity, and type of cancer therapy.^40^ In addition, these findings may help raise awareness of the potential usefulness of cancer screening programmes in patients with CVD.
Beyond clinical practice guidelines, national and international policy initiatives may play an important role in supporting the development of cardio-oncology care frameworks. Among emerging ones, at the national level, in the US the National Cancer Institute (NCI) in partnership with the National Heart, Lung, and Blood Institute (NHLBI), has established a joint cardio-oncology research initiative, which aims to advance research in cancer treatment-related cardiotoxicity and to promote collaboration between cardiologists and oncologists. Their collaboration has led to several studies, e.g. a NCI/NHLBI-supported research identified ways to mitigate cardiotoxicity, including the use of beta-blockers and dexrazoxane.^41^ Moreover, in the UKa dedicated cardio-oncology clinic opened in 2011 at the Royal Brompton Hospital. Between February 2011 and February 2016, it managed 535 patients experiencing cancer treatment-related cardiotoxicity, with 128 presenting with left ventricular systolic dysfunction (LVSD). Following cardiac optimization, LVEF improved from 45% to 53% (P < 0.001) and the percentage of patients considered eligible to continue cancer therapy rose to 88%.^42^ Therefore, results are promising and encourage the implementation of such clinics on a broader scale.
Finally, although this analysis is based on US inpatient administrative data, its findings may have relevance beyond the US context and require cautious interpretation when applied to European healthcare contexts. Europe bears one fifth of the global cancer cases (22.4%) and cancer deaths (20.4%), despite accounting for less than 10% of the global population,^28^ reflecting an ageing population and an improving cancer survival rate. These demographic trends, coupled with the increasing prevalence of shared CV and cancer risk factors, suggest that the observed population-level increase in cancer diagnoses among CV hospitalizations may also be directionally relevant to European settings. However, important structural differences between USA and European healthcare systems limit the direct extrapolation of absolute prevalence estimates, since European systems are largely publicly funded, with universal coverage, different hospitalization thresholds, and distinct reimbursement and coding practices that may influence admission patterns and diagnostic recording.^43,44^ Nevertheless, the broader implications remain highly relevant for Europe and other non-US countries.
Limitations
Several limitations are present in this study, mainly related to the use of administrative data and ICD-10 coding. This includes potential for inaccuracy and inconsistency in diagnostic coding. The structure of ICD-10 coding may lead to grouping of distinct clinical entities under single categories, thereby limiting the interpretability of results within certain CV and cancer diagnoses. Moreover, the NIS does not provide detailed anthropometric, lifestyle or clinical data, such as cancer stage, cancer treatment exposure, or timing of cancer diagnosis relative to hospitalization. Cancer diagnoses are therefore not stratified by the status of the disease during CV admission, so whether the disease is active, in remission, or currently undergoing treatment. As a result, potential mechanisms linking cancer and CVD, such as cardiotoxicity of oncologic therapies, cannot be assessed, and the present analysis remains descriptive at the population-level. Furthermore, the NIS records anonymized discharge-level data, which does not allow identification of repeated hospitalizations for the same individual over time. Consequently, patients with chronic CV conditions requiring frequent admissions, such as heart failure or atrial fibrillation, may contribute to multiple records, potentially inflating prevalence estimates. This limitation may also influence long-term projections, and its magnitude cannot be fully quantified. Importantly, this study focused only on inpatients, so it is not possible to extrapolate these findings to the overall population of patients with CV conditions. Projections were derived using a Poisson model, which, although appropriate for our aims, does not account for changes in the characteristics of the population of interest and does not model linear or non-linear associations between demographic or epidemiological factors and the outcomes of interest, at person-level. The projected trends were not externally validated using independent datasets, as such analysis is not feasible within the NIS framework. The long-term extrapolations are based on a five-year observation window, which also warrants careful interpretation of projected trends. However, extending the analysis to earlier periods with different coding structures or temporal dynamics may introduce additional bias and was therefore not pursued. Additionally, as this analysis is based on aggregate administrative data, these trends reflect population-level patterns, individual-level association or causal relationships between CVD and cancer cannot be directly inferred (ecological fallacy). Finally, as these results are based on US data, they may not be easily generalizable to countries with different healthcare systems and differing cancer and CVD epidemiology. Additionally, future temporal changes in coding practices, diagnostic sensitivity, and admission thresholds may influence the predicted trends. Finally, the structure and coding system of the NIS dataset may further limit reproducibility of these findings in non-US settings. Validation of these trends in international administrative datasets would be valuable to assess generalizability. Despite these limitations, this study leverages a very large dataset, offering novel insights and a broad overview of the relationship at population-level between CV disease and cancer.
Conclusion
This study provides new insights into future trends in the prevalence of cancer diagnoses among CV hospitalizations, forecasting a significant increase from 2016 to 2040. Specifically, the proportion of CV hospitalizations with a concurrent cancer diagnosis is projected to increase approximately from 1 in 21 in 2016 to 1 in 8 by 2040. This prediction is relevant for healthcare planning, policies, and further granular research, in the developing field of cardio-oncology.
Supplementary Material
oeag030_Supplementary_Data
The reference list from the paper itself. Each links out to its DOI / PubMed record.
- 1Roth GA, Abate D, Abate KH, Abay SM, Abbafati C, Abbasi N, Abbastabar H, Abd-Allah F, Abdela J, Abdelalim A, Abdollahpour I, Abdulkader RS, Abebe HT, Abebe M, Abebe Z, Abejie AN, Abera SF, Abil OZ, Abraha HN, Abrham AR, Abu-Raddad LJ, Accrombessi MMK, Acharya D, Adamu AA, Adebayo OM, Adedoyin RA, Adekanmbi V, Adetokunboh OO, Adhena BM, Adib MG, Admasie A, Afshin A, Agarwal G, Agesa KM, Agrawal A, Agrawal S, Ahmadi A, Ahmadi M, Ahmed MB, Ahmed S, Aichour A · doi ↗ · pubmed ↗
- 2Wilcox NS, Amit U, Reibel JB, Berlin E, Howell K, Ky B. Cardiovascular disease and cancer: shared risk factors and mechanisms. Nat Rev Cardiol 2024;21:617–631.38600368 10.1038/s 41569-024-01017-x PMC 11324377 · doi ↗ · pubmed ↗
- 3Kort EJ, Paneth N, Woude GFV. The decline in US cancer mortality in people born since 1925. Cancer Res 2009;69:6500–6505.19679548 10.1158/0008-5472.CAN-09-0357 PMC 4326089 · doi ↗ · pubmed ↗
- 4Ng HS, Meng R, Marin TS, Damarell RA, Buckley E, Selvanayagam JB, Koczwara B. Cardiovascular mortality in people with cancer compared to the general population: a systematic review and meta-analysis. Cancer Med 2024;13:e 70057.39096123 10.1002/cam 4.70057 PMC 11297437 · doi ↗ · pubmed ↗
- 5Wang Z, Fan Z, Yang L, Liu L, Sheng C, Song F, Huang Y, Chen K. Higher risk of cardiovascular mortality than cancer mortality among long-term cancer survivors. Front Cardiovasc Med 2023;10:1014400.36760569 10.3389/fcvm.2023.1014400 PMC 9905625 · doi ↗ · pubmed ↗
- 6Kobo O, Raisi-Estabragh Z, Gevaert S, Rana JS, Van Spall HGC, Roguin A, Petersen SE, Ky B, Mamas MA. Impact of cancer diagnosis on distribution and trends of cardiovascular hospitalizations in the USA between 2004 and 2017. Eur Heart J Qual Care Clin Outcomes 2022;8:787–797.35913736 10.1093/ehjqcco/qcac 045PMC 9603542 · doi ↗ · pubmed ↗
- 7Matetic A, Mohamed M, Miller RJH, Kolman L, Lopez-Mattei J, Cheung WY, Brenner DR, Van Spall HGC, Graham M, Bianco C, Mamas MA. Impact of cancer diagnosis on causes and outcomes of 5.9 million US patients with cardiovascular admissions. Int J Cardiol 2021;341:76–83.34333019 10.1016/j.ijcard.2021.07.054 · doi ↗ · pubmed ↗
- 8Agency for Healthcare Research and Quality (AHRQ) . HCUP-US NIS overview. https://www.hcup-us.ahrq.gov/ (January 2025).