Expression of Concern: Local vs. systemic administration of bisphosphonates in rat cleft bone graft: A comparative study

Abstract
Genes, proteins, chemicals, diseases, species, mutations and cell lines named across the full text — each resolved to its canonical identifier and authoritative record.
Click any figure to enlarge with its caption.
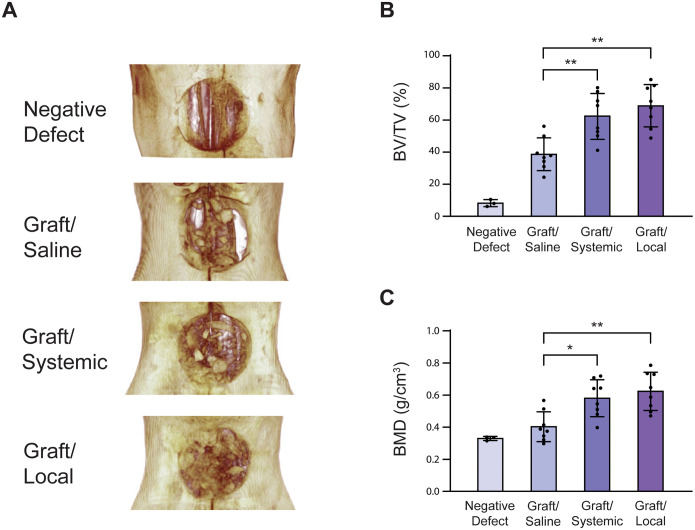 Figure 1
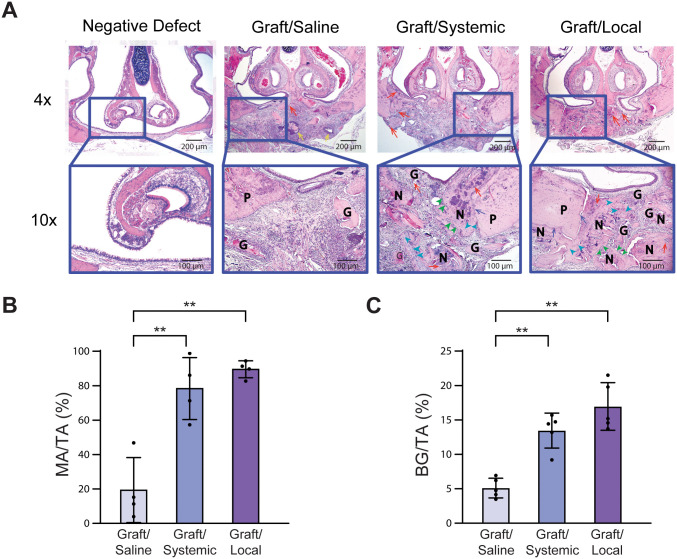 Figure 2
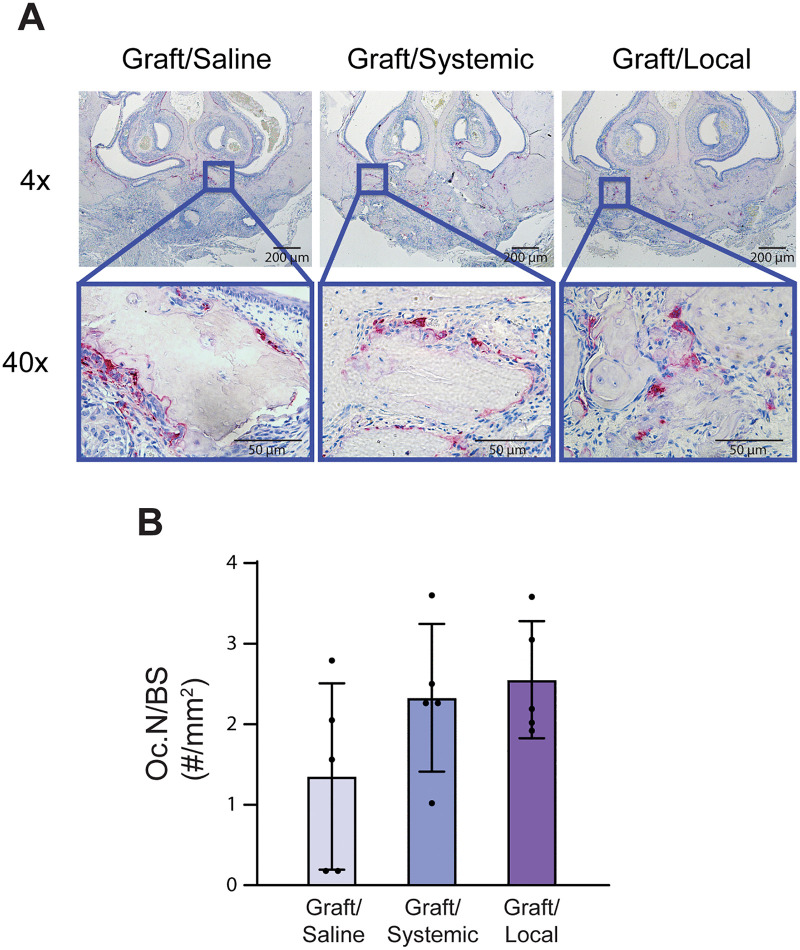 Figure 3
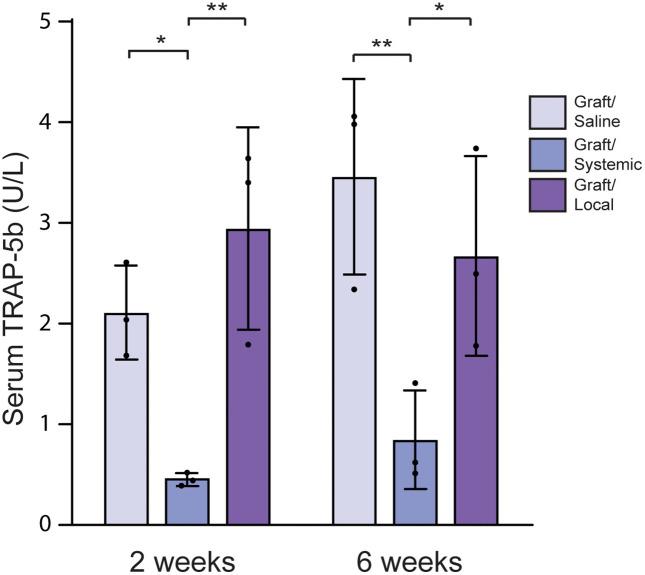 Figure 4
Peer Reviews
No public reviews on file for this paper yet. If you reviewed it on a platform where reviews are public (OpenReview, ICLR, NeurIPS, ICML), you can paste yours below so the community can read it here.
Videos
No videos yet. Explain this paper in a talk, walkthrough, or lecture? Add one.
Taxonomy
TopicsBone health and treatments · Cancer Research and Treatment · Skin and Cellular Biology Research
After this article [1] was published, concerns were raised regarding results presented in Figs 2-4.
Specifically:
Regarding Figs 2A and 3A in [1], the corresponding author stated that [1] and [2] were part of a larger project to evaluate the effect of bisphosphonates on cleft bone grafting, with [1] focusing on the method of delivery and [2] focusing on the timing of treatment delivery. They stated that the Control group was performed only once, simultaneously with the experiments in [2], and was not repeated for the experiments in [1]. The Control group images in Figs 2A and 3A in [1] were included as a visual demonstration only of the novel animal model developed in the project, and the Control group was not included in the statistical analyses of these figures in [1].
The corresponding author stated that in [1], the reported age of 20 weeks for the rats is incorrect and the correct age is 15 weeks.
A member of the PLOS One Editorial Board reviewed Fig 2A and 3A in [1] and the corresponding author’s response. They noted that Fig 2C in [1] and Fig 4C in [2] appear to show different results for the Control group, and that the Fig 3A Control images in [1] are labeled as 40X and 100X, whereas the Fig 5a Control group images in [2] are labeled as 4X and 10X. The corresponding author states that the data in Fig 2C in [1] are correct and the wrong units were reported in Fig 4C in [2]. They state that the magnification reported for Fig 3A in [1] is incorrect and should instead read 4X and 10X. They provided an updated version of Fig 3 with the correct magnification, and updated versions of Figs 2-4 where the “Control group” label is updated to “Negative Defect”. With these explanations and updated figures, PLOS considers the concerns pertaining to the Control/Negative Defect group results in Figs 2C and 4C in [1], as well as the magnification of the images in Figs 2A and 3A, resolved.
The corresponding author provided the data underlying the results in [1] (S1-S4 Files). Upon editorial review, it was noted that there appear to be differences between the underlying quantitative data in S1 File and S1 Table in [1]. Specifically:
The corresponding author stated that errors occurred in the preparation of Figs 2-5, and they provided updated versions of Figs 2-5 which are provided here. Regarding the differences between S1 Table in [1] and S1 File provided with this notice, the corresponding author stated that in S1 Table in [1], the following values are incorrect:
Upon editorial review, PLOS noted that multiple means and standard deviations reported in the Results section in [1] are incorrect, and readers should refer to S1 File provided with this notice for the correct values. The corresponding author stated the statistical significance of the results are not affected by these issues, and provided the underlying GraphPad Prism files for the updated Figs 2-5 in S5 File. The PLOS One Editors note that compared to Fig 5 in [1] which shows p < 0.05 (*) for the 6 weeks Graft/Saline comparison with 6 weeks Graft/Systemic, the updated Fig 5 for this comparison shows p < 0.01 (**). Based on S1 File, the following values in the Results section of [1] are incorrect:
Additionally, the corresponding author provided an updated Fig 1 (S6 File) where the Control group label is changed to Negative Defect. The PLOS One Editors note that the Negative Defect group in S6 File and Control group in the published Fig 1A [1] show n = 4; however, S1 File shows the number of animals in the Control group for Figs 2B and 2C as 3. The corresponding author states that 4 rats were assigned to the Control group in [1], with 3 included in the final analysis, and 10 rats were assigned to the Graft/Saline, Graft/Systemic, and Graft/Local groups with 4–8 rats included in the final analysis. The PLOS One Editors noted that only 4 individual measurements were included in the S1 File data underlying Fig 3B. The corresponding author stated that for Fig 3B, the correct number of analyzed specimens (n number) is 4, and that the correct n number for Fig 3C is 5. The PLOS One Editors note that Figs 3B and 3C appear to report quantifications based on the same underlying image data, including the images presented in Fig 3A. PLOS remains concerned for the difference in the number of analyzed samples between these figures.
In light of the extent of the data reporting errors listed above, PLOS remains concerned about the overall reliability of the data as published in [1]. The PLOS One Editors issue this Expression of Concern to notify readers of the above issues, to relay the information and data provided, and to inform readers to interpret the results with caution.
Fig 1A, the Fig 2A Control panel, and the Fig 3A Control panel in [1] report material adapted from or previously published in [2], published in 2017 by Sage, which are not offered under a CC BY license and are therefore excluded from this article’s [1] license. Please provide due attribution to the original publication when referring to this content.
Supporting information
S1 FileUnderlying quantitative data for Figs 2–5.(XLSX)
S2 FileOriginal image data underlying Fig 2A.(PDF)
S3 FileOriginal image data underlying Fig 3A.(PDF)
S4 FileOriginal image data underlying Fig 4A.(PDF)
S5 FileStatistical analyses underlying Figs 2–5.(ZIP)
S6 FileAlternative version of Fig 1.(TIF)
The reference list from the paper itself. Each links out to its DOI / PubMed record.
- 1Hong C, Quach A, Lin L, Olson J, Kwon T, Bezouglaia O, et al. Local vs. systemic administration of bisphosphonates in rat cleft bone graft: A comparative study. P Lo S One. 2018;13(1):e 0190901. doi: 10.1371/journal.pone.0190901 29304080 PMC 5755940 · doi ↗ · pubmed ↗
- 2Cheng N, Park J, Olson J, Kwon T, Lee D, Lim R, et al. Effects of Bisphosphonate Administration on Cleft Bone Graft in a Rat Model. Cleft Palate Craniofac J. 2017;54(6):687–98. doi: 10.1597/15-356 28094562 PMC 5557704 · doi ↗ · pubmed ↗