Evaluating the role of serum IL1R2 as a biomarker for diagnosis and prognostic stratification in sepsis
Yusheng Wang, Yuxian Wu, Zeping Jiang, Qian Lin, Min Wu, Jiansui Xu, Ting Sun, Meitang Wang, Yaoyang Liu, Yang Liu

TL;DR
This study shows that serum IL1R2 is a better biomarker for diagnosing sepsis and predicting outcomes than current markers like PCT and CRP.
Contribution
The study introduces serum IL1R2 as a novel and more effective biomarker for sepsis diagnosis and prognosis.
Findings
Sepsis patients had significantly higher serum IL1R2 levels than non-sepsis controls.
IL1R2 showed strong diagnostic accuracy (AUC = 0.908) and predicted 28-day mortality better than PCT and CRP.
In a CLP model, IL1R2 levels peaked within 24 hours and returned to baseline by day 3.
Abstract
This study aimed to identify novel sepsis biomarkers by evaluating serum interleukin-1 receptor type 2 (IL1R2) for its diagnostic and prognostic utility, in light of the limitations of current markers like PCT and CRP. A single-center retrospective analysis was conducted involving 55 sepsis patients and 42 non-sepsis controls. Serum IL1R2 levels, measured via ELISA within 24 h of admission, were compared against clinical data, including SOFA scores, 28-day mortality, and laboratory parameters (PCT, CRP). Diagnostic performance was assessed using ROC curve analysis, while prognostic utility was determined via Kaplan–Meier analysis. A cecal ligation and puncture (CLP) was used to track IL1R2 dynamics over time. Sepsis patients exhibited significantly elevated serum IL1R2 levels compared to controls. IL1R2 demonstrated strong diagnostic power (AUC = 0.908), outperforming PCT and CRP.…
Genes, proteins, chemicals, diseases, species, mutations and cell lines named across the full text — each resolved to its canonical identifier and authoritative record.
Click any figure to enlarge with its caption.
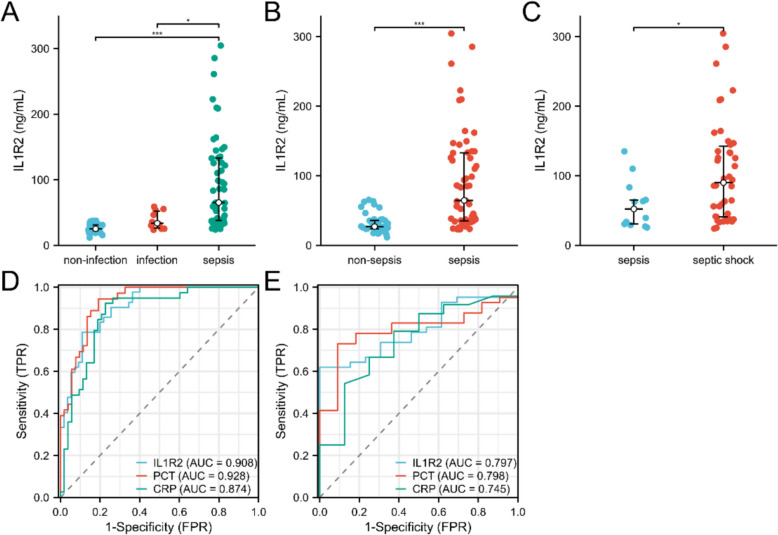 Figure 1
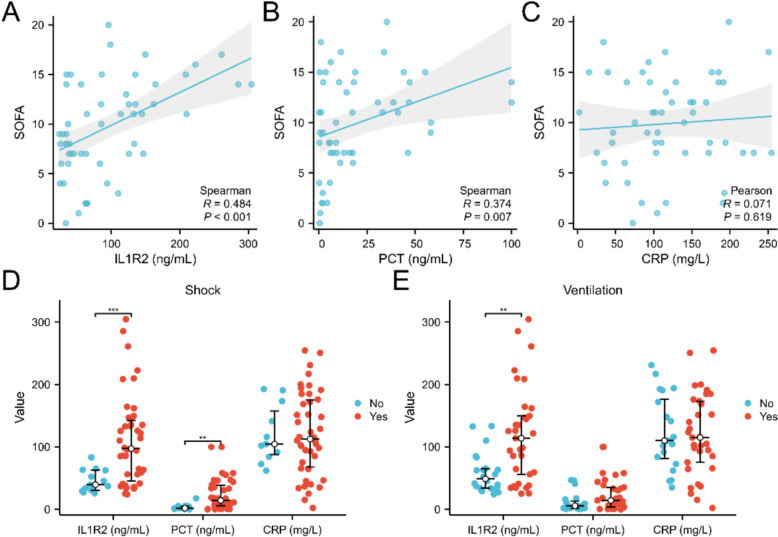 Figure 2
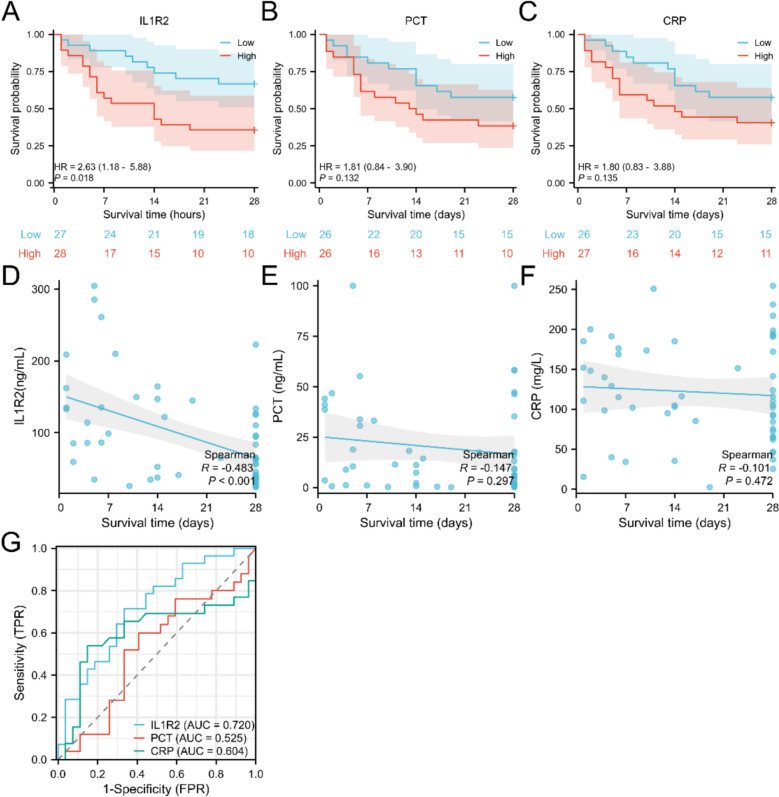 Figure 3
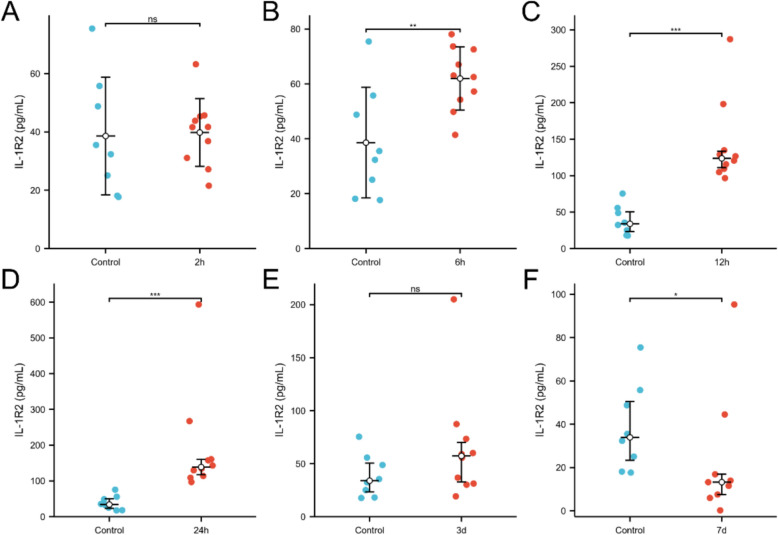 Figure 4
- —Youth Project of the Shanghai Changning District Health Commission
- —Key Specialty of the Shanghai Changning District Health Commission
- —Shanghai Municipal Health Commission Clinical Research Special Fund
Peer Reviews
No public reviews on file for this paper yet. If you reviewed it on a platform where reviews are public (OpenReview, ICLR, NeurIPS, ICML), you can paste yours below so the community can read it here.
Videos
No videos yet. Explain this paper in a talk, walkthrough, or lecture? Add one.
Taxonomy
TopicsSepsis Diagnosis and Treatment · Immune Response and Inflammation · Neonatal and Maternal Infections
Introduction
Sepsis is a life-threatening organ dysfunction caused by a dysregulated host immune response to infection [1]. According to the Global Burden of Disease Report, sepsis-related deaths account for nearly 20% of all global fatalities [2]. Current diagnosis of sepsis primarily relies on clinical assessment and conventional infection biomarkers such as procalcitonin (PCT) and C-reactive protein (CRP) [3]. However, their utility is limited by variability in individual responses and the influence of non-infectious factors: PCT can also be elevated in non-infectious inflammatory conditions [4], while CRP exhibits a broad and delayed response, failing to accurately reflect the transition in immune status specific to sepsis or the risk of disease progression [5]. Consequently, there is a pressing need for novel biomarkers that can precisely identify septic immune endotypes, assess organ injury, and predict clinical outcomes to facilitate early intervention and personalized therapy.
During infection, the interleukin-1 (IL-1) system plays a central role in initiating inflammatory responses and regulating antimicrobial immunity [2, 6]. Interleukin-1 receptor 2 (IL1R2), a decoy receptor for IL-1, structurally resembles the functional receptor IL-1R1 in its extracellular domain and competitively binds IL-1α and IL-1β [7]. However, due to the absence of an intracellular TIR domain, it cannot initiate downstream pro-inflammatory signaling, thereby exhibiting significant anti-inflammatory properties [8]. IL1R2 is primarily expressed on myeloid cells such as macrophages, neutrophils, and certain T cells [9]. Its expression is upregulated in various pathological states-including infectious diseases, inflammatory bowel diseases and cancer-and is closely associated with disease severity [10–12]. Recent studies have further revealed that IL1R2 participates in immune regulation through multiple mechanisms, such as promoting tumor cell proliferation [11], inducing T cell exhaustion [13], and regulating macrophage polarization toward the M2 phenotype [14].
Notably, emerging clinical evidence indicates that soluble IL1R2 (sIL1R2) is significantly elevated in the serum of sepsis patients [12]. Moreover, under septic conditions, IL1R2 expression exhibits cell type specificity, with particularly prominent upregulation in monocytes, suggesting a potential key role in monocyte-mediated immunosuppression [15]. These findings highlight the importance of IL1R2 as a potential biomarker in sepsis. However, there is a paucity of research focusing on the biomarker potential of serum IL1R2 in sepsis.
Therefore, this study aims to comprehensively validate the clinical value of serum IL1R2 in sepsis by firstly determining its diagnostic sensitivity and specificity, and secondly, investigating its capacity to indicate disease severity and predict patient prognosis.
Method
Patient enrollment
A retrospective analysis was conducted on 97 adult patients admitted to the ICU of the Naval Medical Center of People’s Liberation Army from March 2024 to May 2025. Sepsis patients were defined per Sepsis-3 criteria, while the non-sepsis control group comprised patients with trauma, coronary heart disease, post-surgery status, or infection (SOFA < 2). Collected data included demographics, comorbidities, infection details, SOFA, hospital stay duration, 28-day mortality, and laboratory results.
Sample collection and IL1R2 measurement
Blood samples were collected within 24 h after admission. The blood samples were allowed to clot for 1 h at room temperature before centrifugation at 3000 × g for 15 min. The serum was then transferred to sterile tubes and stored at − 80 °C for up to six months prior to IL1R2 measurement. The concentration of serum IL1R2 was detected using enzyme-linked immunosorbent assay (ELISA) in accordance with the manufacturer's protocol (RayBio^®^ Human IL-1 R2 ELISA Kit, Catalog #: ELH-IL1R2).
Mouse model of sepsis
8-week-old male C57 mice (Shanghai Sippe-BK Laboratory Animal Co. Ltd)) were used to establish sepsis model via cecal ligation and puncture (CLP) [16]. 4–5% isoflurane was used by inhalation to induce anaesthesia prior to surgery, with 1–2% isoflurane administered during the procedure to maintain anaesthesia. For euthanasia, mice were first anaesthetised with 4–5% isoflurane inhalation before undergoing cervical dislocation. Serum IL-1R2 levels were measured by ELISA according to manufacturer's protocol (RayBio^®^ Mouse IL-1 R2 ELISA Kit, Catalog #: ELM-IL1R2) at 2, 6, 12, 24 h, 3 days, and 7 days post-CLP via blood sampling from the inferior vena cava, these time points were chosen to capture the early hyperinflammatory phase, the subsequent immunosuppressive phase, and the late resolution phase typical of the murine CLP model.
Statistical analysis
Quantitative data are presented as mean ± standard deviation (SD) or median (interquartile range). Categorical data are expressed as percentages. The Shapiro–Wilk test was used to assess whether variables of interest followed a normal distribution. Comparisons between groups with normally distributed data were performed using the t-test or one-way analysis of variance (ANOVA), while non-normally distributed data were analyzed using nonparametric tests or the two-tailed Mann–Whitney U test. Correlations were evaluated using Pearson correlation (Normally distributed data) or Spearman correlation (Non-normal distribution data) coefficient along with corresponding p-values. To assess the sensitivity and specificity of IL-1R2, PCT, and CRP expression as biomarkers in non-sepsis, sepsis, and septic shock patient cohorts, receiver operating characteristic (ROC) curve analysis was conducted, and the area under the curve (AUC) was calculated. The optimal cutoff value is determined by the Youden index.
Results
Patient characteristics
This retrospective analysis included 55 sepsis patients and 42 non-sepsis controls. Baseline characteristics are summarized in Table 1. The sepsis cohort consisted predominantly of elderly males, with pulmonary and abdominal infections being the most prevalent. Gram-negative bacteria were the primary causative pathogens. Shock developed in 76.4% of sepsis patients, and 60.0% required mechanical ventilation. Over the 28-day follow-up period, the all-cause mortality rate was 49.1%. Table 1. Baseline characteristics of non-sepsis and sepsis patients enrolledCharacteristicsSepsisNon-sepsisp valuen5542Age, median (IQR)73.0 (64.0, 78.0)66.5 (57.3, 76.0)0.088Gender, n (%)0.004 Male40 (74.1%)19 (45.2%) Female14 (25.9%)23 (54.8%)Comorbidities, n (%) Hypertension, n (%)22 (40%)14 (33.3%)0.501 Diabetes mellitus, n (%)10 (18.2%)10 (23.8%)0.497 Coronary artery disease, n (%)9 (16.4%)1 (2.4%)0.057 Liver disease, n (%)2 (3.6%)2 (4.8%)1 Kidney disease, n (%)8 (14.5%)0 (0%)0.027 Malignancy, n (%)17 (30.9%)1 (2.4%) < 0.001 Central nervous disease, n (%)3 (5.5%)2 (4.8%)1Infection site, n (%) < 0.001 Lung21 (38.2%)7 (16.7%) Abdomen19 (34.5%)0 (0%) Blood4 (7.3%)0 (0%) Soft tissue2 (3.6%)0 (0%) Genitourinary2 (3.6%)3 (7.1%) Others7(12.7%)0 (0%)Pathogen, n (%) < 0.001 G-35 (63.6%)8 (20%) G + 12 (21.8%)0 (0%) Unclear6 (10.9%)0 (0%) Fungi2 (3.6%)0 (0%)Severity, treatment and survival Shock, n (%)42 (76.4%)0 (0%) < 0.001 Ventilator33 (60%)0 (0%) < 0.001 CRRT, n (%)11 (20%)0 (0%)0.009 28-day mortality, n (%)27 (49.1%)2 (4.8%) < 0.001 Survival time, median (IQR)14 (5.5, 28)26 (10, 28)0.04 SOFA, median (IQR)9.5 (7, 14)0 (0, 1) < 0.001Sepsis biomarkers Lactate, median (IQR)2.55 (1.68, 4.30)1.15 (0.83, 1.40) < 0.001 PCT, median (IQR)9.93 (2.07, 33.33)0.31 (0.09, 0.60) < 0.001 IL6, median (IQR)304.60 (56.35, 837.80)38.10 (18.90, 64.40) < 0.001 IL-1R2, median (IQR)65.33 (37.89, 133.13)25.85 (23.11, 32.02) < 0.001 CRP, median (IQR)116.00 (75.25, 194)35.70 (17.75, 56.05) < 0.001Laboratory results BNP, median (IQR)823.10 (283.40, 1825.80)83.35 (41.85, 146.73) < 0.001 Troponin, median (IQR)0.09 (0.04, 0.83)0.006 (0.004, 0.008) < 0.001 ALT, median (IQR)42.00 (21.95, 82.95)23.50 (16.18, 32.75)0.016 AST, median (IQR)66.65 (30.78, 160.25)23.35 (17.85, 39.50) < 0.001 Bilirubin, median (IQR)22.85 (15.68, 50.20)13.65 (9.73, 18.45) < 0.001 Albumin, mean ± sd31.43 ± 4.7338.21 ± 5.48 < 0.001 Creatinine, median (IQR)124.00 (87.25, 291.50)52.00 (47.00, 68.00) < 0.001 PT, median (IQR)16.65 (14.28, 19.40)13.10 (12.33, 14.68) < 0.001 INR, median (IQR)1.37 (1.18, 1.66)1.07 (0.99, 1.14) < 0.001 APTT, mean ± sd45.2 0± 14.5134.46 ± 6.08 < 0.001 TT, median (IQR)17.10 (16.08, 19.23)16.00 (15.00, 16.70) < 0.001 Fibrinogen, median (IQR)4.03 (2.46, 5.66)3.46 (2.97, 4.40)0.378 D-dimer, median (IQR)4.56 (2.62, 9.20)0.93 (0.60, 2.24) < 0.001 WBC, median (IQR)11.05 (6.47, 15.89)8.40 (6.72, 11.94)0.212 Hb, mean ± sd86.76 ± 25.68102.51 ± 19.480.002 PLT, median (IQR)106.50 (52.50, 171.25)205.00 (156.00, 308.50) < 0.001 N%, median (IQR)88.00 (85.00, 91.70)81.00 (71.70, 86.15) < 0.001 L%, median (IQR)4.70 (3.23, 8.23)10.60 (6.05, 16.25) < 0.001Normally distributed data were presented as mean ± standard deviation (SD), non-normal data as median (interquartile range, IQR). ALT Alanine Aminotransferase, APTT Activated Partial Thromboplastin Time; AST Aspartate Aminotransferase, CRP C-Reactive Protein, CRRT Continuous Renal Replacement Therapy, INR International Normalized Ratio; L% Lymphocyte Percentage; N% Neutrophil Percentage; PCT Procalcitonin; PLT Platelet Count; PT Prothrombin Time; SOFA Sequential Organ Failure Assessment; TT Thrombin Time; WBC White Blood Cell Count
Serum IL1R2 levels significantly elevated in sepsis patients
As shown in Fig. 1, compared with non-infected patients, serum IL1R2 levels were elevated in infected patients but did not reach statistical significance, whereas they were significantly elevated in sepsis patients (Fig. 1A, B). Concurrently, serum IL1R2 levels were further elevated in septic shock patients (Fig. 1C). The ROC curve analysis revealed that serum IL1R2 yielded an AUC of 0.908 for sepsis diagnosis, which was slightly lower than that of PCT (AUC = 0.928) but higher than that of CRP (AUC = 0.874) (Fig. 1D). In terms of distinguishing sepsis patients from those with septic shock, serum IL-1R2 demonstrated comparable diagnostic performance to PCT (AUC = 0.797 vs 0.798) and superior performance to CRP (AUC = 0.745) (Fig. 1E). Its sensitivity was 0.79, marginally lower than both PCT and CRP, yet its specificity reached 0.89, exceeding that of both PCT and CRP. Table 2 illustrated diagnostic performance of IL1R2, PCT, and CRP.Fig. 1. Serum IL1R2 level elevated in sepsis patients. Serum IL1R2 level significantly elevated in non-infection (n = 32) vs infection (n = 10) vs sepsis (n = 55, A), non-sepsis (n = 42) vs sepsis (n = 55, B), and sepsis (n = 13) vs septic shock (n = 42, C) patients. ROC analysis for IL1R2, PCT, CRP in distinguishing non-sepsis and sepsis (D), sepsis and septic shock (E). *p < 0.05, *p < 0.001Table 2Diagnostic performance of IL1R2, PCT and CRPBiomarkerCut-offSensitivitySpecificityAccuracyPositive predictive valueNegative predictive valueYouden’s indexIL1R232.9940.785710.890910.845360.846150.844830.67662PCT1.4950.944440.807690.863640.772730.954550.75214CRP71.1850.923080.773580.836960.750000.931820.69666IL1R2 Interleukin-1 receptor type 2, PCT Procalcitonin, CRP C-Reactive Protein
Positive correlation between serum IL1R2 and sepsis severity
Patients were grouped as IL1R2-high or IL1R2-low based on median serum IL1R2 levels in sepsis patients. As shown in Table 3, no significant differences were observed between groups in age, comorbidities, or site of infection. The difference in sex ratio may stem from bias arising from the underrepresentation of female patients in the sepsis cohort. Regarding pathogen types, patients with elevated IL1R2 levels exhibited a higher proportion of Gram-negative infections. Concurrently, the IL1R2 high group demonstrated significantly higher rates of shock occurrence, mechanical ventilation, SOFA scores, and 28-day mortality. Regarding pathogen types, patients with elevated IL1R2 levels exhibited a higher proportion of Gram-negative infections. Concurrently, the IL1R2 high group demonstrated significantly higher rates of shock occurrence, mechanical ventilation, SOFA scores, and 28-day mortality. Laboratory assessments including hepatic and renal function, coagulation parameters, and complete blood counts further indicated more severe disease severity in patients with elevated IL1R2 levels. Table 3. Comparison of baseline characteristics of sepsis patients grouped according to median IL1R2 levelCharacteristicsLowHighp valuen2827Age, median (IQR)69 (60, 78)73 (64.5, 78)0.472Gender, n (%)0.013 Male24 (88.9%)16 (59.3%) Female3 (11.1%)11 (40.7%)Comorbidities, n (%) Hypertension, n (%)11 (39.3%)11 (40.7%)0.912 Diabetes mellitus, n (%)3 (10.7%)7 (25.9%)0.266 Coronary artery disease, n (%)4 (14.3%)5 (18.5%)0.952 Liver disease, n (%)1 (3.6%)1 (3.7%)1.000 Kidney disease, n (%)5 (17.9%)3 (11.1%)0.744 Malignancy, n (%)11 (39.3%)6 (22.2%)0.171 Central nervous disease, n (%)3 (10.7%)0 (0%)0.248Infection site, n (%)0.404 Lung10 (35.7%)11 (40.7%) Abdomen8 (28.6%)11 (40.7%) Blood2 (7.1%)2 (7.4%) Soft tissue1 (3.6%)1 (3.7%) Genitourinary2 (7.1%)0 (0%) Others5 (17.9%)2 (7.4%)Pathogen, n (%)0.029 G-14 (50%)21 (77.8%) Fungi9 (32.1%)3 (11.1%) G + 0 (0%)2 (7.4%) Unclear5 (17.9%)1 (3.7%)Severity, treatment and survival SOFA, mean ± sd7.30 ± 4.2012.20± 4.00 < 0.001 Shock, n (%)16 (57.1%)26 (96.3%) < 0.001 ventilator, n (%)11 (39.3%)22 (81.5%)0.001 CRRT, n (%)4 (14.3%)7 (25.9%)0.281 28-day mortality, n (%)7 (25%)20 (74.1%) < 0.001 Survival time, median (IQR)28.00 (26.75, 28.00)8.00 (4.50, 23.50) < 0.001Sepsis biomarkers Lactate, median (IQR)2.30 (1.23, 3.75)3.30 (2.20, 6.05)0.054 PCT, median (IQR)5.64 (0.91, 17.68)12.26 (5.82, 37.83)0.071 CRP, mean ± sd122.90 ± 61.04134.08 ± 46.500.581 IL6, median (IQR)85.09 (31.03, 180.45)495.70 (424.20, 1566.00)0.009Laboratory results BNP, median (IQR)508.80(269.80, 1156.50)1466.20 (433.02, 2894.40)0.278 Troponin, median (IQR)0.06 (0.02, 0.75)0.14 (0.07, 1.24)0.155 ALT, median (IQR)30.40 (15.50, 54.68)47.25 (27.78, 111.50)0.077 AST, median (IQR)45.90 (20.88, 81.38)84.95 (47.15, 442.03)0.006 Bilirubin, median (IQR)20.50 (13.95, 30.93)29.95 (17.20, 87.63)0.061 Albumin, mean ± sd32.42 ± 4.4530.44 ± 4.890.140 Creatinine, median (IQR)102.90 (72.73, 274.00)134.50 (110.50, 276.27)0.224 PT, median (IQR)16.15 ± 3.1718.66 ± 4.640.027 APTT, median (IQR)41.56 ± 11.7048.84 ± 16.270.070 TT, median (IQR)17.25 (16.15, 18.93)17.00 (16.03, 19.35)0.913 Fibrinogen, median (IQR)4.04 (2.63, 5.01)3.92 (1.98, 5.97)0.869 D-dimer, median (IQR)3.93 (2.23, 5.69)6.00 (2.94, 11.75)0.076 WBC, mean ± sd10.42 ± 5.6012.89 ± 7.040.163 Hb, mean ± sd82.76 ± 24.9890.92 ± 26.210.251 PLT, median (IQR)142.50 (72.75, 228.25)78.00 (45.75, 143.00)0.031 N%, median (IQR)86.00 (81.70, 89.35)91.25 (86.58, 93.45)0.003 L%, median (IQR)4.70 (3.70, 9.20)4.20 (2.40, 7.40)0.252Normally distributed data were presented as mean ± standard deviation (SD), non-normal data as median (interquartile range, IQR). ALT Alanine Aminotransferase, APTT Activated Partial Thromboplastin Time, AST Aspartate Aminotransferase, CRP C-Reactive Protein, CRRT Continuous Renal Replacement Therapy, INR International Normalized Ratio, L% Lymphocyte Percentage, N% Neutrophil Percentage, PCT Procalcitonin, PLT Platelet Count, PT Prothrombin Time, SOFA Sequential Organ Failure Assessment, TT Thrombin Time, WBC White Blood Cell Count
Correlation analysis revealed a significantly positive association between serum IL1R2 levels and SOFA scores (R = 0.484, p < 0.001, Fig. 2A). PCT also demonstrated significant correlation with SOFA scores, but with a lower correlation coefficient (R = 0.374, p = 0.007, Fig. 2B). CRP showed no correlation with SOFA scores (Fig. 2C). When patients were grouped according to shock status and mechanical ventilation use, results indicated that IL1R2 and PCT levels were significantly higher in patients with shock compared to those without shock, while CRP levels showed no significant difference (Fig. 2D). Among patients receiving mechanical ventilation, IL1R2 levels were significantly higher than in those not receiving ventilation, with no significant differences in PCT or CRP levels (Fig. 2E).Fig. 2. Serum IL1R2 positively correlated with sepsis severity. Correlation analysis of SOFA and serum IL1R2 (A, n = 54), PCT (B, n = 51), and CRP (C, n = 52). Serum IL1R2 (n = 55), PCT (n = 52), and CRP (n = 53) levels in sepsis patients with or without shock (D), and mechanical ventilator use (E). **p < 0.01, ***p < 0.001
Predictive value of serum IL1R2 for 28-day mortality
Based on median serum IL1R2 levels, KM analysis revealed significantly higher 28-day mortality in patients with elevated serum IL1R2 level (Fig. 3A, HR = 2.63, p = 0.018). Patients with elevated PCT and CRP levels also exhibited a tendency towards increased mortality, though statistical significance was not attained (Fig. 3B, C). Correlation analysis demonstrated a significant negative association between serum IL1R2 levels and survival time (Fig. 3D, R = −0.483, p < 0.001), whereas neither PCT nor CRP correlated with survival time (Fig. 3E, F). ROC analysis (Fig. 3G) demonstrated that serum IL1R2 achieved an AUC of 0.720 for predicting 28-day survival outcomes, surpassing both PCT (AUC = 0.525) and CRP (AUC = 0.604). Cox regression analysis showed that IL1R2 is an independent risk factor for 28-day mortality in sepsis patient (Table 4).Fig. 3. Prognostic utility of IL1R2 and PCT, CRP. KM analysis of IL1R2 (A, n = 55), PCT (B, n = 52), CRP (C, n = 53). Correlation analysis of survival time and IL1R2 (D, n = 55), PCT (E, n = 52), CRP (F, n = 53). ROC analysis for IL1R2, PCT, CRP in differentiating 28-day outcome (G)Table 4. Univariate and multivariate Cox regression model of risk factor predicting 28-day mortalityCharacteristicsTotal(N)Univariate analysisMultivariate analysisHazard ratio (95% CI)P valueHazard ratio (95% CI)p valueIL1R2551.008 (1.003–1.013)0.0011.007 (1.001—1.012)0.012Lactate481.126 (0.970–1.306)0.118PCT521.004 (0.990–1.019)0.546CRP531.003 (0.998–1.009)0.206Bilirubin520.994 (0.985–1.003)0.190Creatinine521.000 (0.999–1.002)0.660D-dimer520.994 (0.930–1.063)0.871WBC530.990 (0.934–1.050)0.745Hb531.016 (1.000–1.033)0.0491.010 (0.993—1.026)0.247PLT520.999 (0.996–1.002)0.474CRP C-Reactive Protein, Hb hemoglobin, PCT Procalcitonin, PLT Platelet Count, WBC White Blood Cell Count
Kinetics of serum IL1R2 in mouse sepsis model
To further investigate the pattern of elevated serum IL1R2 in sepsis, a mouse sepsis model was established via CLP, and measured serum IL1R2 levels at various time points post-modelling. Results demonstrated that serum IL1R2 levels were not significantly elevated at 2h post-CLP (Fig. 4A). The earliest significant increase occurred at 6h post-CLP (Fig. 4B), with continued elevation observed at 12 and 24h (Figs. 4C, D). By day 3 post-CLP, serum IL1R2 levels had returned to control group levels (Fig. 4E), whereas by day 7 levels had further decreased to levels significantly lower than the control group (Fig. 4F).Fig. 4. Kinetics of serum IL1R2 in mouse CLP model. Comparison of control (n = 10) and serum IL1R2 level in 2h (A, n = 10), 6h (B, n = 10), 12h (C, n = 10), 24h (D, n = 10), 3 day (E, n = 10), 7 day (F, n = 9) post-CLP. *p < 0.05, **p < 0.01, ***p < 0.001. ns, no significance
Discussion
Sepsis represents a significant global public health burden, with mortality rates ranging from 25 to 50%, accounting for approximately 20% of all causes of death annually [17]. The absence of specific early manifestations in sepsis renders clinical diagnosis challenging, whereas biomarkers offer objective indicators to enhance diagnostic accuracy. Furthermore, an ideal biomarker should possess multiple functions, including reflecting the magnitude of organ dysfunction, facilitating risk stratification, and enabling prognostic assessment [18, 19]. The most commonly used biomarkers for sepsis in clinical practice are PCT and CRP. Although CRP exhibits high sensitivity, its specificity is poor, as it elevates in various inflammatory conditions. Conversely, PCT demonstrates good specificity for bacterial infections, but its accuracy in assessing disease severity and prognosis is limited [20, 21]. There is an urgent clinical need for novel biomarkers to assist in the diagnosis and management of sepsis.
IL1R2 is the decoy receptor for interleukin-1 (IL-1α/β) [12]. It was first discovered to inhibit excessive inflammatory responses by binding IL-1 and thereby preventing its activation of the pro-inflammatory signaling pathway IL1R1 [12]. IL1R2 plays a significant role in multiple diseases. For instance, its overexpression in breast and colorectal cancers induces an immunosuppressive microenvironment that promotes tumour growth [22]. Conversely, reduced IL1R2 expression in inflammatory bowel disease increases susceptibility and leads to disease progression [23]. Recent studies reveal its critical role in sepsis: IL1R2 binds to enolase 1 (ENO1) to inhibit glycolysis, thereby reducing pyroptosis and inflammation [12]. Reports indicate that IL1R2 on monocyte membranes is upregulated in sepsis but downregulated in septic shock, correlating positively with SOFA scores and serving as a marker for sepsis severity [15]. However, its detection via flow cytometry and non-linear relationship with disease severity makes clinical application inconvenient. Consequently, we explored the potential of serum IL1R2 as a biomarker for sepsis.
In this study, by comparing serum IL1R2 levels within 24 h of admission between sepsis and non-sepsis patients, we found that serum IL1R2 levels were significantly higher in sepsis patients than in non-sepsis patients [64.6 (35.3, 133.1 vs 27.0 (23.8, 35.7), p < 0.001]. Furthermore, serum IL1R2 levels in infected patients were also higher than in non-infected patients [25.3 (22.5, 25.7) vs 33.7(26.6, 52.4), p = 0.198], though this did not reach statistical significance, potentially due to the small number of patients enrolled. This suggests that IL1R2 is elevated in the context of infection, particularly during sepsis.
In terms of diagnostic efficacy for sepsis, serum IL-1R2 demonstrates excellent diagnostic value, with an AUC reaching 0.908, which is slightly lower than PCT (AUC = 0.928) but superior to CRP (AUC = 0.874). Moreover, its specificity (0.89) and positive predictive value (0.85) both exceed those of PCT and CRP, indicating that I1LR2 may be more suitable for confirmatory testing than PCT and CRP. This makes up for the shortcoming of PCT having a low positive predictive value in the diagnosis of sepsis [24], making it suitable for diagnostic confirmation in high-risk populations.
In terms of stratifying sepsis severity, patients with elevated serum IL-1R2 levels exhibited higher SOFA scores, 28-day mortality rates, incidence of shock, and mechanical ventilation requirements. Concurrently, we noted that patients with elevated serum IL1R2 levels exhibited a significantly higher proportion of G-bacterial infections, consistent with previous reports [25]. Laboratory parameters such as IL-6, lactate, ALT, PT, and PLT were also worse, indicating more severe disease. The SOFA score represents a standard for assessing the extent of organ involvement in sepsis [26]. However, its inclusion of numerous parameters renders it not convenient for clinical use [27]. Correlation analysis demonstrated a significant positive association between serum IL1R2 levels and SOFA scores, indicating strong predictive capability for disease severity. In contrast, PCT showed weaker correlation with SOFA, while CRP exhibited no correlation. Serum IL1R2 levels were also significantly elevated in patients with shock and mechanical ventilation. PCT demonstrated significant differences only in the shock group, whereas CRP showed no variation across either classification. These findings suggest that serum IL1R2 possesses superior risk stratification capabilities compared to currently established biomarkers.
Regarding the prognosis of sepsis, the predictive value of the existing biomarker PCT (particularly at admission) remains controversial [28]. Current evidence indicates that a single PCT measurement has limited value and does not support relying solely on admission PCT levels to guide clinical decision-making [4]. Instead, dynamic monitoring is more crucial [3]. Our KM analysis revealed that patients with elevated serum IL1R2 levels within 24 h of admission exhibited significantly higher 28-day mortality rates, with a negative correlation observed between IL1R2 levels and survival duration. The AUC for prognostic assessment reached 0.72. Conversely, PCT and CRP levels at admission failed to accurately predict prognosis. This suggests serum IL1R2 may serve as a prognostic indicator for sepsis.
Functionally, IL1R2 primarily acts as a decoy receptor, binding and neutralizing proinflammatory cytokines IL-1α and IL-1β to inhibit downstream inflammatory signaling. This function is critical in sepsis, as excessive IL-1 secretion is a key driver of the inflammatory storm and tissue damage associated with the condition. Concurrently, IL1R2 reduces macrophage glycolysis by inhibiting enolase 1 (ENO1) and suppresses pyroptosis and inflammatory cytokine release mediated by gasdermin D (GSDMD) [12]. These functions collectively suggest an anti-inflammatory role for IL1R2. Indeed, IL1R2 is expressed on circulating monocytes and correlates with immunosuppressive features such as low HLA-DR expression and high levels of immune checkpoint molecules [15]. Thus, IL1R2 serves as a negative feedback mechanism against hyperinflammatory states, reflecting the body's efforts to maintain immune homeostasis. Consequently, IL1R2 levels can indicate the severity of sepsis and serve as a marker of host immune status.
Finally, we investigated the pattern of elevated serum IL1R2 following sepsis onset using a mouse CLP model, discovering that serum IL1R2 levels significantly increased six hours post-CLP surgery. Serum IL1R2 levels begin to rise significantly 6 h after CLP surgery and continue to increase over the next 24 h. The levels return to normal around day 3 and continue to decline below normal by day 7. Recent studies indicate that circulating IL1R2 in the septic state originates from pyroptotic macrophages [12]. Theoretically, the more pronounced macrophage pyroptosis, the greater the release of IL1R2 into the circulation. Consequently, IL1R2 levels rise markedly during the early hyperinflammatory phase of the disease course. In the later stages of sepsis, as inflammation resolves, IL1R2 release decreases significantly and may even fall below normal levels could potentially reflect immune cell exhaustion. These speculations warrant further validation.
This study has limitations. First and foremost, this study is a single-center retrospective analysis with a limited sample size. This design limits the statistical power of the findings and may lead to imprecise or even inflated estimates of correlations and diagnostic performance. Furthermore, the single-center design inevitably introduces a risk of selection bias. Specifically, patients with sepsis included in this study had overall higher severity, and the generalizability of these results to external populations (e.g., different geographic regions, pathogen spectra and severity) requires further validation. Second, Baseline differences existed between sepsis and non-sepsis groups. Although current evidence does not indicate that gender or malignancy affects serum IL1R2 levels, given the upregulation of IL1R2 observed in various tumor tissues, we cannot rule out the possibility that locally elevated IL1R2 expression in tumor tissues may influence serum IL1R2 levels when tumor patients develop sepsis. Last, there remains a significant gap before it can be applied in clinical practice, including the development and standardization of a commercially available assay, the determination of context-specific cut-off values in large, and rigorous cost-effectiveness analyses.
Conclusion
In summary, serum IL-1R2 represents a promising biomarker for sepsis, demonstrating utility not only for sepsis diagnosis but more importantly, for assessing disease severity and predicting mortality. Further prospective studies are justified to translate these findings into clinical practice.