The Science of Growth Monitoring: Beyond the Basics
Melodee Liegl, Amy Y. Pan

TL;DR
This paper reviews how growth charts are made and used to track children's growth and health.
Contribution
The paper provides a detailed comparison of CDC and WHO growth chart methodologies and their clinical relevance.
Findings
CDC and WHO growth charts differ due to distinct reference populations and construction methods.
Growth charts are essential tools for assessing health and wellness in children.
Understanding chart construction helps in their proper clinical application.
Abstract
Growth charts are widely used as a clinical and research tool to assess physical growth performance of infants, children, and adolescents. They have been widely accepted as indicators of health and wellness. CDC and WHO growth charts are well known and used for tracking childhood growth. The differences between WHO and CDC growth curves are largely attributable to distinct reference population and curve construction methodologies. The aim of this review is to focus on the construction, utilization, as well as clinical significance of the CDC and WHO growth charts.
Genes, proteins, chemicals, diseases, species, mutations and cell lines named across the full text — each resolved to its canonical identifier and authoritative record.
Click any figure to enlarge with its caption.
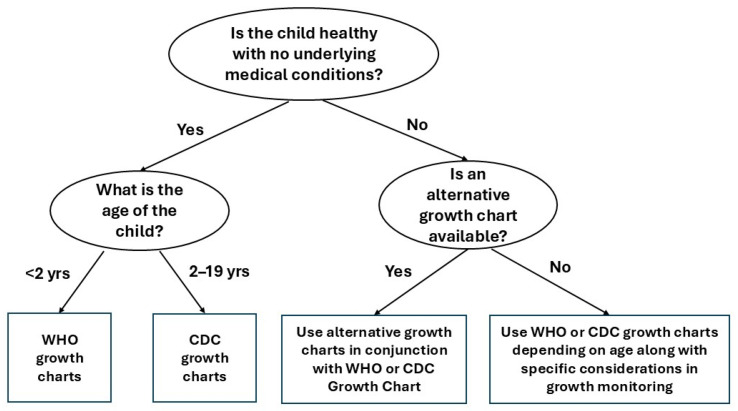 Figure 1
Peer Reviews
No public reviews on file for this paper yet. If you reviewed it on a platform where reviews are public (OpenReview, ICLR, NeurIPS, ICML), you can paste yours below so the community can read it here.
Videos
No videos yet. Explain this paper in a talk, walkthrough, or lecture? Add one.
Taxonomy
TopicsObesity, Physical Activity, Diet · Child Nutrition and Feeding Issues · Birth, Development, and Health