Infants exposed to maternal type 1 diabetes: intrauterine epigenetic modifications and neurological development
Nieves Luisa González-González, Enrique González-Dávila, José Ramón Castro-Conde, Candelaria González-Campos, Olivia Orribo-Morales, Carlos Flores, José Miguel Lorenzo-Salazar, Rafaela González-Montelongo, Adrián Muñoz-Barrera, Erika Padrón-Pérez, Nazaret Villalba-Martín

TL;DR
Infants born to mothers with Type-1 diabetes show altered DNA methylation in genes linked to brain development, which may affect their cognitive and motor skills.
Contribution
This is the first study to link intrauterine DNA methylation changes to neurodevelopmental outcomes in infants exposed to maternal Type-1 diabetes.
Findings
Infants exposed to maternal Type-1 diabetes had 108 differentially methylated genes linked to neurodevelopmental pathways.
Genes like NRXN1 and SHANK3 showed significant methylation changes and were enriched in key neurological pathways.
At age two, these infants scored lower on cognitive, language, and motor assessments compared to controls.
Abstract
The relationship between the neurodevelopment in infants exposed to maternal Type-1 diabetes and changes in fetal DNA methylation has not yet been investigated. This hypothesis-generating study, we aimed to determine whether neurodevelopmental outcomes in offspring from mothers with Type-1 diabetes are associated with intrauterine epigenetic changes in fetal DNA. We conducted a prospective, pilot case-control study, comparing infants exposed to maternal Type-1-diabetes with control infants. Cord blood DNA samples were analyzed using the TruSeq-Methyl-Capture-EPIC-Kit, covering over 3.3 million CpGs. The Bayley-III Scales were used to assess infant neurodevelopment, and the scores were correlated with the newborn DNA methylation data. In infants exposed to maternal diabetes, we identified 108 differentially methylated genes enriched in pathways crucial for neurodevelopment: Vocal,…
Genes, proteins, chemicals, diseases, species, mutations and cell lines named across the full text — each resolved to its canonical identifier and authoritative record.
Click any figure to enlarge with its caption.
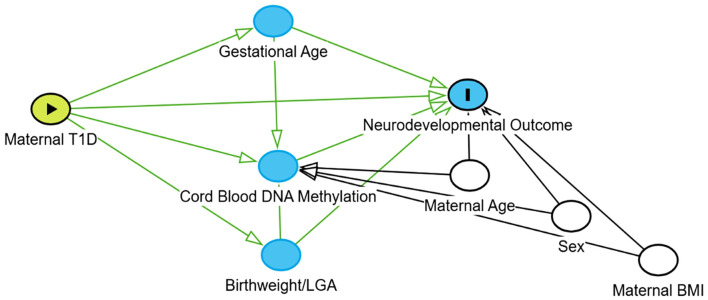 Figure 1
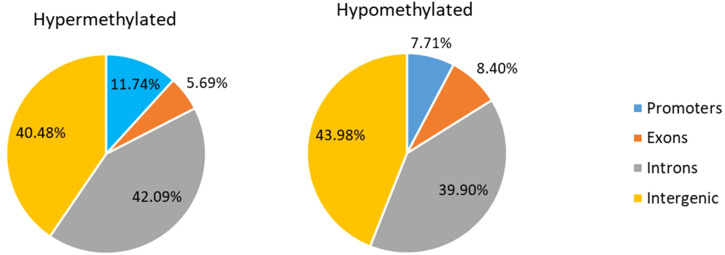 Figure 2
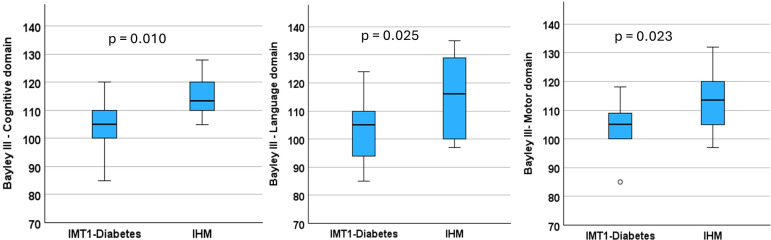 Figure 3
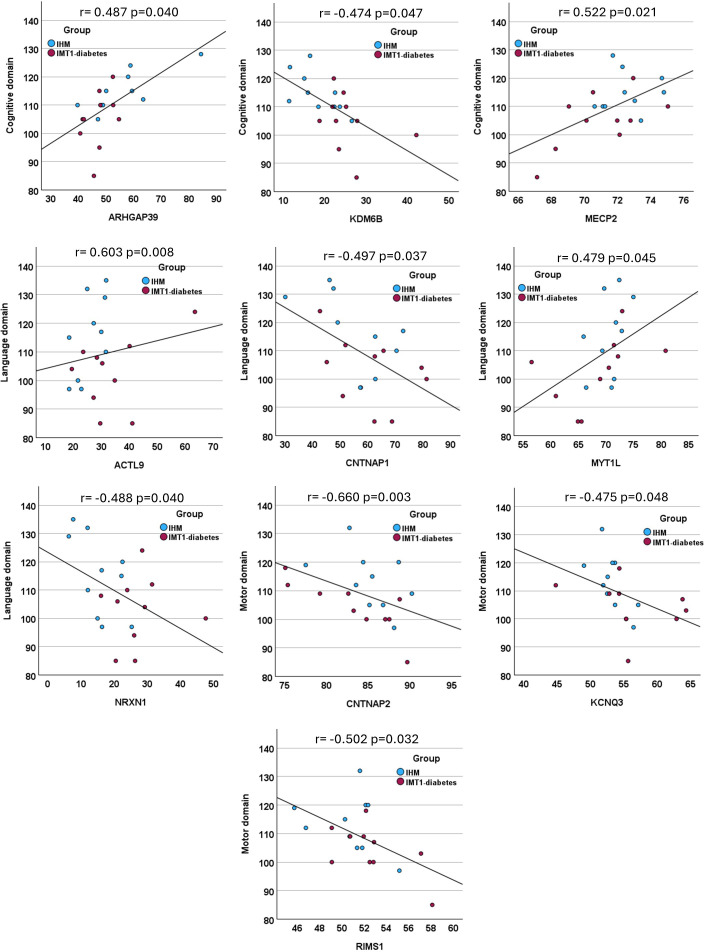 Figure 4
| Variable | IMT1-diabetes (n = 10) | IHM (n = 10) | p-value | Total (n = 20) |
|---|---|---|---|---|
| Maternal characteristics | ||||
| Age (years) | 32.3 ± 5.8 | 28.6 ± 4.8 | 0.138 | 30.5 ± 5.5 |
| Pre-pregnancy weight (kg) | 67.6 ± 12.8 | 62.6 ± 9.3 | 0.334 | 65.1 ± 11.2 |
| Weight increase (kg) | 12.4 ± 3.3 | 15.0 ± 4.2 | 0.133 | 13.7 ± 3.9 |
| Height (cm) | 164.9 ± 6.4 | 161.2 ± 6.3 | 0.209 | 163.1 ± 6.5 |
| Body mass index (kg/m2) | 24.7 ± 3.4 | 24.2 ± 3.7 | 0.721 | 24.4 ± 3.5 |
| Body mass index, n (%) | 0.470 | |||
| Normal weight | 4 (40) | 5 (50) | 9 (45) | |
| Overweight | 6 (60) | 4 (40) | 10 (50) | |
| Obesity | 0 (0) | 1 (10) | 1 (5) | |
| Race/Ethnicity (n, %) | ||||
| White/Caucasian | 10 (100) | 10 (100) | 1.000 | 20 (100) |
| Parity = 0, n (%) | 6 (60) | 8 (89) | 0.628 | 14 (70) |
| Perinatal outcomes | ||||
| Cesarean, n (%) | 5 (50) | 5 (50) | 1.000 | 10 (50%) |
| Gestational age (days) | 264.7 ± 4.7 | 276.2 ± 4.2 | <0.001 | 270.5 ± 7.3 |
| Newborn weight (g) | 3574 ± 480 | 3262 ± 203 | 0.082 | 3418 ± 393 |
| Weight percentile (%) | 82.2 ± 24.0 | 57.2 ± 18.8 | 0.019 | 69.7 ± 24.6 |
| LGA n (%) | 6 (60) | 0 (0) | 0.011 | 6 (30) |
| Sex = Female, n (%) | 6 (60) | 8 (80) | 0.628 | 14 (70) |
| Apgar test at 1st minute | 8.3 ± 1.6 | 9.0 ± 0.0 | 0.209 | 8.7 ± 1.2 |
| Apgar test at 5th minute | 8.8 ± 0.6 | 9.1 ± 0.3 | 0.196 | 9.0 ± 0.5 |
| Biological processes | Homo sapiens, n Refs. | Genes n | Expected | Fold enrichment | +/- | q-value | FDR |
|---|---|---|---|---|---|---|---|
| Vocal learning | 6 | 4 | 0.28 | 14.50 | + | 6.18E-05 | 1.27E-02 |
| Imitative learning | 6 | 4 | 0.28 | 14.50 | + | 6.18E05 | 1.29E-02 |
| Observational learning | 7 | 4 | .32 | 12.43 | + | 1.39E-04 | 2.32E-02 |
| Synapse organization | 368 | 36 | 16.92 | 2.13 | + | 2.23E-05 | 6.69E-03 |
| Neuron projection guidance-Neurogenesis | 1380 | 94 | 63.43 | 1.48 | + | 1.38E | 2.33E-02 |
| Vocal imitative and observational learning DM genes n = 4 | Synapse organization DM genes n = 38 | Neuron projection guidance-neurogenesis DM genes n = 94 | ||
|---|---|---|---|---|
|
|
|
|
|
|
|
|
|
|
|
|
|
|
|
|
|
|
|
|
|
|
|
|
|
|
|
|
| |
|
|
|
|
| |
|
|
|
|
| |
|
|
|
|
| |
|
|
|
|
| |
|
|
|
|
| |
|
|
|
|
| |
|
|
|
|
| |
|
|
|
|
| |
|
|
|
|
| |
|
|
|
|
| |
|
|
|
|
| |
|
|
|
|
| |
|
|
|
|
| |
|
|
|
|
| |
|
|
|
|
| |
|
|
|
|
| |
|
|
|
|
| |
|
|
|
|
| |
|
|
|
|
| |
|
|
|
|
| |
|
|
|
|
| |
|
|
|
|
| |
|
|
|
|
| |
|
|
|
|
| |
|
|
|
|
| |
|
|
|
| ||
|
|
| |||
|
| ||||
|
| ||||
| Gene | Genomic annotation | Domain r and (p-value) | ||
|---|---|---|---|---|
| Cognitive | Language | Motor | ||
|
| chr19:8808334-8808829 | -0.362 (0.140) | 0.603 (0.008) | 0.406 (0.094) |
|
| chr8:145755105-145756129 | 0.487 (0.040) | -0.152 (0.548) | 0.040 (0.875) |
|
| chr17:40836179-40837073 | -0.182 (0.470) | -0.497 (0.037) | -0.239 (0.340) |
|
| chr7:147005399-147244794 | -0.153 (0.543) | -0.142 (0.575) | -0.660 (0.003) |
|
| chr8:133133109-133493342 | -0.042 (0.867) | 0.146 (0.562) | -0.475 (0.048) |
|
| chr17:7754919-7755044 | -0.474 (0.047) | 0.358 (0.144) | 0.333 (0.177) |
|
| chrX:153287025-153363174 | 0.522 (0.021) | 0.266 (0.286) | -0.168 (0.505) |
|
| chr2:1870141-1878396 | -0.369 (0.132) | 0.479 (0.045) | -0.177 (0.483) |
|
| chr2:50201283-50201571 | -0.223 (0.373) | -0.488 (0.040) | -0.018 (0.945) |
|
| chr6:72596254-73112847 | -0.008 (0.976) | -0.114 (0.653) | -0.502 (0.032) |
- —Fundación General Universidad de La Laguna10.13039/100015529
Peer Reviews
No public reviews on file for this paper yet. If you reviewed it on a platform where reviews are public (OpenReview, ICLR, NeurIPS, ICML), you can paste yours below so the community can read it here.
Videos
No videos yet. Explain this paper in a talk, walkthrough, or lecture? Add one.
Taxonomy
TopicsGestational Diabetes Research and Management · Pancreatic function and diabetes · Prenatal Substance Exposure Effects
Introduction
Carbohydrate intolerance is the medical complication that most often complicates pregnancy. The most common type is gestational diabetes (GDM) (2-32%). Unlike GDM, Type-1-diabetes is present before pregnancy, and is much less frequent (0.2-1%), and much more serious. Moreover, Type-1diabetes is not related to maternal age or obesity, as GDM (1).
Cognitive and psychomotor impairments, as well as lower intelligence quotient scores, have been observed in infants exposed to maternal diabetes, and these effects may persist into adolescence (2). Maternal hyperglycemia is thought disrupt fetal brain development through pathways involving neuroinflammation, oxidative stress, nutrients and hormone delivery, and epigenetic modifications. Optimal glycemic control during pregnancy is associated with reduced incidence and severity of these complications (3).
Epigenetics refers to heritable changes in gene function that occur without altering the underlying DNA sequence. During fetal development, epigenetic processes are crucial. They orchestrate tissue-specific gene expression, cellular differentiation, and overall developmental programming in response to both genetic predispositions and external conditions, including the intrauterine metabolic environment (4).
Accumulating evidence suggests that GDM triggers epigenetic changes in fetal DNA associated with an increased risk for metabolic and cardiovascular diseases, and neurologic disorders, in childhood and adult life. These epigenetic modifications have been identified in multiple tissues, including placenta, cord blood, and amniocytes (5).
To the best of our knowledge, the relationship between the neurodevelopment of infants exposed to maternal Type-1 diabetes (IMT1-diabetes) and changes in fetal DNA methylation has not yet been investigated. The only study conducted has exclusively assessed changes related to cardiovascular and metabolic diseases in offspring (6). Epigenetic marks could potentially serve as biomarkers for early intervention strategies in newborns at high risk for neurological disorders.
Our aim was to determine if the neurodevelopmental outcomes of offspring from mothers with Type-1 diabetes are associated with intrauterine epigenetic changes in fetal DNA. Given that, no previous studies have explored this specific association, we designed this pilot study as a hypothesis-generating analysis.
Materials and methods
This is a prospective, hypothesis-generating pilot case-control study that included 10 IMT1-diabetes and 10 infants of healthy mothers (IHM) recruited at the University Hospital of Canary Islands, Spain, between June 2021 and January 2024. Pregnant women were matched 1:1 using a nearest neighbor based on pre-pregnancy BMI, stratified according to the World Health Organization (WHO) categories, and race/ethnicity. This case-control design was fundamental for establishing a physiological baseline to isolate maternal T1D-specific effects from standard population variations.
Inclusion criteria were: Singleton gestation, absence of maternal pathology, mode of delivery (vaginal or elective cesarean section under regional anesthesia), absence of medical or obstetrics complications and of toxic habits (tobacco, drug abuse, other medication than insulin), and gestational-age >37 weeks. Exclusion criteria: Birthweight of IHM <10^th^ or >90^th^ percentile, according to customized birthweight curves (7), congenital malformations, chromosomal abnormalities and admission to neonatal unit for special care. Normal glucose tolerance of healthy mothers was ensured according to the NDDG criteria (8). HbA1c-levels were determined in mothers with type1-diabetes throughout the pregnancy.
This study was conducted in accordance with the Declaration of Helsinki and was approved by the Clinical Ethics Committee of the Canary Islands University Hospital Complex, Spain (CHUC-201817). All mothers signed a written consent forms.
Whole-genome bisulfite sequencing (WGBS) analysis
Cord blood was collected immediately after birth in 3 ml K3-EDTA tubes in the delivery room and immediately stored at −80°C until DNA extraction. DNA of cord blood samples was purified using Blood genomicPrep Mini Spin Kit (Cytiva Amersham™). DNA concentrations were measured on the Qubit 3.0 fluorometer using the Qubit dsDNA HS Assay (Thermo Fisher Scientific).
Bisulfite conversion and Methyl-Seq procedures
Bisulfite conversion of DNA and library preparation were done using the TruSeq-Methyl-Capture-EPIC Library Prep Kit (Illumina Inc.) (9), which targets 3.34 million CpGs sites, following the manufacturer’s recommendations. Library sizes were assessed with a 4200 TapeStation (Agilent Technologies) and the concentration determined with the Qubit dsDNA HS Assay (Thermo Fisher Scientific). Sequencing was conducted at the Instituto Tecnológico y de Energías Removables (ITER, Santa Cruz de Tenerife. Canary Islands, Spain) with a NovaSeq 6000 Sequencing System (Illumina Inc.) using 110 bp paired-end single-indexed reads along with 1% of a PhiX Control-V3 (Illumina Inc.) (9).
Bioinformatics analysis to obtain the cytosine methylation
We used bcl2fastq v2.20 (10) to perform sample demultiplexing and Bismark v0.24.0 (11) for bisulfite mapping and methylation calling against the GRCh37/hg19 reference genome. Bismark-based pipeline transformed the sequence and reads into fully bisulfite-converted forward (C->T) and reverse read (G->A) conversion of the forward strand versions. Then, transformed reads were aligned to similarly converted versions of the reference genome (also C->T and G->A converted). The best alignment from the four alignment processes against the bisulfite genomes were compared to the normal genomic sequence and the methylation state of all cytosine positions in the read was inferred.
CpGs sites were considered differentially methylated (DM) if differences were > 15% and the q-value < 0.01. Promoters, regions and islands were considered DM if differences were ≥ 1% and q-value < 0.01. DM CpGs and DM regions DMRs (genomic clusters of ≥ 3 DM-CpGs and ≤ 1000 base pairs) were identified. Genes containing DMRs within their genomic boundaries were classified as DM genes. Positive and negative methylation differences coefficients refer to hypermethylation and hypomethylation, respectively.
Bioinformatics and statistical analysis
Methylation analysis was conducted using the MethylKit R package (12). After loading the methylation data for each individual, a filter based on read coverage was applied to reduce bias associated with enrichment. Bases with coverage below 10X s and above the 99.9th percentile of coverage in each sample were discarded. For subsequent analyses, all samples were combined into a single object for base pair locations covered in all samples. The calculateDiffMeth function was used to identify CpG sites or regions with methylation differences using logistic regression. To clarify the hypothesized causal structure and justify the selection of covariates, a Directed Acyclic Graph (DAG) was developed (Figure 1). Based on this framework, maternal age, infant sex, and pre-pregnancy BMI were treated as confounders and included in the models. Although matching was performed using BMI categories, pre-pregnancy BMI was treated as a continuous variable in the regression models to account for residual intra-category variance and to provide a more precise adjustment for this potential confounder. Gestational age was included as a covariate to adjust for tissue maturity and isolate the direct effect of maternal type-1 diabetes on the methylome. Conversely, birthweight and LGA status were identified as downstream mediators and were excluded from the primary models to avoid overadjustment and collider bias.
Directed acyclic graph (DAG) illustrating the hypothesized causal framework. This diagram outlines the assumed causal pathways connecting maternal type-1 diabetes to infant neurodevelopmental outcomes, mediated by intrauterine epigenetic modifications. Nodes represent variables, and arrows indicate hypothesized directional causal effects based on biological plausibility and literature.
P-values were adjusted to q-values to control the false discovery rate (FDR) in multiple hypothesis testing using the Sliding Linear Model (SLIM). The MethSeg function was applied to create CpG segments with similar profiles of differential methylation. Genomation R package and data obtained from the Hg19 known Genea BED-file genome browser website (13), was used for gene location and promoters, introns, exons, and intergenic regions identification.
CpGs sites were considered differentially methylated (DM) if differences were > 15% and the q-value < 0.01. Promoters, regions and islands were considered DM if differences were ≥ 1% and q-value < 0.01. DM CpGs and DM regions DMRs (genomic clusters of ≥ 3 DM-CpGs and ≤ 1000 base pairs) were identified. Genes containing DMRs within their genomic boundaries were classified as DM genes. Positive and negative methylation differences coefficients refer to hypermethylation and hypomethylation, respectively.
Gene-set enrichment analysis
The Gene Ontology (GO) Platform (14) was used to conduct trait enrichment analysis on the DM-genes to identify association with neurodevelopment and brain functions. Pathways with FDR-corrected q-value <0.05 were considered statistically significant.
The overlap between DM genes enriched for neurological functions and the SFARI (15) gene database, which is the largest platform containing genes with mutations associated with ASD, was assessed. Furthermore, to facilitate the comparison between the top-100 SFARI genes and all DM genes identified in the IMT1-diabetes, a table comprising the names and coordinates of all human genome genes (Hg19, University of Santa Cruz, California) (13) was generated.
Neurodevelopment assessment
Children were examined using the Bayley Scales of Infant Development-Third Edition (Bayley-III) (16) at two years of age (range 24–26 months) and the screening for ASD was performed using the M‐CHAT‐R-F test (17). Neurodevelopmental data were collected and analyzed by two psychometricians blind to whether the children were IMT1-diabetes or IHM. Partial correlation analysis was used to assess the relationship between the methylation values of DMRs and the different neurodevelopmental domains included in the Bayley test. To account for the influence of clinical group and gestational maturity on both DNA methylation and neurodevelopment, all correlation analyses between methylation values of DMRs and Bayley-III scores were performed using partial correlations adjusted for group (control and Type I Diabetes) and gestational age.
Results
Maternal characteristics and perinatal outcomes are shown in Table 1. The mean glycated hemoglobin values were 6.9% ± 1.2 SDs; 6.5% ± 1.3 SDs and 6.6% ± 1.0 SDs, in the first, second and third trimester, respectively. Non obstetric or perinatal complications were recorded.
Genome-wide methylation analysis
From the 2,259,717 individual CpGs analyzed in each newborn, 16,018 resulted DM (methylation difference >15%, q < 0.01). Of all DM CpGs, 57.9% were hypomethylated, of which 11.74% were located in promoters, 5.69% in exons, 40.48% in introns and 42.09% in intergenic regions. Conversely, the remaining 42.1% CpGs, were hypermethylated, with 7.71% located in promoters, 8.40% in exons, 43.98% in introns and 39.90% in intergenic regions. In total we identified 7,150 DM promoters, 23,928 islands, and 3,647 regions DMRs (methylation difference > 1%, q < 0.01). Figure 2. The DMRs were annotated to a total of 1,127 unique genes.
Differences in DNA methylation in promoters, intronics, exonics, and intergenic regions of IMT1-diabetes (hypo and hypermetylation, + or - methylation differences > 1% and q-value < 0.01).
Gene-set enrichment analysis
Functional analysis was performed on the 1,127 genes containing DMRs, of which 920 were unequivocally mapped to the human genome. These genes were linked to 110 principal pathways (Supplementary material, Supplementary Table S1), with a significant association to critical neurodevelopmental pathways: “Vocal, Imitative, and Observational learning”, “Synapse organization” and “Neurogenesis”. Table 2. The genes involved in these three pathways are shown in Table 3. NRXN1 and SHANK3 were enriched across all neurodevelopmental pathways. NRXN2 and KIRREL3 were involved in two pathways each. Notably, the largest methylation differences were concentrated in three key genes: MYT1L (21.61%, q = 1.97E-07), NRXN1 (12.305%, q = 5.04E-75), and SHANK3 (11.620%, q = 9.81E-06). (Supplementary material, Supplementary Table S2 provides specific details on these genes, including their locations, methylation differences and q values.
Twenty of the genes enriched for neurodevelopment overlapped with ASD-linked genes from the SFARI database (15). Table 3. Moreover, other eight genes with annotated DMRs were identified as strong candidates for ASD according to the SFARI database: ANKRD11, CACNA1C, CHD7, EHMT1, EBF3, FOXP1, KDM6B, and KCNQ2.
Neurological assessment of infants
At two years of age, IMT1-diabetes showed significantly lower scores than controls in cognitive (p = 0.010), language (p = 0.025), and motor (p = 0.023) domains on the Bayley-III scales. Figure 3. The screening test for ASD performed at this age was negative in all infants.
Boxplots showing cognitive, language, and motor domain scores on the Bayley-III-scales for infants exposed to maternal type 1 Diabetes (IMT1-diabetes) and infants born to healthy mothers (IHM).
Correlations: Partial correlation analysis revealed significant associations between Bayley-III scores and methylation values across the DM CpGs DMRs annotated to 10 genes. Cognitive domain scores correlated with methylation values in loci included in ARHGAP39, KDM6B, and MECP2. Language domain scores correlated with methylation values in loci contained within ACTL9, CNTNAP1, MYT1L and NRXN1. Moreover, motor domain scores correlated with methylation values in loci included in CNTNAP2, KCNQ3, and RIMS1. Table 4 and Figure 4.
Correlations between Bayley scales of infant neurodevelopment and methylation values (%) of regions within differentially methylated genes. P-values and correlation coefficients (r) were derived from partial correlation analyses adjusted for group and gestational age.
Discussion
This hypothesis-generating pilot study provides the first evidence of an association between neurodevelopmental alterations in offspring of mothers with Type 1 Diabetes and epigenetic changes detected in umbilical cord blood at birth. Children in the IMT1-Diabetes group scored significantly lower across the cognitive, language, and motor domains of the Bayley-III Scales. Importantly, we found that methylation values within DMRs annotated to ten crucial genes for neurodevelopment and brain function correlated significantly with these domain scores. The enrichment analysis confirmed that DMR-containing genes were significantly overrepresented in key neurological pathways, such as, Synaptogenesis, Neurogenesis Vocal, and Observational learning and Imitative learning. The largest methylation differences were concentrated in the neurodevelopmental genes MYT1L, NRXN1, and SHANK3. Both, NRXN1 and SHANK3, were enriched across all identified neurodevelopmental pathways, and, notably, NRXN1 and MYT1L showed significant correlation with the Bayley-III language domain score.
Arabiat et al. (18) in 2024 utilized the Bayley Scales to demonstrate an association between maternal Diabetes and poorer mental and motor skill outcomes in children aged 12–24 months. We have previously observed abnormal neurodevelopment features in video-EEG recording of infants of mothers with GDM and Type 1 Diabetes (19), difficulties in establishing stable behavioral states (20) and lower memory and learning abilities, both in utero and after birth (21). Levels of glycosylated hemoglobin were associated with the observed neurodevelopmental alterations (19–21). In the present study, birth weight, and the rate of large-for-gestational-age newborns, were significantly higher in the IMT1-diabetes group, objectively confirming the provided effect of maternal hyperglycemia on intrauterine growth (22).
To date, the few existing studies examining the link between intrauterine DNA methylation changes and subsequent neurodevelopmental outcomes in children have focused exclusively on GDM, not Type 1 Diabetes. Recently (2025), Wang et al. (23) demonstrated in rodent models that high glucose exposure alters DNA methylation and gene expression in neural progenitor cells. These alterations affected pathways critical for neurogenesis, axon guidance, and synaptic development, which provides a plausible biological basis for the observed neurodevelopmental impairment and aligns with the findings of our study.
Severe overlaps were observed between genes with DMRs that we identified in cord blood samples of IMT1-Diabetes and those reported in prior epigenetic studies of placental samples of pregnant women with GDM: NRXN1 and PRDM16 overlapped with genes reported Wang et al. (24), but they did not find any enriched pathway accounting for 256 differentially methylated genes that identified. ABLIM1 and SASH1 overlapped with genes identified by Chen et al. (25). In addition, SHANK3 and GRIK4 were differentially methylated in both our cord blood cohort and the placental cohort studied by Lu et al. (26). None of these prior studies assessed the correlation between the identified methylation changes and the subsequent neurodevelopment of the children. Also, in placental samples (but not those from pregnancies complicated by diabetes), Diez-Ahijado et al. (27) in 2024 are the sole investigators to have reported an association between methylation levels in DMRs annotated to four neurological development genes and cognitive development in children. One of these, MECOM, was also identified in our analysis. However, the enrichment analysis of all DM genes they identified did not reveal associations with neurological development pathways, a finding that contrast with the clear demonstration achieved in our study.
Our analysis identified 28 genes with annotated DMRs in the IMT1-diabetes group that overlapped with genes associated with ASD, according with the SFARI database (15). A large 2024 epigenome-wide association meta-analysis by Schuurmans et al. (28) identified DNA methylation differences associated with ASD using polygenic scores on cord blood DNA, but reported no overlap of differentially methylated candidate genes for ASD, either within their cohorts or with other published studies. To date, no studies have linked epigenetic changes in cord blood DNA with a later ASD diagnosis in children exposed to maternal Type-1 Diabetes. Only Howe et al. (29) previously explored this possibility in children exposed to GDM, identifying methylation differences in OR2L13, a neurodevelopment-associated gene. Notably, OR2L13 was also identified in our analysis. Furthermore, five neurodevelopment-enriched genes from our analysis (CNTNAP2, GALNT, SLC4A10, KIRREL3, and MYT1L) coincided with the DM genes identified by Mordaunt et al. (30) in 2025 in the cord blood of females later diagnosed with ASD, all of which are included the SFARI database (15). In our study, KIRREL3 and MYT1L exhibited the largest methylation differences; and MYT1L correlated with the Bayley-III language domain score, and CNTNAP2 correlated with the motor domain score. As ASD is a neurodevelopmental disorder, the involvement of genes associated with brain development is expected.
Among the strengths of this work is it originality as the first prospective, hypothesis-generating pilot study to suggest that epigenetic changes identified in newborns exposed to maternal Type1 Diabetes are potentially linked to later neurodevelopmental outcomes in childhood. Furthermore, we used WGBS, the gold-standard technique for DNA methylation analysis, which covered over 3.34 million CpGs. This method provides a more complete and unbiased view of the methylome compared to array-based studies (such as the Illumina 450-BeadChip or EPIC array, which cover 400-752,000 CpG sites). The broader coverage explains why we identified a higher number of DM CpGs and DMRs than similar previous studies. The only exception was the Mordaunt et al. (30) study, with which we found the most overlap, likely because they also used a WGBS approach.
The primary limitation of this study is its small sample size, which may increase the risk of false-positive findings; consequently, the present results should be interpreted as exploratory. This work does not constitute a definitive epigenome-wide association study (EWAS), but rather serves to identify potential pathways for future research. Due to sample size constraints, several key factors—including cell-type heterogeneity, maternal glycemic control, socioeconomic status, and education level—were not incorporated into the regression models to avoid over-parameterization. Nevertheless, these findings provide a valuable foundation for future larger-scale research that should account for these variables alongside gene expression analysis. If confirmed, DNA methylation patterns in umbilical cord blood could serve as potential biomarkers for neurodevelopmental alterations, enabling targeted interventions for high-risk newborns.”
In conclusion, while further confirmation in much larger cohorts is needed, we provide the first results supporting the hypothesis that neurodevelopmental alterations observed in children born to mothers with Type 1 Diabetes are potentially linked to DNA methylation changes during intrauterine life, which can be identified at birth.
The reference list from the paper itself. Each links out to its DOI / PubMed record.
- 1Malaza N Masete M Adam S Dias S Nyawo T Pheiffer C . A systematic review to compare adverse pregnancy outcomes in women with pregestational diabetes and gestational diabetes. Int J Environ Res Public Health. (2022) 19:10846. doi: 10.3390/ijerph 191710846, PMID: 36078559 PMC 9517767 · doi ↗ · pubmed ↗
- 2Pretorius RA Avraam D Guxens M Julvez J Harris JR Nader JT . Is maternal diabetes during pregnancy associated with neurodevelopmental, cognitive and behavioural outcomes in children? Insights from individual participant data meta-analysis in ten birth cohorts. BMC Pediatr. (2025) 25:76. doi: 10.1186/s 12887-024-05365-y, PMID: 39885386 PMC 11783732 · doi ↗ · pubmed ↗
- 3Nivins S Giesbrecht GF Tomfohr-Madsen L Lebel C . Prenatal maternal diabetes, comorbidities, and risk for neurodevelopmental impairment in the first two years. Pediatr Res. (2025) 5:1612–22. doi: 10.1038/s 41390-024-03620-7, PMID: 39390101 · doi ↗ · pubmed ↗
- 4Ornoy A Becker M Weinstein-Fudim L Ergaz Z . Diabetes during pregnancy: A maternal disease complicating the course of pregnancy with long-term deleterious effects on the offspring. A clinical review. Int J Mol Sci. (2021) 22:2965. doi: 10.3390/ijms 22062965, PMID: 33803995 PMC 7999044 · doi ↗ · pubmed ↗
- 5Amrom D Schwartz SS . Maternal metabolic health, lifestyle, and environment - understanding how epigenetics drives future offspring health. Curr Diabetes Rev. (2023) 19:e 220422203919. doi: 10.2174/1573399818666220422085016, PMID: 35466879 · doi ↗ · pubmed ↗
- 6Knorr S Skakkebæk A Just J Johannsen EB Trolle C Vang S . Epigenetic and transcriptomic alterations in offspring born to women with type 1 diabetes (the EPICOM study). BMC Med. (2022) 20:338. doi: 10.1186/s 12916-022-02514-x, PMID: 36138412 PMC 9503228 · doi ↗ · pubmed ↗
- 7González González NL González Dávila E González Martín A Padrón E García Hernández JÁ . Maternal thinness and obesity and customized fetal weight charts. Fetal Diagn Ther. (2021) 48:551–9. doi: 10.1159/000515251, PMID: 34407539 · doi ↗ · pubmed ↗
- 8National Diabetes Data Group . Classification and diagnosis of diabetes mellitus and other categories of glucose intolerance. Diabetes. (1979) 28:1039–57. doi: 10.2337/diab.28.12.1039, PMID: 510803 · doi ↗ · pubmed ↗