Association between body mass index and risk of breast cancer according to breast cancer subtypes: A systematic review and meta-analysis
Chiara Dauccia, Marco Bruzzone, Luca Arecco, Eva Blondeaux, Marianna Sirico, Riccardo Gerosa, Maria Alice Franzoi, Mariana Brandão, Lorenzo Perrone, Paolo Pedrazzoli, Christine Desmedt, Serena Di Cosimo, Claudio Vernieri, Laetitia Collet, Matteo Lambertini, Evandro de Azambuja

TL;DR
Higher BMI increases the risk of ER-positive breast cancer, especially in postmenopausal women, while effects differ by menopausal status and cancer subtype.
Contribution
This study clarifies how BMI affects breast cancer risk by subtype and menopausal status through a systematic review and meta-analysis.
Findings
Obesity is linked to a moderate increased risk of ER-positive breast cancer.
Premenopausal overweight is associated with lower ER-positive but higher ER-negative and TNBC risk.
Postmenopausal obesity shows a stronger association with ER-positive breast cancer.
Abstract
Higher body mass index (BMI) is a risk factor for breast cancer (BC) development, but the relationship with BC subtypes in pre- and post-menopausal women remains unclear. We performed a systematic search from PubMed, Embase and Cochrane databases until 09/24 (CRD42020206108) for cohort and case-control studies assessing the association between BMI and BC subtypes and/or menopausal status. BC risk in overweight (BMI 25–29.9 kg/m2) or obese (BMI≥30 kg/m2) subjects was compared to risk in under/normal weight (BMI<25 kg/m2). BC subtypes were classified as i) ER-positive (regardless HER2-status) ii) ER-negative (regardless HER2-status) iii) HER2-positive (regardless ER-status); iv) triple-negative BC (TNBC). Out of 2841 records screened, 33 studies (9 cohort and 24 case-control) including 2,103,181 women were eligible. Obesity was associated with a modestly increased risk of ER-positive BC…
Genes, proteins, chemicals, diseases, species, mutations and cell lines named across the full text — each resolved to its canonical identifier and authoritative record.
Click any figure to enlarge with its caption.
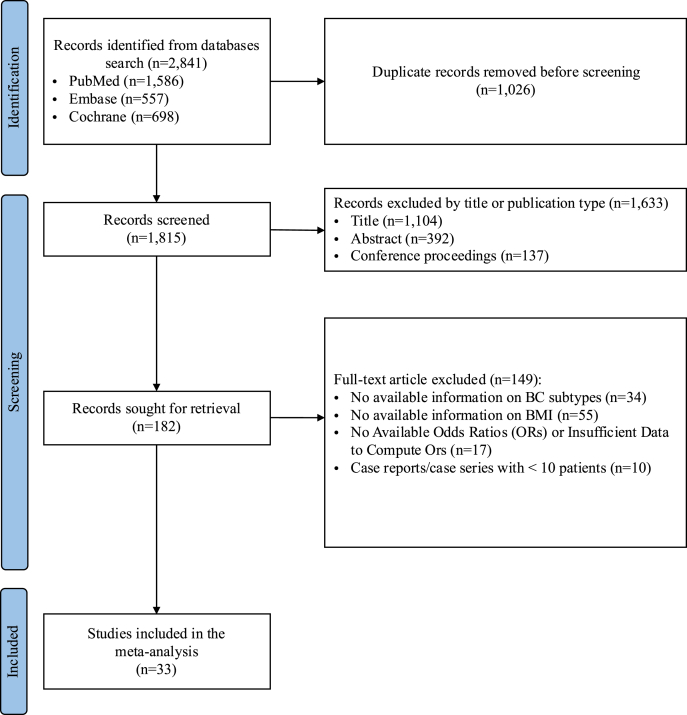 Figure 1
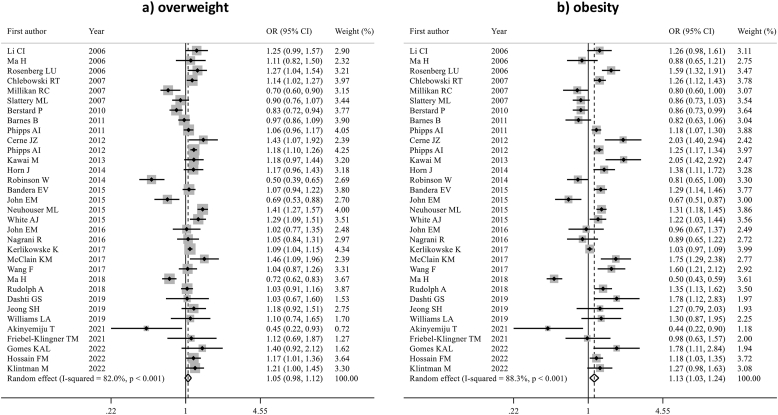 Figure 2
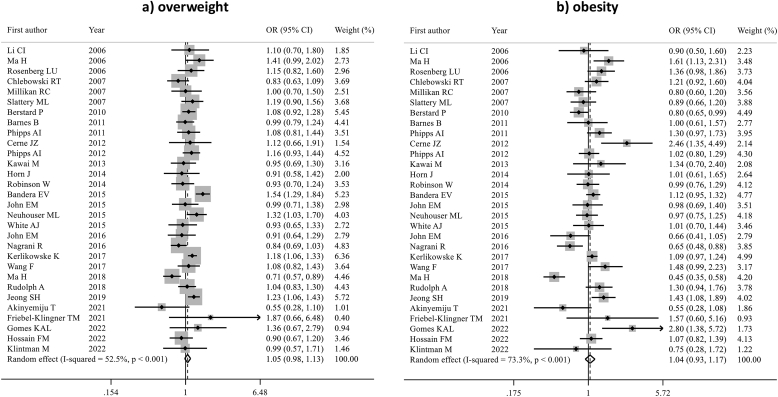 Figure 3
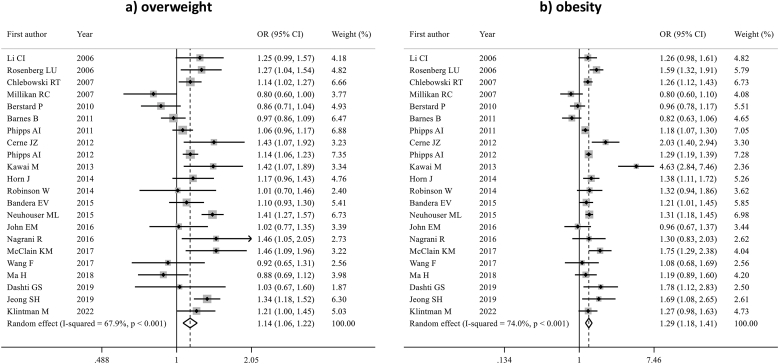 Figure 4
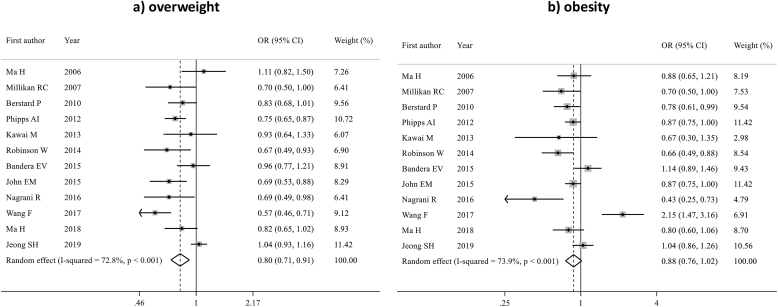 Figure 5
Peer Reviews
No public reviews on file for this paper yet. If you reviewed it on a platform where reviews are public (OpenReview, ICLR, NeurIPS, ICML), you can paste yours below so the community can read it here.
Videos
No videos yet. Explain this paper in a talk, walkthrough, or lecture? Add one.
Taxonomy
TopicsCancer Risks and Factors · Digital Radiography and Breast Imaging · Metabolism, Diabetes, and Cancer
Introduction
1
Obesity is a growing global health concern [1]. Between 1990 and 2022, the global age-standardized prevalence of obesity increased from 4.8 % to 18.5 % in women, with approximately 504 million women affected [1]. Body mass index (BMI), calculated as weight in kilograms divided by height (in meters squared), is widely used to identify the presence and severity of the excess of body adiposity [2]. The use of BMI as a measure of body adiposity comes with several limitations, including its inability to evaluate the distribution of body fat and the difference between lean and fat mass, potentially leading to under- or overestimation of obesity [3,4]. Nonetheless, BMI remains widely accepted due to its ease of use, consistency, and applicability in large-scale epidemiological studies [2].
Obesity increases morbidity and mortality and is a major risk factor for many chronic diseases [2]. Among these, it has been directly associated with 13 types of cancer, including breast cancer (BC) [5,6]. BC is a highly heterogeneous disease, including different subtypes characterized by different prevalence, clinical behavior, and prognosis [7]. Despite obesity has been associated with increased BC risk, the association with subtypes seems to be influenced by different factors, including menopausal status. While the excess of adiposity is a well-established risk factors for estrogen receptor (ER)-positive BC in postmenopausal women, evidence in premenopausal women is less clear. Moreover, data on other BC subtypes remain limited and controversial. To date, no systematic analysis has assessed the association between BMI and the risk of developing BC by subtypes and menopausal status.
We conducted a systematic review and meta-analysis aiming at investigating the association between BMI and the risk of developing BC according to subtypes and menopausal status.
Methods
2
Search strategy
2.1
A comprehensive literature search was performed from PubMed, Embase and Cochrane databases with no date restriction up to September 15, 2024. The full electronic search strategy is available in Supplementary Table 1. Titles and abstracts of the identified studies were independently reviewed by two reviewers (C.D. and L.A.), with any disagreement resolved through discussion with a third author (E.A.). Cross-referencing of relevant studies and review articles was conducted to ensure all pertinent studies were retrieved. Additionally, abstracts from major conferences from the past two years, including the American Society of Clinical Oncology (ASCO) Annual Meeting, European Society for Medical Oncology (ESMO) Congress, ESMO Breast Cancer Congress, and the San Antonio Breast Cancer Symposium (SABCS), were also retrieved to complement the search. Additionally, reference lists of selected studies were manually reviewed to identify further eligible articles. Only articles published in English were included.
This systematic review and meta-analysis was conducted according to Preferred Reporting Items for Systematic reviews and Meta-Analyses (PRISMA) guidelines [8] and was registered in the PROSPERO database with final registration number: CRD4202020610 [9].
Selection criteria and data extraction
2.2
Eligible studies had to fulfill the following criteria: (a) cohort or case-control studies that investigated the association between BMI and the risk of developing BC; (b) availability of information on specific BC subtypes (ER status and/or HER2 status); (c) the odds ratio (ORs) for risk of developing BC had to be reported or could be computed from the data reported in the manuscript. Only studies that categorized BMI according to the World Health Organization (WHO) classification i.e., under/normal weight (BMI<25 kg/m^2^), overweight (BMI 25–29.9 kg/m^2^), and obese (BMI≥30 kg/m^2^) were included in the analysis. Studies with less than 10 patients, including case reports and small case series, were excluded. Studies that did not provide ORs or studies from which ORs for specific outcomes could not be computed, were excluded from the analysis. The variables required for the analysis were extracted independently by two authors (C.D. and L.A.) from all included studies. The Newcastle-Ottawa Scale was employed to assess the quality of the data obtained and the risk of bias in each study (Supplementary Table 2) [10].
Study objectives
2.3
The primary objective of this meta-analysis was to investigate the association between BMI and the risk of developing BC according to subtypes. BC subtypes were first categorized based on ER status only, as ER status was reported in the greatest majority of the studies, as opposed to HER2 status that was reported only in a minority of the studies. Selection was conducted regardless of progesterone receptor status, since it was inconsistently reported across studies. Hence, we performed an initial analysis distinguishing BC in two main subtypes: ER-positive vs. ER-negative. Then, to add more granularity to our analysis, we included in the classification of BC subtypes also HER2 status; for this analysis, BC subtypes were classified in four (partially overlapping) categories: I) ER-positive BC, regardless of HER2 status; II) ER-negative BC, irrespective of HER2 status; III) HER2-positive BC, regardless of ER status; and IV) triple-negative breast cancer (TNBC), defined as both ER-negative and HER2-negative. All analyses were stratified by menopausal status, which was defined according to the specific criteria adopted in each included study. In postmenopausal women, a subgroup analysis examined the association of hormone replacement therapy (HRT) on the BMI and BC risk. In all studies included in this subgroup, HRT use was based on self-reported current or past exposure.
Statistical analysis
2.4
Pooled odds ratios (pORs) and 95 % confidence intervals (CIs) for each BMI category were calculated using the random-effects model with the DerSimonian and Laird method [11]. The heterogeneity across the studies was assessed by using Higgins' I^2^ index [12]. Sensitivity analyses were performed to determine the stability of the pOR estimates by recalculating them after excluding each single individual study. Publication bias was assessed with Egger's test [13]. All reported p-values are two-sided. All statistical analyses were performed using Stata, software version 16.1 (StataCorp LLC, College Station, TX, USA).
Results
3
Of the 2,841 records initially identified, 1,815 remained after duplicate removal. After screening, 1,633 records were excluded for the following reasons: from titles (n = 1,104), from abstract (n = 392), and not relevant conference proceedings (n = 137). The remaining 182 records were sought for full-text retrieval and subsequently assessed for eligibility. Of these, 149 records were excluded for not meeting the eligibility criteria, including the following reasons: no available information on BC subtypes (n = 34), no available information on BMI (n = 55), no available ORs or insufficient data to compute ORs (n = 17), and case reports/case series with fewer than 10 patients (n = 10).
Finally, 33 studies evaluating the association between overweight and obesity and the risk of BC according to subtype were considered eligible and included in the present meta-analysis [[14], [15], [16], [17], [18], [19], [20], [21], [22], [23], [24], [25], [26], [27], [28], [29], [30], [31], [32], [33], [34], [35], [36], [37], [38], [39], [40], [41], [42], [43], [44], [45], [46]] (Fig. 1). In Table 1, the main characteristics of each study are presented. Among these, 9 were cohort studies [17,21,24,26,29,31,34,43,45], including 1,964,229 women, and 24 were case-control studies [[14], [15], [16], [17], [18], [19], [20],22,23,25,27,28,30,32,33,[35], [36], [37], [38], [39], [40], [41], [42],44,46], including 138,952 women, regardless menopausal status. Some studies included only premenopausal [16,30] or postmenopausal women [14,15,17,[21], [22], [23],26,31,33,36,40,45], but most of studies included both [[18], [19], [20],24,25,[27], [28], [29],32,34,35,[37], [38], [39],[41], [42], [43], [44],46]. Of these studies, 20 were conducted in North America [14,[16], [17], [18], [19], [20], [21],24,[27], [28], [29], [30], [31],33,34,36,38,41,43,44], 5 in Europe [15,22,23,26,45], 4 in Asia [25,32,35,39], 1 in Latin America [46], 1 study in Oceania [40], 1 in Africa [42], while 1 study was multicontinental [37].Fig. 1PRISMA diagram of study selection.Fig. 1. Table 1Main characteristics of the studies included in the meta-analysis (reporting the total number of controls plus cases with known subtype).Table 1. First AuthorYearType of studyLocationMenopausal StatusAge, yearsSubtypesAssessment of weight/heightStudy populationLi CI et al. [14]2006Case-controlUSAPost-menopausal65–79ER+ER-Self-reported1,801Rosenberg LU et al. [15]2006Case-controlSwedenPost-menopausal50–74ER+ER-Postal questionnaire3,651Ma H et al. [16]2006Case-controlUSAPre-menopausal20–49ER+ER-Structured questionnaire conducted by qualified stuff.1,679Chlebowski RT et al. [17]2007Cohort studyUSAPost-menopausal50–79ER+ER-Self-reported146,144Millikan RC et al. [18]2007Case-controlUSAPre- and post-menopausal20–74Luminal ABasal-like (TNBC)In-person interviews by trained nurses.2,966Slattery ML et al. [19]2007Case-controlUSAPre- and post-menopausal25–79ER+ER-Interviewer-administered computerized questionnaire3,991Berstard P et al. [20]2010Case-controlUSAPre- and post-menopausal35–64ER+ER-Interview in person using a structured questionnaire6,831Phipps AI et al. [21]2011Cohort studyUSAPost-menopausal50–79ER+TNBCSelf-reported height and weight152,126Barnes B et al. [22]2011Case-controlGermanyPost-menopausal50–74ER+ER-Face-to-face interviews with trained interviewers.9,362Cerne JZ et al. [23]2012Case-controlSloveniaPost-menopausal50–69ER+ER-HER2+HER2-Postal questionnaire1,350Phipps AI et al. [24]2012Cohort studyUSAPre- and post-menopausal40–84ER+HER2+ (ER-)TNBCMeasured by self-administeredquestionnaires554,886Kawai M et al. [25]2013Case-controlJapanPre- and post-menopausal>30ER+ER-Self-administered questionnaire survey3,559Horn J et al. [26]2014Cohort studyNorway (norwegian women)Post-menopausal>55Luminal A,Luminal B (HER2+/−)HER2+basal-like (TNBC)Five-negative phenotype (5NP)Collected through standardized questionnaire carried out by physicians.19,296Robinson W et al. [27]2014Case-controlUSAPre- and post-menopausal20–74ER+ER-Collected by trained nurses2,610Bandera EV et al. [28]2015Case-controlUSAPre- and post-menopausalER+ER-TNBCMedical records and cancer registry data.12,263White AJ et al. [29]2015Cohort studyUSAPre- and post-menopausal35–74ER+ER-Measured during home visits by trained study personnel253,202John EM et al. [30]2015Case-controlUSAPre-menopausal40–59ER+ER-Measured by trained interviewers2,238Neuhouser ML et al. [31]2015Cohort studyUSAPost-menopausal50–79ER+ER-HER2+TNBCMeasured at baseline by trained nurses.62,583Nagrani R et al. [32]2016Case-controlIndiaPre- and post-menopausal20–69ER+ER-TNBCInterview conducted by qualified stuff2,727John EM et al. [33]2016Case-controlUSAPost-menopausal35–79ER+ER-Measured by trained interviewers.5,337Kerlikowske K et al. [34]2017Cohort studyUSAPre- and post-menopausal35–74ER+ER-Medical records and cancer registry data723,451Wang F et al. [35]2017Case-controlChinaPre- and post-menopausal25–70ER+ER-collected from face-to-face interviews based on aself-designed structured questionnaire.2,678McClain KM et al. [36]2017Case-controlUSAPost-menopausal/Luminal-like (ER/PR+)Self-reported1,352Rudolph A et al. [37]2018Case-controlMulticontinentalPre- and post-menopausal/ER+ER-Medical Records5,928Ma H et al. [38]2018Case-controlUSAPre- and post-menopausal35–64Luminal-likeHER2+ (ER-/Pgr-)TNBCcollected by trained staff in standardized in-person interviews5,169Jeong SH et al. [39]2019Case-controlSouth KoreaPre- and post-menopausal35–80Luminal ALuminal BHER2+Triple negativeSelf-reported48,570Dashti GS et al. [40]2019Case-controlAustraliaPost-menopausal40–69ER+Nurses at dedicated recruitment clinics1,178Williams L et al. [41]2019Case-controlUSAPre- and post-menopausal20–74Luminal AMeasured by a trained nurse at the time of interview1,570Akinyemiju T et al. [43]2021Case-controlNigeriaPre- and post-menopausal/Luminal ALuminal BHER+TNBCObtained by the research nurse at enrolment455Friebel-Klingner TM et al. [43]2021Cohort studyUSAPre- and post-menopausal40–84Luminal-likeTNBCMedical Records21,031Hossain FM et al. [44,45]2022Case-controlUSAPre- and post-menopausal>20Luminal ALuminal BHER+TNBCFrom patient records.11,074Klintman M et al. [45]2022Cohort studySwedenPost-menopausal30–80Luminal ALuminal BHER+TNBCSelf-reported31,510Gomes K et al. [46]2022Case-controlBrazilPre- and post-menopausal>18Luminal ALuminal BHER+TNBCMedical Records613
Association between BMI and risk of BC in all women (pre and postmenopausal)
3.1
In the overall population, including both pre- and postmenopausal women, obesity was associated with a modestly increased risk of developing ER-positive BC (pOR 1.13, 95 % CI 1.03–1.24, p = 0.008), while this association was not statistically significant for women who were overweight (pOR 1.05; 95 % CI 0.98–1.12) (Fig. 2). There was substantial heterogeneity among studies in both analyses (I^2^ = 82.0 % for overweight and 88.3 % for obesity). No evidence of publication bias was detected (Egger's test: p = 0.303 for overweight, p = 0.940 for obesity).Fig. 2. Forest plot displaying the pooled odds ratios for the association between overweight (a) and obesity (b) and the risk of ER-positive breast cancer, compared to underweight/normal weight, in the overall population.Fig. 2
No statistically significant association was found between being overweight or obese and risk of developing ER-negative BC (pOR 1.05; 95 % CI 0.98–1.13 and pOR 1.04; 95 % CI 0.93–1.17, respectively) (Fig. 3). Detailed sensitivity analyses are reported in Supplementary Tables 3–6.Fig. 3. Forest plot displaying the pooled odds ratios for the association between overweight (a) and obesity (b) and the risk of ER-negative breast cancer, compared to underweight/normal weight, in the overall population.Fig. 3
Regarding the HER2-positive BC subtype, 10 studies were included in the analysis (n = 735,506). Women who were overweight were associated with increased risk of HER2-positive BC (pOR 1.09; 95 % CI 1.02–1.16, p = 0.010) while no statistically significant association was found for women with obesity (pOR 1.03; 95 % CI 0.84–1.25) (Supplementary Fig. 1). Detailed sensitivity analyses are presented in Supplementary Tables 7–8.
Regarding TNBC, 13 studies (n = 862,686) were analyzed; no statistically significant association was found between being overweight or obese and the risk of developing TNBC (pOR 1.06; 95 % CI 0.92–1.23 and pOR 1.05; 95 % CI 0.82–1.34, respectively) (Supplementary Fig. 2 and Supplementary Tables 9–10).
Association between BMI and risk of BC in postmenopausal women
3.2
The association between BMI and BC in postmenopausal women was assessed in 22 articles (n = 1,077,949). Overweight/obesity were significantly associated with a moderate increased ER-positive BC risk (pORs 1.14; 95 % CI 1.06–1.22, p < 0.001 for overweight and 1.29; 95 % CI 1.18–1.41, p < 0.001 for obesity) (Fig. 4, Supplementary Tables 11–12). Moderate-to-substantial heterogeneity was found in both analyses (I^2^ = 67.9 % for overweight and 74 % for obesity). No publication bias was detected (Egger's test: p = 0.818 for overweight, p = 0.467 for obesity).Fig. 4. Forest plot displaying the pooled odds ratios for the association between overweight (a) and obesity (b) and the risk of ER-positive breast cancer, compared to underweight/normal weight, in postmenopausal women.Fig. 4
No significant association was observed between overweight/obesity and ER-negative BC risk (pOR 1.04; 95 % CI 0.97–1.11 and pOR 1.02; 95 % CI 0.90–1.16, respectively) (Supplementary Fig. 3, Supplementary Tables 13–14).
Seven studies (n = 723,364) evaluated the association between obesity and overweight and HER2-positive BC in postmenopausal women. Overweight was associated with increased HER2-positive BC risk (pOR 1.13; 95 % CI 1.05–1.22, p = 0.002), but this association was not significant for obesity (pOR 1.19; 95 % CI 0.99–1.43) (Supplementary Fig. 4, Supplementary Tables 15–16)
Nine studies (n = 829,513) evaluated the association between overweight/obesity and TNBC; we observed no statistically significant association (pORs 1.05; 95 % CI 0.88–1.25 and 1.01; 95 % CI 0.72–1.42, respectively) (Supplementary Fig. 5, Supplementary Tables 17–18).
Association between BMI and risk of BC in postmenopausal women according to use of hormone replacement therapy
3.3
Four studies (n = 610,426) evaluated the association of BMI and BC risk among postmenopausal women according to HRT use. Among HRT-users, obesity was associated with higher ER-positive BC risk (pOR 1.22; 95 % CI 1.01–1.49, p = 0.047), while this association was not statistically significant for overweight (pOR 1.11; 95 % CI 0.94–1.32). For ER-negative BC, women who were HRT users and overweight showed an increased ER-negative BC risk (pOR 1.17; 1.02–1.35, p = 0.023), while this association was not statistically significant for obesity (pOR 1.10; 95 % CI 0.82–1.46).
Among non-HRT users, obesity was associated with increased ER-positive BC risk (pOR 1.66; 1.17–2.36, p = 0.004) while this association was not significant for overweight (pOR 1.23; 95 % CI 0.98–1.56). Women non-HRT users who were overweight had an increased ER-negative BC risk (pOR 1.21; 95 % CI 1.03–1.42, p = 0.024), while this association was not significant for obesity (pOR 1.11; 95 % CI 0.62–2.01).
Association between BMI and risk of BC in premenopausal women
3.4
Twelve studies, including 646,176 premenopausal women, evaluated the association between overweight and obesity with ER-positive BC. Overweight was associated with lower ER-positive BC risk (pOR 0.80; 95 % CI 0.71–0.91, p = 0.001). A numerically lower risk of ER-positive BC was also observed among women with obesity; however, this association was not statistically significant (pOR 0.88; 95 % CI 0.76–1.02) (Fig. 5). Detailed sensitivity analyses are reported in Supplementary Tables 19–20. There was moderate heterogeneity among studies in both analyses (I^2^ = 72.8 % for overweight and 73.9 % for obesity). No evidence of publication bias was detected (Egger's test: p = 0.148 for overweight, p = 0.714 for obesity).Fig. 5. Forest plot displaying the pooled odds ratios for the association between overweight (a) and obesity (b) and the risk of ER-positive breast cancer, compared to underweight/normal weight, in premenopausal women.Fig. 5
Premenopausal women who were overweight showed an increased ER-negative BC risk (pOR 1.15; 95 % CI 1.05–1.26, p = 0.002). While a numerically increased risk of ER-negative BC was observed for women with obesity, the association was not significant (pOR 1.11; 95 % CI 0.95–1.29) (Supplementary Fig. 6, Supplementary Tables 21–22)
Three studies (n = 608,625) assessed the association between obesity and overweight and HER2-positive BC. No significant association was found between being overweight or obese and the risk of developing HER2-positive BC (pOR 1.02; 95 % CI 0.91–1.14 and pOR 1.09; 95 % CI 0.89–1.33, respectively) (Supplementary Fig. 7, Supplementary Tables 23–24).
Six studies (n = 626,581) evaluated the association between overweight and obesity and TNBC. Being overweight was associated with an increased risk of TNBC (pOR 1.30; 95 % CI 1.15–1.47, p < 0.001) while this association was not statistically significant for women with obesity (pOR 1.23; 95 % CI 0.95–1.58) (Supplementary Fig. 8, Supplementary Tables 25–26)
Sensitivity analysis and risk of bias assessment
4
The sensitivity analysis confirmed the consistency of our findings. This analysis showed that the pooled effect size of the association between BMI and BC risk remained stable with the individual exclusion of each study at a time. Supplementary Table 2 report the quality of data and risk of bias assessment for each study, based on Newcastle-Ottawa Scale. Each study was judged on three broad perspectives: the selection of the study groups; the comparability of the groups; and the ascertainment of the outcome of interest. Sixteen studies received a full score.
Discussion
5
In this large meta-analysis, including more than 2 million women, obesity was associated with increased risk of ER-positive BC. Notably, this association was mainly driven by the postmenopausal status, where we observed a stronger association between high BMI and risk of developing ER-positive BC. Conversely, we found in premenopausal women an inverse association between BMI and risk of ER-positive BC, with a reduced ER-positive BC risk among women who were overweight. Overall, the magnitude of the observed associations was moderate.
Higher BMI is an acknowledged risk factor for BC [47]. However, since BC is a biologically and clinically heterogeneous disease, this association may vary across all BC subtypes or patient subgroups, especially by menopausal status. A dose-response meta-analysis previously showed that each 5 kg/m^2^ BMI increase raised BC risk by 2 % [48]. However, that analysis did not account for BC subtypes and/or menopausal status. In our study, in postmenopausal women we found that overweight and obesity were associated with 1.14-fold and 1.29-fold higher ER-positive BC risk, respectively, while we found no significant association for other BC subtypes. Estrogen-driven mechanisms play a key role in affecting the risk of BC [49]. After menopause, the reduction of ovarian estrogens is paralleled by an increased peripheral endogenous estrogens production [50]. Adipose tissue, rich in aromatase that converts androgens into estrogens, represents the primary source of estrogen in postmenopausal women [51]. Excess of adiposity results in a rise in blood estrogen levels, which may contribute to the development of estrogen-driven BC [52]. In addition, obesity-associated insulin resistance, is linked to a reduction in sex hormone-binding globulin (SHBG) [53], which normally limits the bioavailability of sex hormones by binding and sequestering them. SHBG reduction leads to an increase of sex hormone bioavailability, further contributing to increase estrogen levels in the body [54].
In our meta-analysis, obesity was associated with an increased ER-positive BC risk both in HRT users and non-users, suggesting it might represent an independent risk factor for BC development. While data on the interaction between HRT use, obesity, and BC risk are limited, some findings suggest that the contribution of HRT use in increasing BC risk may be less relevant in women with obesity, possibly due to already higher blood estrogen levels [55]. These findings should be interpreted cautiously, as the search strategy was not specifically designed to investigate HRT use.
Consistent to previous studies [48,56], and in contrast to what has been observed in the postmenopausal population, our findings revealed an inverse association between BMI and the risk of developing ER-positive BC in premenopausal women. Specifically, premenopausal women who were overweight had a significant reduction in the risk of ER-positive BC; we also found a trend towards lower risk was also observed in women with obesity, although it did not reach the statistical significance. Before menopause, estrogens are mainly produced by the ovaries under the stimulation of gonadotropins, while the contribution of fat tissue to blood estrogen levels is less relevant compared to what happens in postmenopausal women. Elevated levels of circulating estrogens exert negative feedback on the hypothalamus-pituitary axis, leading to reduced gonadotropin secretion, gonadal stimulation and, ultimately, estrogen production [57,58]. This is the reason why high adiposity may result in irregular and anovulatory menstrual cycles in premenopausal women, thus reducing the exposure of normal epithelial cells in the breast, or BC precursors, to extracellular estrogens [57]. The complex interplay of estrogen pathways and inflammation according to menopausal status may contribute to explain the observed inverse association between BMI and BC risk in premenopausal women [59]. Estrone is the primary estrogen hormone produced after menopause, whereas 17β-estradiol predominates before menopause. These hormones have two opposing effects: while 17β-estradiol exerts anti-inflammatory effects, estrone induces systemic inflammation, potentially contributing to the development and progression of ER-positive BC [59,60].
This meta-analysis showed that being overweight during premenopausal is associated with an increased risk of ER-negative BC (regardless of HER2 status) and TNBC. A trend toward higher risk in premenopausal women with obesity did not reach significance. Estrogen-independent pathways may contribute to BC risk. Excess of adiposity promotes the secretion of pro-inflammatory cytokines and chemokines, leading to a chronic, low-grade inflammation, thus playing a crucial role in promoting BC carcinogenesis [61,62]. Adipokines are produced by the adipose tissue, and they play a crucial role in modulating systemic metabolism, inflammation and insulin sensitivity [63]. In subject with obesity, leptin levels are typically elevated, while adiponectin levels are reduced, and this imbalance may contribute to increased systemic inflammation [64,65]. This inflammation may also worsen systemic insulin resistance, increasing the secretion of insulin and the associated growth factors which have been linked to increase the risk of BC.
In the overall population included in this meta-analysis, especially in postmenopausal women, overweight was associated with an increased risk of HER2-positive BC. HER2-positive BC was classified irrespective of ER status, due to under-reporting in the original studies. This limitation should be considered when interpreting our results. While the impact of BMI on HER2-positive BC risk must be investigated in more detail in future studies, available evidence suggests that the association between high adiposity and survival outcomes may differ according to disease setting [66].
Obesity is a multifactorial condition involving genetic, environmental, psychological and behavioral factors [2,9]. Weight stigma may worsen mental and physical health beyond the metabolic factors associated with obesity, thus potentially worsening unhealthy eating habits and inactivity [2]. Lifelong strategies aiming to support the achievement and maintenance of healthy weight should be actively promoted to reduce BC risk [67]. Although higher BMI seems to be associated with a reduced BC risk in premenopausal women, we would like to highlight the fact that an excess of adiposity before the age of menopause often persists or worsens after menopause, thus becoming a well-known risk factor for the development of BC and other important chronic diseases, including cardiovascular, cerebrovascular and neurological ones. While weight control is not the only preventive measure for BC, we acknowledge its importance as part of a broader strategy for prevention.
Our study has some limitations that should be acknowledged. First, most of included studies were retrospective, with the inherent limitations of this design. Second, significant heterogeneity was observed, reflecting variability in study design and their participant characteristics: not all the studies reported the association between BMI and BC risk according to menopausal status, known to play a major role in this association; most studies considered only the expression of ER to classify tumor subtypes (i.e., ER positive vs. ER negative) while HER2 status was frequently not reported or not stratified according to ER expression, in the context of potential heterogeneous methodologies, and scoring systems across studies, limiting our ability to analyze other BC subtypes; in more than half of the studies, BMI relied on self-reported weight and height, thus implying a potential self-report bias. Additionally, BMI may vary over time, and reliance on a single time-point measurement does not capture longitudinal changes in body weight which may influence the observed associations. While alternative measures of adiposity to BMI may provide a more accurate assessment of fat distribution, their limited availability across studies precluded their inclusion in this meta-analysis. Moreover, this meta-analysis included studies conducted across different countries, thereby capturing heterogeneous populations and healthcare contexts. However, most of the available evidence originated from high-income regions, which may limit the generalizability of our findings to populations from low- and middle-income settings.
On the other hand, our meta-analysis has several strengths: it includes a large cohort of more than 2 million women, thus representing the largest and most up-to-date meta-analysis on this topic so far, providing a comprehensive evaluation of the role of BMI according to not only BC subtypes, but also menopausal status. Our work reports extensive and updated data that are relevant to inform prevention strategies targeting obesity as a risk factor for oncologic and metabolic diseases.
Conclusion
6
Obesity was associated with moderate higher ER-positive BC risk. This association appeared to be mainly driven by postmenopausal women. In contrast, among premenopausal women, BMI showed divergent associations by BC subtype, with higher risk observed for ER-negative disease. These results likely reflect the different hormonal status in pre- and postmenopausal women. Maintaining a healthy body weight remains essential throughout life.
Funding
This study did not receive any funding.
CRediT authorship contribution statement
Chiara Dauccia: Writing – review & editing, Writing – original draft, Conceptualization. Marco Bruzzone: Writing – review & editing, Formal analysis. Luca Arecco: Writing – review & editing. Eva Blondeaux: Writing – review & editing, Methodology, Formal analysis. Marianna Sirico: Writing – review & editing. Riccardo Gerosa: Writing – review & editing. Maria Alice Franzoi: Writing – review & editing, Conceptualization. Mariana Brandão: Writing – review & editing, Conceptualization. Lorenzo Perrone: Writing – review & editing. Paolo Pedrazzoli: Writing – review & editing. Christine Desmedt: Writing – review & editing. Serena Di Cosimo: Writing – review & editing. Claudio Vernieri: Writing – review & editing. Laetitia Collet: Writing – review & editing. Matteo Lambertini: Writing – review & editing. Evandro de Azambuja: Writing – review & editing, Visualization, Supervision. Elisa Agostinetto: Writing – review & editing, Validation, Supervision.
Competing interests
LA: travel grant from AstraZeneca. Research funding to his Institution from Gilead.
EB: speaker fee from Eli Lilly, research funding (to the institution) from Gilead.
MAF: research funding: Resilience (Institution), Speaker honoraria: Novartis.
LC: Meeting/travel grants from Astra-Zeneca, GSK, Pharmamar; speaker honoraria from Astra-Zeneca and GSK.
RG: Meeting/travel grants from Novartis and Daiichi Sankyo.
MB:(all to Institution): Advisory board for Janssen, Sanofi, Pierre-Fabre, Daichii, Pfizer, Boeringher and Amgen. Speaker fee from AstraZeneca, BMS, Janssen, Takeda, MSD, Pfizer. Is/was investigator for AstraZeneca, Boeringher, Merus, Merck, Roche/GNE, Sanofi, iTeos, Pierre-Fabre. Travel grant from Takeda, Sanofi, AstraZeneca, Roche. Consultancy for AstraZeneca.
SDC: Given her role as Speciality Editor, Serena Di Cosimo had no involvement in the peer-review of this article and has no access to information regarding its peer-review. Full responsibility for the editorial process for this article was delegated to another journal editor.
CV: advisory role for Eli Lilly, Novartis, Astra Zeneca, Pfizer, Daiichi Sankyo, Menarini Stemline; speaker honoraria from Eli Lilly, Novartis, Pfizer, Daiichi Sankyo, Menarini Stemline, MSD, Astra Zeneca, Istituto Gentili, Accademia Nazionale di Medicina; research funding from AIRC, ERC, Ministero della Salute, Roche and Daiichi Sankyo/Astra Zeneca outside the submitted work.
ML: advisory role for Roche, Lilly, Novartis, Astrazeneca, Pfizer, Seagen, Gilead, MSD, Exact Sciences, Pierre Fabre, Menarini; speaker honoraria from Roche, Lilly, Novartis, Pfizer, Sandoz, Libbs, Daiichi Sankyo, Takeda, Menarini, AstraZeneca; travel Grants from Gilead, Daiichi Sankyo, Roche; research funding (to the Institution) from Gilead all outside the submitted work.
EdA: Financial: Honoraria and/or advisory board from Roche/GNE, Novartis, SeaGen, Zodiac, Libbs, Pierre Fabre, Lilly, Astra-Zeneca, MSD, Gilead Sciences; Travel grants from Astra-Zeneca and Gilead; Research grant to my institution from Roche/GNE, Astra-Zeneca, GSK/Novartis, Gilead Sciences and Seagen/Pfizer; Non-financial: ESMO director of Membership 2023–2025; BSMO President 2023–2026.
EA: advisory role and/or honoraria from Eli Lilly, AstraZeneca, Bayer, Abscint, Gilead, Novartis; research grant to her institution from Gilead BeLux; meeting/travel grants from Novartis, Roche, Eli Lilly, Daiichi Sankyo, AstraZeneca, Abscint, Menarini, Gilead (all outside the submitted work).
All remaining authors have declared no conflicts of interest.
Data availability statement
All data analyzed in this meta-analysis were extracted from previously published, peer-reviewed studies that are publicly available. The datasets supporting the findings of this study can be accessed through the original articles, all of which are cited in the reference list.
The reference list from the paper itself. Each links out to its DOI / PubMed record.
- 1Phelps N.H.Singleton R.K.Zhou B.Worldwide trends in underweight and obesity from 1990 to 2022: a pooled analysis of 3663 population-representative studies with 222 million children, adolescents, and adults Lancet 40320241043110.1016/S 0140-6736(23)02750-2PMC 761576938432237 · doi ↗ · pubmed ↗
- 2Rubino F.Cummings D.E.Eckel R.H.Definition and diagnostic criteria of clinical obesity Lancet Diabetes Endocrinol 202510.1016/S 2213-8587(24)00316-4Published online January 9PMC 1187023539824205 · doi ↗ · pubmed ↗
- 3Sperrin M.Marshall A.D.Higgins V.Renehan A.G.Buchan I.E.Body mass index relates weight to height differently in women and older adults: serial cross-sectional surveys in England (1992-2011)J Public Health 383201610.1093/pubmed/fdv 067PMC 507215526036702 · doi ↗ · pubmed ↗
- 4Romero-Corral A.Somers V.K.Sierra-Johnson J.Accuracy of body mass index in diagnosing obesity in the adult general population Int J Obes 326200810.1038/ijo.2008.11PMC 287750618283284 · doi ↗ · pubmed ↗
- 5Arnold M.Pandeya N.Byrnes G.Global burden of cancer attributable to high body-mass index in 2012: a population-based study Lancet Oncol 1612015364610.1016/S 1470-2045(14)71123-425467404 PMC 4314462 · doi ↗ · pubmed ↗
- 6Pati S.Irfan W.Jameel A.Ahmed S.Shahid R.K.Obesity and cancer: a current overview of epidemiology, pathogenesis, outcomes, and management Cancers (Basel)152202310.3390/cancers 15020485 PMC 985705336672434 · doi ↗ · pubmed ↗
- 7Anderson W.F.Rosenberg P.S.Prat A.Perou C.M.Sherman M.E.How many etiological subtypes of breast cancer: two, three, four, or more?J Natl Cancer Inst 1068201410.1093/jnci/dju 165PMC 414860025118203 · doi ↗ · pubmed ↗
- 8Page M.J.Mc Kenzie J.E.Bossuyt P.M.The PRISMA 2020 statement: an updated guideline for reporting systematic reviews Br Med J 372202110.1136/bmj.n 71PMC 800592433782057 · doi ↗ · pubmed ↗