Early hypoxia prediction in diseased patients via wheezing sounds in respiration: a prospective cohort study
Chun-Hsiang Huang, Cheng-Yi Fan, Chi-Hsin Chen, Chih-Wei Sung, Ching-Yu Chen, Shao-Yung Lin, Jing-Tong Tzeng, Chi-Chun Lee, Andrew Sheed, Eric H. Chou, Edward Pei-Chuan Huang

TL;DR
This study shows that wheezing breath sounds can predict the need for oxygen in emergency patients, helping doctors act faster.
Contribution
The study demonstrates that wheezing sounds are an independent predictor of increased oxygen demand in emergency patients.
Findings
Wheezing breath sounds were independently linked to higher oxygen demand in emergency patients.
A prediction model using wheezing and other factors achieved an AUROC of 0.791 for oxygen demand.
Wheezing and triage oxygen saturation were also associated with ICU admission.
Abstract
Early detection of hypoxia in the emergency room may reduce complications. Breath sounds can be evaluated immediately. Our research endeavors to investigate the relationship between breath sounds and oxygen demand. We recruited patients from the emergency department. Respiratory sounds in four locations were recorded with an electronic stethoscope and classified into normal, wheezing, or crackles. The primary outcome was increased oxygen demand (IOD) in the emergency room, and the secondary outcome was intensive care unit (ICU) admission. The prediction model was evaluated by logistic regression model. Overall, 2,216 patients were recruited, and 171 (7.7%) had IOD. Through multivariable logistic regression, independent predictive factors for IOD were age (odds ratio [OR]: 1.02, 95% confidence interval [CI]: 1.01–1.03), lung cancer (OR: 3.56, 95% CI: 1.99–6.36), triage respiratory rate…
Genes, proteins, chemicals, diseases, species, mutations and cell lines named across the full text — each resolved to its canonical identifier and authoritative record.
Click any figure to enlarge with its caption.
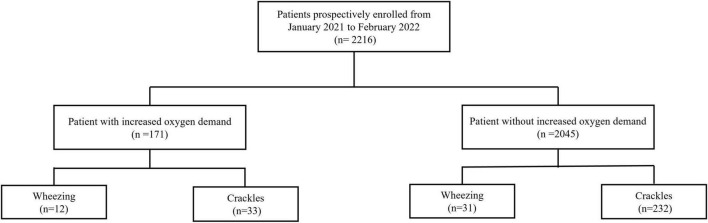 FIGURE 1
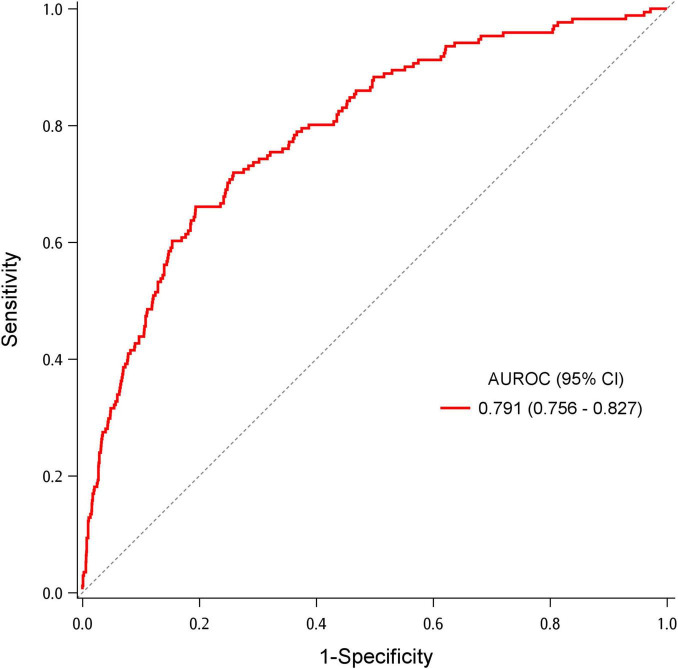 FIGURE 2
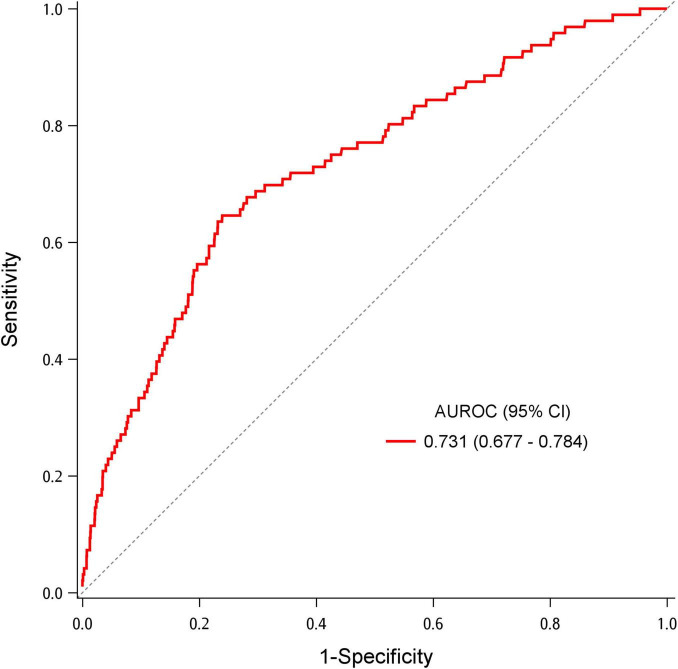 FIGURE 3
| Variables | All patients | Without IOD | With IOD |
|
|---|---|---|---|---|
| Age (years) | 61.7 ± 19.2 | 60.8 ± 19.3 | 72.0 ± 14.3 | < 0.001 |
| Sex (male) | 1,169(52.8) | 1,073(52.5) | 96(56.1) | 0.356 |
| BMI (kg/m2) | 23.9 ± 4.1 | 24.0 ± 4.1 | 23.1 ± 4.0 | 0.006 |
|
| ||||
| Hypertension | 982(44.3) | 869(42.5) | 113(66.1) | < 0.001 |
| Coronary artery disease | 228(10.3) | 189(9.2) | 39(22.8) | < 0.001 |
| Congestive heart failure | 118(5.3) | 96(4.7) | 22(12.9) | < 0.001 |
| Diabetic mellitus | 613(27.7) | 547(26.7) | 66(38.6) | 0.001 |
| Chronic kidney disease | 183(8.3) | 156(7.6) | 27(15.8) | < 0.001 |
| Cerebrovascular accident | 146(6.6) | 116(5.7) | 30(17.5) | < 0.001 |
| COPD | 97(4.4) | 75(3.7) | 22(12.9) | < 0.001 |
| Asthma | 96(4.3) | 85(4.2) | 11(6.4) | 0.160 |
| Lung cancer | 87(3.9) | 64(3.1) | 23(13.5) | < 0.001 |
| Other cancer | 291(13.1) | 259(12.7) | 32(18.7) | 0.025 |
| Never smoker | 1796(81.1) | 1678(82.1) | 118(69.0) | < 0.001 |
|
| ||||
| Body temperature (°C) | 36.8 ± 0.7 | 36.8 ± 0.7 | 36.9 ± 1.1 | 0.040 |
| Pulse rate (beats per minute) | 90.6 ± 21.5 | 89.9 ± 20.8 | 99.1 ± 26.7 | < 0.001 |
| Respiratory rate (breaths per minute) | 21.1 ± 6.0 | 20.9 ± 6.1 | 23.4 ± 4.6 | < 0.001 |
| Systolic blood pressure (mmHg) | 146.1 ± 54.2 | 146.4 ± 55.4 | 143.1 ± 37.1 | 0.284 |
| Diastolic blood pressure (mmHg) | 80.6 ± 16.9 | 80.7 ± 16.6 | 79.4 ± 20.4 | 0.432 |
| SpO2 (%) | 96.2 ± 4.1 | 96.4 ± 3.8 | 93.3 ± 6.4 | < 0.001 |
|
| ||||
| White blood cell (K) | 9.4 ± 4.3 | 9.2 ± 4.0 | 11.5 ± 7.0 | < 0.001 |
| Neutrophilic granulocyte (%) | 73.8 ± 16.3 | 73.4 ± 16.6 | 78.1 ± 11.8 | < 0.001 |
| Hemoglobin (mg/dL) | 12.6 ± 3.7 | 12.6 ± 3.0 | 12.0 ± 8.3 | 0.344 |
| Creatinine (mg/dL) | 1.7 ± 4.2 | 1.7 ± 4.4 | 1.9 ± 2.2 | 0.385 |
| hsCRP (mg/dL) | 4.5 ± 4.4 | 4.3 ± 4.0 | 6.6 ± 7.6 | < 0.001 |
| Lactic acid (mmol/L) | 2.2 ± 1.0 | 2.1 ± 0.8 | 2.4 ± 2.0 | 0.060 |
| NTproBNP (pg/mL) | 4923.3 ± 3524.9 | 4902.9 ± 3312.2 | 5167.9 ± 5470.1 | 0.533 |
|
|
|
|
|
|
| Right upper lung | 31(1.4) | 21(1.0) | 10(5.8) | < 0.001 |
| Left upper lung | 25(1.1) | 15(0.7) | 10(5.8) | < 0.001 |
| Right lower lung | 20(0.9) | 12(0.6) | 8(4.7) | < 0.001 |
| Left lower lung | 20(0.9) | 12(0.6) | 8(4.7) | < 0.001 |
|
|
|
|
|
|
| Right upper lung | 109(4.9) | 93(4.5) | 16(9.4) | 0.005 |
| Left upper lung | 146(6.6) | 126(6.2) | 20(11.7) | 0.005 |
| Right lower lung | 108(4.9) | 93(4.5) | 15(8.8) | 0.014 |
| Left lower lung | 85(3.8) | 75(3.7) | 10(5.8) | 0.154 |
|
|
| |||
| Room air | 1984(89.5) | 1831(89.5) | 153(89.5) | |
| Nasal cannula | 153(6.9) | 142(6.9) | 11(6.4) | |
| Simple mask/collar mask | 51(2.3) | 44(2.2) | 7(4.1) | |
| Non-rebreathing mask | 26(1.2) | 26(1.3) | 0(0) | |
| Non-invasive ventilation | 1(< 0.1) | 1(< 0.1) | 0(0) | |
| Invasive mechanical ventilation | 1(< 0.1) | 1(< 0.1) | 0(0) | |
|
|
| |||
| Room air | 1831(82.6) | 1831(89.5) | 0(0) | |
| Nasal cannula | 259(11.7) | 142(6.9) | 117(68.4) | |
| Simple mask/collar mask | 70(3.2) | 44(2.2) | 26(15.2) | |
| Non-rebreathing mask | 46(2.1) | 26(1.3) | 20(11.7) | |
| Non-invasive ventilation | 5(0.2) | 1(< 0.1) | 4(2.3) | |
| Invasive mechanical ventilation | 5(0.2) | 1(< 0.1) | 4(2.3) | |
|
|
| |||
| Respiratory | 223(10.1) | 164(8.0) | 59(34.5) | |
| Cardiovascular | 315(14.2) | 289(14.1) | 26(15.2) | |
| Gastroenterological | 465(21.0) | 450(22.0) | 15(8.8) | |
| Neurological | 335(15.1) | 325(15.9) | 10(5.8) | |
| Infectious | 264(11.9) | 233(11.4) | 31(18.1) | |
| Nephrological | 99(4.5) | 90(4.4) | 9(5.3) | |
| Others | 515(23.2) | 494(24.2) | 21(12.3) | |
| ICU admission | 96(4.3) | 54(2.6) | 42(24.6) | < 0.001 |
| Hospital admission | 856(38.6) | 710(34.7) | 146(85.4) | < 0.001 |
| Univariable analysis | Multivariable analysis | |||
|---|---|---|---|---|
| Variables | OR (95% CI) |
| aOR (95% CI) |
|
| Age (years) | 1.04 (1.03–1.05) | < 0.001 | 1.02 (1.01–1.03) | 0.002 |
| Sex (male) | 1.16 (0.85–1.59) | 0.356 | ||
| BMI (kg/m2) | 0.95 (0.91-0.98) | 0.006 | 0.98 (0.94-1.02) | 0.344 |
|
| ||||
| Hypertension | 2.64 (1.90-3.66) | < 0.001 | 1.73 (1.15–2.59) | 0.008 |
| Coronary artery disease | 2.90 (1.97–4.27) | < 0.001 | 1.90 (1.21–2.99) | 0.006 |
| Congestive heart failure | 3.00 (1.83–4.90) | < 0.001 | 1.32 (0.74–2.34) | 0.348 |
| Diabetic mellitus | 1.72 (1.25–2.38) | 0.001 | 1.05 (0.73–1.53) | 0.787 |
| Chronic kidney disease | 2.27 (1.46–3.53) | < 0.001 | 1.16 (0.69–1.93) | 0.574 |
| Cerebrovascular accident | 3.54 (2.29-5.47) | < 0.001 | 2.13 (1.31–3.47) | 0.002 |
| Chronic obstructive pulmonary disease | 3.88 (2.34–6.42) | < 0.001 | 1.28 (0.70–2.33) | 0.425 |
| Asthma | 1.59 (0.83–3.03) | 0.164 | ||
| Lung cancer | 4.81 (2.90-7.97) | < 0.001 | 3.56 (1.99-6.36) | < 0.001 |
| Other cancer | 1.59 (1.06–2.38) | 0.026 | 1.24 (0.80-1.92) | 0.329 |
|
| ||||
| Body temperature (°C) | 1.32 (1.09–1.59) | 0.004 | 1.08 (0.88–1.31) | 0.462 |
| Pulse rate (beats per minute) | 1.02 (1.01–1.02) | < 0.001 | 1.02 (1.01–1.02) | < 0.001 |
| Respiratory rate (breaths per minute) | 1.04 (1.02–1.06) | 0.001 | 1.02 (1.00–1.04) | 0.052 |
| Systolic blood pressure (mmHg) | 1.00 (0.99–1.00) | 0.400 | ||
| Diastolic blood pressure (mmHg) | 1.00 (0.99–1.01) | 0.349 | ||
| SpO2 (%) | 0.90 (0.87–0.92) | < 0.001 | 0.95 (0.92–0.98) | < 0.001 |
| Wheezing | 4.91 (2.47–9.74) | < 0.001 | 2.87 (1.31–6.29) | 0.008 |
| Crackles | 1.87 (1.25–2.80) | 0.002 | 1.06 (0.67–1.67) | 0.805 |
| Variables | Univariable analysis | Multivariable analysis | ||
|---|---|---|---|---|
| OR (95% CI) |
| aOR (95% CI) |
| |
| Age (years) | 1.03 (1.02–1.04) | < 0.001 | 1.02 (1.00–1.03) | 0.043 |
| Sex (male) | 1.27 (0.84–1.92) | 0.264 | ||
| BMI (kg/m2) | 1.01 (0.96–1.06) | 0.666 | ||
|
| ||||
| Hypertension | 1.81 (1.19–2.73) | 0.005 | 0.85 (0.52–1.39) | 0.504 |
| Coronary artery disease | 4.66 (2.96–7.32) | < 0.001 | 3.00 (1.82–4.95) | < 0.001 |
| Congestive heart failure | 2.17 (1.10–4.29) | 0.026 | ||
| Diabetic mellitus | 2.11 (1.39–3.19) | < 0.001 | 1.50 (0.95–2.38) | 0.084 |
| Chronic kidney disease | 3.16 (1.88–5.30) | < 0.001 | 1.63 (0.92–2.90) | 0.097 |
| Cerebrovascular accident | 2.34 (1.27–4.31) | 0.006 | 1.45 (0.75–2.81) | 0.272 |
| Chronic obstructive pulmonary disease | 4.19 (2.28–7.70) | < 0.001 | 2.53 (1.32–4.84) | 0.005 |
| Asthma | 1.23 (0.49–3.09) | 0.667 | ||
| Lung cancer | 0.78 (0.24–2.52) | 0.681 | ||
| Other cancer | 0.85 (0.45–1.61) | 0.620 | ||
|
| ||||
| Body temperature (°C) | 0.92 (0.69–1.23) | 0.575 | ||
| Pulse rate (beats per minute) | 1.00 (0.99–1.01) | 0.484 | ||
| Respiratory rate (breaths per minute) | 1.02 (1.00–1.03) | 0.061 | ||
| Systolic blood pressure (mmHg) | 1.00 (0.99–1.00) | 0.760 | ||
| Diastolic blood pressure (mmHg) | 1.00 (0.99–1.02) | 0.608 | ||
| SpO2 (%) | 0.94 (0.91–0.97) | < 0.001 | 0.96 (0.93-0.99) | 0.024 |
| Wheezing | 3.01 (1.16–7.83) | 0.024 | ||
| Crackles | 1.50 (0.87–2.61) | 0.149 | ||
- —National Science and Technology Council10.13039/501100020950
Peer Reviews
No public reviews on file for this paper yet. If you reviewed it on a platform where reviews are public (OpenReview, ICLR, NeurIPS, ICML), you can paste yours below so the community can read it here.
Videos
No videos yet. Explain this paper in a talk, walkthrough, or lecture? Add one.
Taxonomy
TopicsPhonocardiography and Auscultation Techniques · Healthcare Technology and Patient Monitoring · Intensive Care Unit Cognitive Disorders
Introduction
The incidence of acute respiratory failure (ARF) in the United States has increased by 83% over 15 years (1). Patients with ARF usually require mechanical ventilation (MV) and dedicated care in intensive care units (ICU), resulting in high human resource and financial costs. The emergence of Coronavirus disease-19 (COVID-19) has resulted in more patients requiring MV in the United States (2). For critical patients, emergent intubation without planning in advance might cause more complications such as severe hypoxia, shock, and cardiac arrest (3, 4). Therefore, early recognition of patients at high risk for ARF may help in timely management, leading to fewer complications and lower medical expenses.
Auscultation has been a fundamental part of physical examination, which could help diagnose and determine the severity of diseases in real-time and in a non-invasive and inexpensive manner (5, 6). Based on different pathophysiology that interfere with airflow in the respiratory tract, breath sounds present with different pitches, duration, and characteristics. Additionally, its reproducibility and reliability have been validated in studies (7–9). In the model for young group proposed by Gen et al., wheezing was the predictor of oxygen therapy use (10). The predictive potential of breath sounds for ARF warrants further exploration.
The operational definitions of ARF involve laboratory measurements or failure of non-invasive ventilation (NIV), both of which could be confounded by different medical strategies or occur relatively late in the disease course. To overcome above limitations, we instead explored increased oxygen demand (IOD), an early and universal phase of hypoxemic ARF. The aim of this study is to investigate whether respiratory sounds could early predict IOD in emergency department (ED) patients right after inquiry and physical examination.
Materials and methods
Study design and patient selection
This single-center prospective study recruited patients from the ED of a tertiary medical center with a monthly average of 5,000 ED visits, between January 2021 and February 2022. The study was approved by the Institution Review Board of the National Taiwan University Hospital Hsinchu Branch (no. 109–129–E). Inclusion criteria were non-trauma patients in the ED > 20 years old. Patients were excluded if they were pregnant, experienced out-of-hospital cardiac arrest, transferred to another hospital, or were discharged against medical advice. Patients were followed up during their ED stay until admission or discharge. The study was conducted in accordance with Helsinki standards and Strengthening the Reporting of Observational Studies in Epidemiology (STROBE) guidelines for observational studies.
Data collection
For each participant, demographic, clinical, and laboratory data, including age, sex, body-mass index (BMI), pre-existing diseases, smoking history, and triage vital signs, were collected from electronic medical records. Pre-existing diseases included hypertension, coronary artery disease, congestive heart failure, diabetic mellitus, chronic kidney disease, cardiovascular accident, chronic obstructive pulmonary disease (COPD), asthma, and cancer. According to the National Health Interview Survey from the Centers for Disease Control and Prevention, a never smoker is defined as a patient who had never smoked or smoked less than 100 cigarettes. The vital signs (body temperature, pulse rate, respiratory rate, blood pressure, and oxygen saturation) were obtained at triage. Laboratory data included white blood cell count, neutrophil percentage, and hemoglobin, creatinine, C-reactive protein, lactic acid, and NT-pro B-type natriuretic peptide, which were obtained during the ED stay. Missing data distribution was shown in Supplementary Table 1. Missing data were imputed using multiple imputations. For categorical variables, only smoking status had missing data, for which “never smoker” was assigned as the default category for imputation.
Breath sounds were recorded using the CaRDIaRT Electronic Stethoscope DS101 (IMEDIPLUS Inc., Hsinchu County, Taiwan), which could store and export soundwaves to digital formats as “wave” files. A 10-s recording of the breath sounds was acquired at the apexes and bases of both lungs (Supplementary Figure 1). Patients were asked to remain silent and take deep breaths during the recording, which took place in the emergency room. Recordings were performed only when surrounding noise was minimized. If the environment was excessively noisy, the recording was repeated to ensure optimal acoustic conditions.”
As the study went on, a breath sound database named “Formosa archive of breath sound” was built up. It contained 11,532 audio files so far and is still expanding. The audio files were collected in emergency department with authentic contents and were all labeled. The records were uploaded to the web server hosted by the electrical engineering department of National Tsing Hua University. Post-processing or implement filters were not performed. Breath sounds were classified into five categories as follows: normal, wheezing, crackles, unknown, and no breath sounds. Normal breath sound is defined as inspiration and expiration without adventitious sounds. Wheezing is characterized as high-pitched and “musical” sounds heard either on inspiration or expiration. Crackle is a non-musical short and explosive sound primarily occurring in the inspiratory phase. Breath sounds were labeled as unknown if it could not be classified into wheezing or crackles but had firm inspiratory and expiratory phases. Finally, if only ambient noise was recorded, it would be labeled as no breath sounds.
All labeling physicians were emergency medicine residents from medical centers who had received structured training in emergency and critical care. Before participating in this study, they completed a standardized pre-training course in respiratory sound interpretation, including detailed explanations of labeling procedures, clear definitions of abnormal breath sounds, and exposure to representative example recordings. Labeling was performed using high-quality noise-canceling audio equipment. A preliminary test yielded a Cohen’s kappa value of 0.7, indicating satisfactory inter-rater agreement.
Outcomes
Oxygen source, from the lowest to the highest level, included room air, nasal cannula, simple mask or collar mask, non-rebreathing mask, non-invasive ventilation (bilevel positive airway pressure ventilation and high-flow nasal cannula) and invasive mechanical ventilation. IOD (our primary outcome) was defined as ever escalation of oxygen source during a patient’s ED stay compared with the initial patient status at triage. For example, a patient with nasal cannula initially at triage requiring a non-breathing mask later is defined as having an IOD. The secondary outcome was ICU admission.
Sensitivity analysis
A sensitivity analysis was conducted by adjusting the cut-off of our outcome. A new outcome named “Severe IOD” was defined as a two-level escalation of oxygen source during a patient’s ED stay. For example, a patient initially receiving oxygen via nasal cannula at triage who later required a non-rebreathing mask would be classified as having severe IOD. In contrast, a patient who escalated from a nasal cannula to a simple mask would not meet this criterion. Logistic regression was once performed again to examine whether the predictors identified in the primary analysis remained associated with severe IOD.
Subgroup analysis
To address concerns regarding the chronicity of abnormal breath sounds, we conducted a subgroup analysis excluding patients with asthma, COPD, or congestive heart failure, as these conditions are known to predispose individuals to chronic wheezing or crackles.
Statistical analysis
Dichotomous and categorical variables were presented as numbers (percentages), and continuous variables were presented as mean ± standard deviation. A Kolmogorov–Smirnov test was conducted to assess variable normality. Between-group comparisons were performed with the Chi-square and Fisher’s exact tests for categorical data, independent student’s t-test and Mann–Whitney U test for continuous data. Variables were assessed by univariable and multivariable analyses, and results were expressed as odds ratio (OR) with 95% confidence intervals (CIs). Variables with a p < 0.01 in the univariable analysis were subsequently entered into a multivariable logistic regression. The performance of the logistic regression model was evaluated using the area under the receiver operating characteristic (AUROC) curve. Internal validation was conducted through bootstrapping technique with 1,000 resampled datasets to construct 95% CIs for model performance. Model calibration was assessed using the Hosmer–Lemeshow goodness-of-fit test and calibration plots. All statistical analyses were performed with the Statistical Package for the Social Sciences, version 26.0 (IBM Corp., Armonk, NY, United States). A p-value < 0.05 was considered statistically significant.
Sample size calculation
To determine the necessary sample size for evaluating the statistical association between wheezing and IOD, a two-tailed test was performed with a significance level (α) of 0.05 and a statistical power of 80%. It was assumed that 10% of the study population would have IOD. Among patients with IOD, the prevalence of wheezing was estimated at 10%, whereas the prevalence was 5% in patients without IOD. Based on these assumptions, the required sample size was calculated to include 214 patients with IOD and 1,922 patients without IOD.
Results
Patient recruitment and characteristics
Totally 2,216 patients were enrolled. Among them, 171 (7.7%) had IOD and 2,045 (92.3%) did not. A post hoc power analysis based on the observed prevalence and effect size showed a statistical power of 96.8%. The patient flow and their breath sound profiles are depicted in Figure 1. A total of 1,360 patients (61.4%) were discharged, 760 patients (34.3%) were admitted to the general ward and 96 patients (4.3%) were admitted to the ICU. The characteristics of all patients are presented in Table 1. All continuous variables passed the Kolmogorov–Smirnov test and were normally distributed. The mean age of all patients was 61.7 years old. Never smokers accounted for 81.1% of the enrolled patients. The mean oxygen saturation and respiratory rate was 96.2% and 21.1 breaths per minute, respectively. Wheezing and crackles were recognized in 1.9% and 12.0% of patients, respectively.
Flow of data through the study.
Comparison between patients with and without IOD
Table 1 compared the demographics, pre-existing diseases, triage vital signs, laboratory data, and breath sounds between patients with and without IOD. Patients with IOD were older (72.0 vs. 60.8, p < 0.001). No difference in sex distribution was observed between the groups. The prevalence of the most pre-existing diseases was significantly higher in patients with IOD. Wheezing was more prevalent at all four chest locations among patients with IOD. Similarly, crackles were more common in patients with IOD at most chest locations except from the left lower lung.
Association between breath sounds and IOD
Table 2 demonstrates the association between IOD and potential factors. Older patients and patients with lower BMI were more likely to have IOD in the ED. Presence of pre-existing diseases, except asthma, positively correlated with IOD. Patients with higher body temperature, pulse rate, and respiratory rate and those with lower oxygen saturation were more likely to have IOD. Abnormal breath sounds were also associated with IOD. After adjusting for age, pre-existing diseases, and triage vital signs, patients with wheezing had more than two-fold chance to develop IOD than those without wheezing (adjusted OR [aOR] = 2.87, 95% CI = 1.31–6.29). Age was also identified as a predictor of IOD. Patients with lung cancer and cerebrovascular accident had a significantly higher probability of developing IOD (aOR = 3.56, 95% CI = 1.99–6.36; aOR = 2.13, 95% CI = 1.31–3.47). Patients with hypertension and coronary artery disease had approximately 70 and 90% higher likelihood of having IOD in the ED, respectively. Higher pulse and respiratory rates were also predictors for IOD, while oxygen saturation was a protective factor. The AUROC for the model predicting IOD was 0.791 (95% CI = 0.756–0.827) (Figure 2). Bootstrapping validation of the model performance and calibration plot were shown in Supplementary Table 2 and Supplementary Figure 2, which still showed a fair AUROC of 0.764 and good calibration. Hosmer–Lemeshow test showed a *p-*value of 0.700.
Area under the receiver operating characteristic (AUROC) for the multivariable logistic regression model to predict increased oxygen demand.
Association between breath sounds and ICU admission
To further elucidate the impact of breath sounds on a patient’s outcome, we explored the association between ICU admission and breath sounds along with other potential factors (Table 3). In the multivariable analysis, age, coronary artery disease, COPD, and triage oxygen saturation were predictors of ICU admission (aOR = 1.02, 95% CI = 1.00–1.03; aOR = 3.00, 95% CI = 1.82–4.95; aOR = 2.53, 95% CI = 1.32–4.84; aOR = 0.96, 95% CI = 0.93–0.99, respectively). The association between breath sounds and ICU admission was not significant. The AUROC for the model predicting ICU admission was 0.731 (95% CI = 0.677–0.784) (Figure 3). Bootstrapping validation of the model performance and calibration plot were shown in Supplementary Table 3 and Supplementary Figure 3, with an acceptable AUROC of 0.700 and calibration. Hosmer–Lemeshow test showed a *p-*value of 0.601.
Area under the receiver operating characteristic (AUROC) for the multivariable logistic regression model to predict intensive care unit admission.
Sensitivity analysis
In Supplementary Table 4, the sensitivity analysis showed the predictors independently associated with the severe IOD. These factors were almost the same as the primary result, including age, hypertension, coronary artery disease, triage respiratory rate, pulse rate, oxygen saturation and wheezing. The adjusted odds ratio of wheezing was 5.83 (95% CI = 2.36–14.40).
Subgroup analysis
The subgroup analysis excluded patients who were more likely to present with chronic wheezing or crackles. Age, hypertension, coronary artery disease, cerebrovascular accident, lung cancer, triage respiratory rate, pulse rate, oxygen saturation and wheezing are still independently associated with IOD (Supplementary Table 5). The adjusted odds ratio of wheezing was 5.46 (95% CI = 2.21–13.49).
Discussion
Early predictions of ARF may reduce complications. Our study attempts to identify patients at high risk of hypoxia after initial encounter. This study had two major findings: first, according to the multivariable analysis, wheezing is independently associated with higher risk for IOD. Therefore, patients with wheezing may warrant more attention and intervention. Second, other than wheezing, independent predictive factors for IOD were advanced age, comorbidities (hypertension, coronary artery disease, cerebrovascular accident, and lung cancer), tachycardia, tachypnea, and lower oxygen saturation at triage.
Our model relies exclusively on variables that are immediately available at the bedside. After completing history taking, vital sign assessment, and auscultation, clinicians can estimate a patient’s risk of IOD within minutes, without waiting for laboratory or imaging results. This rapid assessment is particularly valuable in medical centers and overcrowded emergency departments, where oxygen-equipped beds and oxygen cylinders are limited—a challenge that became especially apparent during the COVID-19 pandemic. By applying this model, clinicians can proactively allocate oxygen resources, assign high-risk patients to areas with closer monitoring, and identify low-risk patients who may be suitable for safe discharge with appropriate follow-up. Overall, this model has the potential to facilitate earlier risk stratification and support more informed clinical decision-making across a range of ED settings.
Contrary to our presumption that both adventitious lung sounds could predict IOD, crackles is not predictive compared with wheezing. Especially crackles were reported to be correlated with lower oxygen saturation and a higher modified medical research council dyspnea scale (11, 12). There are two possible explanations: first, wheezing is easier for recognition due to its longer duration and distinct sound (13–15). By contrast, crackles, which are short explosive sounds, could be confused with noises such as friction with clothes or electrical monitors. This also explains the relatively larger number of patients with crackles (n = 265) compared to those with wheezing (n = 43). Second, the mean age of our patients (61.7 years old) was relatively old; hence, age-related pulmonary crackles may be more common (16). Crackles were also reported to be the most frequent adventitious sounds in healthy people (17). Both reasons may decrease the correlation between crackles and IOD.
The identified predictors of ICU admission are broadly consistent with the existing literature. Barfod et al. implied that age, oxygen saturation, heart rate, and Glasgow coma scale were independent risk factors for predicting ICU admission of patients in the ED (18). Through machine learning, Fernandes et al. found that heart rate, oxygen saturation, respiratory rate, and systolic blood pressure were the most important predictors of ICU admission among patients in the ED (19). Furthermore, the predictors of IOD are slightly different from those of ICU admission, which could be explained by the far distance from hypoxia to ICU admission and multiple causes for intensive care.
Our model is more generalizable in its association with IOD. Previous studies focused on patients with specific diseases or outcomes after utilization of NIV, which is the last resort before intubation (20–23). The APPROVE score requires multiple variables and could not identify patients who have IOD that is not severe enough for MV (24). Bolourani’s model only predicts respiratory failure within 48 h of admission. The most important variable was non-rebreathing mask as the most aggressive oxygen delivery, which is of limited predictive value and a correlate of intubation decision itself (25). The ROX index, which requires fraction of inspired oxygen and vital signs, is considered a reliable predictor; however, it is primarily applied to patients receiving high-flow nasal cannula therapy (26, 27). Compared with them, our model does not require laboratory testing or trials of advanced oxygen support. This allows for broader applicability across diverse clinical settings and enables earlier prediction. Moreover, few studies have attempted to predict patient oxygen demand based on breath sounds. Most existing researches on breath sounds have focused on sound classification and disease diagnosis using artificial intelligence (28, 29). The novelty of the present study demonstrates the potential clinical value of auscultation-based assessment. Nevertheless, the classification and interpretation of breath sounds are inherently limited by human auditory perception and physiological variability. With the integration of artificial intelligence, future research may be able to identify more sophisticated acoustic patterns for clinical assessment and prognostication.
There are several limitations in this study. First, as a study conducted at a single tertiary medical center, patients may differ in baseline severity and comorbidities compared with those treated in primary care settings, which lead to selection bias. Patients presenting to a medical center may have more severe illnesses or underlying conditions such as cancer. Although a random sampling strategy was adopted to mitigate this concern, the relatively older age and higher prevalence of comorbidities in our sample were still evident. Moreover, certain factors may influence the sampling process; for example, patients with better compliance or less severe illness may be more willing to participate in the study. Therefore, a multicenter study is required to further address these uncertainties. Second, as this was a prospective study, only a few clinical variables had missing data. Missing rates of the variables included in the logistic regression were almost less than 1% except BMI. Therefore, the impact of missing values on the results was minimal. Third, despite adjustment for key demographic and clinical covariates, residual confounding is inevitable in an observational design. Unmeasured factors—such as physician decision-making or unrecorded comorbidities—may have influenced the result. Fourth, although our results lack laboratory variables such as arterial blood gas analysis, our study simulates the initial encounter in the ED. Additionally, clinicians may order laboratory test for more ill patients, possibly resulting in availability bias. Fifth, for the patient comfort, we recorded respiratory sounds on the anterior chest instead of the posterior side that is more informative (8). This approach may have underestimated the true prevalence of abnormal respiratory sounds, but could potentially underestimate the association between wheezing and IOD due to diluting the differences between groups. Sixth, the respiratory sounds were labeled by emergency physicians and were largely dependent on the physician’s expertise and experience (30, 31). Although physicians were allowed to play the recordings repeatedly to minimize intra-observer variability and a pre-test was conducted to ensure subjective consistency, inter-observer agreement of the formal test was not evaluated. Apart from human errors, mechanical issues, such as ambient noise leakage, also disrupts auscultation (32). To mitigate these errors, our research adopted digital stethoscopes for better voice acquisition (33, 34). Furthermore, clinical context such as chief complaints, demographic characteristics, and laboratory results was not provided during respiratory sound labeling to minimize prejudice. Finally, IOD is an innovative outcome, and its clinical significance remains uncertain. Therefore, we conducted logistic regression analyses to examine the associations between IOD and other clinically relevant outcomes. As shown in Supplementary Tables 6, 7, IOD was significantly associated with hospital admission and ICU admission.
Conclusion
In the present study, we developed a prediction model for IOD using breath sounds and other predictors readily available at the bedside, thereby enabling immediate patient risk stratification. In parallel, a respiratory sound database was established. With the application of digital voiceprint analysis and artificial intelligence, the predictive potential of breath sounds could be further explored in future research.
The reference list from the paper itself. Each links out to its DOI / PubMed record.
- 1Kempker JA Abril MK Chen Y Kramer MR Waller LA Martin GS. The epidemiology of respiratory failure in the United States 2002-2017: a serial cross-sectional study. Crit Care Explor. (2020) 2:e 0128. 10.1097/CCE.0000000000000128 32695994 PMC 7314331 · doi ↗ · pubmed ↗
- 2Wunsch H. Mechanical ventilation in COVID-19: interpreting the current epidemiology. Am J Respir Crit Care Med. (2020) 202:1–4. 10.1164/rccm.202004-1385 ED 32402207 PMC 7328308 · doi ↗ · pubmed ↗
- 3Roppolo LP Wigginton JG. Preventing severe hypoxia during emergent intubation: is nasopharyngeal oxygenation the answer? Crit Care. (2010) 14:1005. 10.1186/cc 9197 21092147 PMC 3220012 · doi ↗ · pubmed ↗
- 4Natt BS Malo J Hypes CD Sakles JC Mosier JM. Strategies to improve first attempt success at intubation in critically ill patients. Br J Anaesth. (2016) 117(Suppl 1):i 60–8. 10.1093/bja/aew 061 27221259 · doi ↗ · pubmed ↗
- 5Chen S Huang M Peng X Yuan Y Huang S Ye Y [Lung sounds can be used as an indicator for assessing severity of chronic obstructive pulmonary disease at the initial diagnosis]. Nan Fang Yi Ke Da Xue Xue Bao. (2020) 40:177–82. 10.12122/j.issn.1673-4254.2020.02.07 32376545 PMC 7086132 · doi ↗ · pubmed ↗
- 6Jácome C Oliveira A Marques A. Computerized respiratory sounds: a comparison between patients with stable and exacerbated COPD. Clin Respir J. (2017) 11:612–20. 10.1111/crj.12392 26403859 · doi ↗ · pubmed ↗
- 7Sánchez I Vizcaya C. Tracheal and lung sounds repeatability in normal adults. Respir Med. (2003) 97:1257–60. 10.1016/s 0954-6111(03)00251-8 14682403 · doi ↗ · pubmed ↗
- 8Jácome C Marques A. Computerized Respiratory Sounds Are a Reliable Marker in Subjects With COPD. Respir Care. (2015) 60:1264–75. 10.4187/respcare.03922 25969514 · doi ↗ · pubmed ↗