CRP–TyG index and risk of new‑onset central retinal artery occlusion and subsequent major adverse cardiovascular and cerebrovascular events: a propensity score‑matched cohort study
Hang Liu, Fangyuan Zhu, Hao Xie, Shuo Li, Faxi Wang, Liang Hu, Ting Chen, Xuan Xiao

TL;DR
The study shows that a blood marker called CTI is linked to a higher risk of a rare eye condition and future heart and brain problems.
Contribution
The study identifies CTI as a potential biomarker for predicting central retinal artery occlusion and subsequent cardiovascular events.
Findings
Higher CTI values are independently associated with increased risk of central retinal artery occlusion.
CRAO patients with CTI above 9.810 have a significantly higher incidence of major adverse cardiovascular and cerebrovascular events.
Elevated CTI predicts earlier onset of adverse events, particularly acute coronary syndromes and stroke.
Abstract
The C‑reactive protein–triglyceride glucose index (CTI), a composite marker of systemic inflammation and metabolic status, has been associated with cardiovascular and cerebrovascular risk. Its role in central retinal artery occlusion (CRAO) and subsequent adverse outcomes is unclear. In this cohort study, 122 CRAO patients and 488 matched controls who underwent coronary angiography without coronary artery disease were analyzed. CTI was calculated as 0.412 × ln [CRP (mg/L) + 0.5 × ln [TG × FPG(mg/dL)]. Logistic regression adjusted for demographic, clinical, laboratory, and medication variables was used to explore the relationship between CTI and the risk of CRAO. Restricted cubic spline models assessed the dose–response relationship between CTI and CRAO risk. The primary endpoint was CRAO and the secondary endpoint was major adverse cardiovascular and cerebrovascular events (MACCEs)…
Genes, proteins, chemicals, diseases, species, mutations and cell lines named across the full text — each resolved to its canonical identifier and authoritative record.
Click any figure to enlarge with its caption.
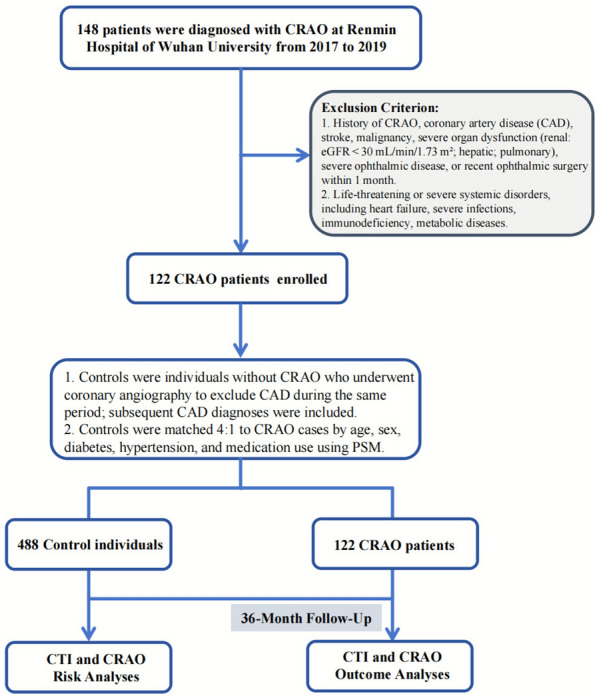 Figure 1
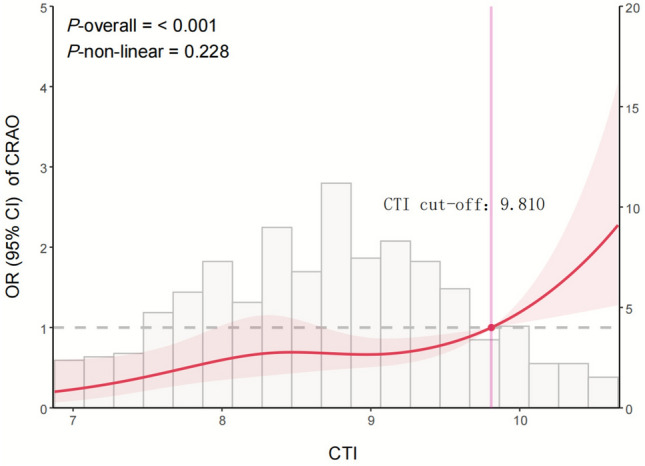 Figure 2
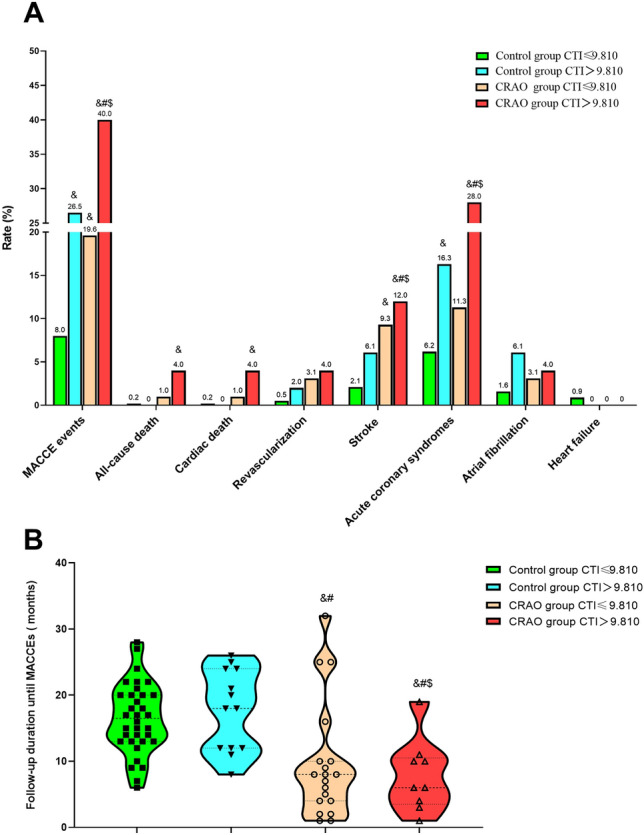 Figure 3
- —The Open Project of Hubei Key Laboratory
- —the Natural Science Foundation of Hubei Province
- —the National Nature Science Foundation of China
- —National Key R&D Program of China
Peer Reviews
No public reviews on file for this paper yet. If you reviewed it on a platform where reviews are public (OpenReview, ICLR, NeurIPS, ICML), you can paste yours below so the community can read it here.
Videos
No videos yet. Explain this paper in a talk, walkthrough, or lecture? Add one.
Taxonomy
TopicsRetinal and Optic Conditions · Retinal Diseases and Treatments · Retinal Imaging and Analysis
Introduction
Central retinal artery occlusion (CRAO) is a vision-threatening ophthalmic emergency, often referred to as an “acute retinal stroke”, characterized by sudden embolic or thrombotic obstruction of the central retinal artery. This results in an abrupt cessation of retinal perfusion, precipitating ischemic injury to the inner retinal layers and frequently culminating in irreversible vision loss [1, 2]. Clinically, patients present with sudden, profound monocular visual impairment, often described metaphorically as a “curtain descending” over the affected eye, alongside the hallmark fundoscopic finding of a cherry-red spot. Beyond its ocular manifestations, CRAO is increasingly recognized as a marker of systemic vascular dysfunction, sharing pathophysiological mechanisms with atherosclerosis, coronary artery disease, and ischemic stroke. Epidemiological studies have demonstrated that patients with CRAO have a markedly increased risk of major adverse cardiovascular and cerebrovascular events (MACCEs), including myocardial infarction and stroke, underscoring the need for comprehensive systemic evaluation and prevention strategies [2–6].
Conventional serum biomarkers, including lipid profiles and single inflammatory markers, capture only isolated aspects of vascular pathology and may be insufficient for accurate risk stratification of CRAO [7–10]. The triglyceride-glucose (TyG) index, a surrogate marker for insulin resistance, has been reported to be elevated in individuals with CRAO and to serve as an independent predictor of its occurrence [11]. Recent research has shifted toward integrated biomarkers that reflect both inflammatory and metabolic dysregulation, two central drivers of atherosclerosis and its complications.
Expanding upon this concept, the C‑reactive protein–triglyceride‑glucose index (CTI) is a novel composite biomarker that combines systemic inflammation (CRP) with metabolic status (TyG index), which provides an integrated measure of vascular risk burden. Elevated CTI levels have been independently associated with increased incidence of coronary artery disease, ischemic stroke, and other MACCEs across diverse populations, frequently demonstrating superior prognostic performance compared with individual biomarkers [12–14].
Despite these observations, the relationship between CTI and CRAO, as well as its prognostic significance for subsequent MACCEs, remains unclear. This present study aimed to systematically investigate the association between CTI and CRAO risk, and to assess the prognostic value of CTI for MACCEs during long‑term follow‑up. We analyzed CRAO patients and propensity score‑matched controls without coronary artery disease (CAD) (1:4 ratio), matched for demographic and clinical covariates. Logistic regression assessed CTI–CRAO associations, and restricted cubic spline modeling explored dose–response relationships, identifying an optimal CTI threshold. Patients were stratified by this threshold to compare MACCEs incidence and time‑to‑event outcomes. This approach enables early identification of high‑risk CRAO individuals, guiding tailored prevention and management strategies that integrate ocular vascular findings with systemic cardiovascular risk assessment to improve visual prognosis, reduce adverse events, and enhance overall survival and quality.
Materials and methods
Study population and design
This study consisted of two components based on a retrospective analysis of electronic medical records from Renmin Hospital of Wuhan University between 2017 and 2019. The detailed inclusion and exclusion process is shown in Fig. 1. First, to evaluate the association between the CTI and CRAO, we conducted a retrospective case–control analysis. Patients diagnosed with CRAO were identified as cases, and individuals without CRAO who underwent coronary angiography during the same period formed the initial pool of potential controls. CRAO was diagnosed based on characteristic clinical and imaging findings. Funduscopic examination typically demonstrated diffuse retinal whitening of the posterior pole with a prominent cherry-red spot. Optical coherence tomography revealed inner retinal hyperreflectivity and thickening, consistent with acute ischemic injury. Fluorescein angiography showed delayed or absent filling of the central retinal artery. Differentiation from branch retinal artery occlusion was made by assessing the localized pattern of retinal whitening and arterial non-perfusion, and cases with cilioretinal artery sparing were identified by preserved perfusion in the cilioretinal territory. Two senior retinal specialists independently confirmed all diagnoses. Second, to assess the prognostic value of CTI for cardiovascular and cerebrovascular outcomes, a retrospective cohort follow-up was performed among all included participants. MACCEs were recorded through longitudinal follow-up.Fig. 1. Flow diagram of patient selection. CRAO central retinal artery occlusion, CAD coronary artery disease, PSM propensity score matching, CTI C-reactive protein–triglyceride-glucose index
CRAO patients did not routinely undergo coronary angiography because coronary imaging is not part of the standard diagnostic workflow for CRAO. Instead, all patients underwent comprehensive cardiovascular evaluation, including medical history, physical examination, ECG, and laboratory testing. Laboratory testing included routine cardiac biomarkers (troponin, CK-MB, and myoglobin) to assist in excluding acute cardiac injury or clinically evident CAD. Patients with any documented history or clinical evidence of CAD based on these evaluations were excluded. Additional exclusion criteria included: (1) prior CRAO, stroke, malignancy, severe organ dysfunction (renal: eGFR < 30 mL/min/1.73 m^2^; hepatic; pulmonary), severe ophthalmic disease, or recent ophthalmic surgery (within 1 month); and (2) life-threatening or severe systemic disorders, including heart failure, severe infections, immunodeficiency, and metabolic diseases (e.g., thyroid dysfunction, inherited metabolic disorders). Smoking status was categorized as current smoking versus non-smoking based on documented active tobacco use at hospitalization; drinking status was defined in the same manner.
Controls were selected from individuals without CRAO who underwent coronary angiography during the same period because of suspected coronary artery disease. Individuals with angiographically confirmed obstructive coronary disease were excluded, and only those with normal or non-obstructive coronary arteries were eligible as controls. The same exclusion criteria that applied to the CRAO group were used for the controls. All controls had complete clinical and laboratory data required for CTI calculation and covariate assessment. Subsequent cardiovascular events, including incident CAD during follow-up, were not exclusion criteria and were recorded as part of the MACCEs outcomes. Using propensity score matching (PSM), controls were matched 4:1 to CRAO cases based on age, sex, diabetes, hypertension, and medication use. This study was conducted in accordance with the Declaration of Helsinki and was approved by the Ethics Committee of Renmin Hospital of Wuhan University (Approval No. WDRY2022-K278). Written informed consent was obtained from all participants before enrollment.
Clinical and laboratory data collection
Demographic characteristics, medical history, laboratory test results, and medication use were obtained from electronic medical records. The CTI was calculated as previously described [12], integrating systemic inflammation (CRP) and metabolic status (TyG) into a single composite biomarker:
\documentclass[12pt]{minimal} \usepackage{amsmath} \usepackage{wasysym} \usepackage{amsfonts} \usepackage{amssymb} \usepackage{amsbsy} \usepackage{mathrsfs} \usepackage{upgreek} \setlength{\oddsidemargin}{-69pt} \begin{document}$${\mathrm{CTI}} = 0.{\mathrm{412}} \times {\mathrm{ln}}\left[ {{\mathrm{CRP}}} \right] + 0.{\mathrm{5}} \times {\mathrm{ln}}\left[ {{\mathrm{TG}} \times {\mathrm{FPG}}} \right],$$\end{document}where CRP is expressed in mg/L, and triglycerides (TG) and fasting plasma glucose (FPG) are expressed in mg/dL.
Outcome definitions and follow‑up
Because the association between CTI and CRAO was assessed using a retrospective case–control design, CRAO status itself was not treated as a study outcome but rather as the condition used to define case and control groups. The follow-up outcomes were evaluated in the second component of the study, which was conducted as a retrospective cohort among all included participants.
The primary follow-up outcome was the occurrence of MACCEs during 36 months of follow-up. MACCEs were defined as a composite endpoint that included cardiovascular death, non-fatal myocardial infarction, non-fatal ischemic or hemorrhagic stroke, hospitalization for heart failure, and any coronary or cerebrovascular revascularization procedure. Follow-up data were obtained from electronic medical records and the institutional follow-up system.
Statistical analysis
Missing data were minimal (< 2% for all variables). A complete-case analysis was performed, and records with missing values were excluded from the relevant analyses. No data imputation was conducted. Continuous variables were expressed as mean ± standard deviation or median (interquartile range), and categorical variables as frequencies (percentages). Between-group comparisons were performed using the Student’s t-test or Mann–Whitney U test for two-group comparisons of continuous variables, and the χ^2^ test or Fisher’s exact test for categorical variables. For comparisons involving more than two groups, ANOVA or Kruskal–Wallis rank-sum test was used for continuous variables, and the χ^2^ test for trend or Kruskal–Wallis test for categorical variables, as appropriate. Post hoc pairwise comparisons were adjusted for multiple testing using the Bonferroni correction method. Multivariate logistic regression models were applied to evaluate the association between CTI and CRAO risk, adjusting for potential confounders. To explore potential non-linear relationships between CTI and outcomes, restricted cubic spline (RCS) analyses were performed using the rcssci package in R. A P-value < 0.05 was considered statistically significant. All analyses were conducted using R software (version 4.5.1) and SPSS (version 22.0).
Results
Characteristics of study participants
A total of 610 participants were included, comprising 122 CRAO cases and 488 matched controls. Baseline characteristics are summarized in Table 1. Compared with controls, CRAO patients had significantly higher neutrophil counts (3.94 ± 1.49 vs. 3.62 ± 1.24 × 10⁹/L, P = 0.011), neutrophil-to-lymphocyte ratio (NLR) (2.19 vs. 1.92, P = 0.005), total cholesterol (TC)(4.77 ± 1.06 vs. 4.39 ± 1.04 mmol/L, P < 0.001), triglycerides (TG) (2.12 ± 1.68 vs. 1.66 ± 0.98 mmol/L, P < 0.001), LDL-cholesterol (2.74 ± 0.86 vs. 2.39 ± 0.79 mmol/L, P < 0.001), and hs-CRP (1.28 vs. 0.81 mg/L, P = 0.016). Both TyG index and CTI were significantly higher in the CRAO group (TyG: 8.90 ± 0.57 vs. 8.72 ± 0.54, P = 0.001; CTI: 9.01 ± 0.95 vs. 8.64 ± 0.89, P < 0.001). Table 1. Baseline characteristics of study participantsCharacteristicsTotaln = 610Control groupn = 488CRAO groupn = 122P valueClinical variables Male sex (%)324 (53.1)258 (52.9)66 (54.1)0.808 Age (years)62 (55, 68)62 (58, 68)63 (55, 70)0.510 Hypertension (%)271 (44.4)217 (44.5)54 (44.3)0.968 Diabetes (%)77 (12.6)56 (11.5)21 (17.2)0.088 Current smoking status (%)132 (21.7)108 (21.1)24 (19.8)0.583 Current drinking status (%)68 (11.1)58 (11.9)10 (8.2)0.247 Fatty liver (%)16 (2.6)11 (2.3)5 (4.1)0.254Laboratory variables WBC (10^9^/L)6.03 ± 1.626.05 ± 1.566.13 ± 1.830.446 Neu (10^9^/L)3.68 ± 1.303.62 ± 1.243.94 ± 1.490.011 Lym (10^9^/L)1.77 ± 0.581.79 ± 0.571.69 ± 0.610.120 NLR2.02 (1.53, 2.63)1.92 (1.49, 2.57)2.19 (1.64, 2.95)0.005 Tch (mmol/L)4.47 ± 1.054.39 ± 1.044.77 ± 1.06** < 0.001** TG (mmol/L)1.76 ± 1.171.66 ± 0.982.12 ± 1.68** < 0.001** HDL-ch (mmol/L)1.16 ± 0.301.17 ± 0.301.13 ± 0.310.188 LDL-ch (mmol/L)2.46 ± 0.822.39 ± 0.792.74 ± 0.86** < 0.001** Glu (mmol/L)5.34 ± 1.315.36 ± 1.315.24 ± 1.280.919 Cr (μmol/L)66 (55, 78)66 (54, 77)67 (56, 85)0.051 eGFR (ml/min/1.73m^2^)95 (87, 103)95 (87, 102)95 (83,105)0.684 hs-CRP (mg/L)0.88 (0.27, 2.46)0.81 (0.26, 2.26)1.28 (0.33, 3.85)0.016 TYG8.76 ± 0.558.72 ± 0.548.90 ± 0.570.001 CTI8.71 ± 0.928.64 ± 0.899.01 ± 0.95** < 0.001**Medications variables Aspirin (%)383 (62.8)312 (63.9)71 (58.2)0.241 Statins (%)452 (74.1)365 (74.8)87 (71.3)0.432 β-Blocker (%)140 (23.0)112 (23.0)28 (23.0)1.000 ACEI/ARB (%)66 (10.8)51 (10.5)15 (12.3)0.558 CCB (%)129 (21.1)103 (21.1)26 (21.3)0.960WBC white blood cell, Neu neutrophil, Lym lymphocyte, NLR neutrophil-to-lymphocyte ratio, Tch total cholesterol, TG triglycerides, HDL-ch high-density lipoprotein cholesterol, LDL-ch low-density lipoprotein cholesterol, Glu glucose, CR Creatinine, eGFR estimated glomerular filtration rate, hs-CRP hypersensitive C-reactive protein, TYG (triglyceride-glucose index) is calculated using the formula: TYG index = ln[(fasting triglycerides (mg/dL) × Fasting glucose (mg/dL)/2], CTI (C-reactive protein–triglyceride glucose index) is calculated through the formula: 0.412 × Ln [(high-sensitivity C-reactive protein(mg/L)] + ln[(fasting triglycerides (mg/dL) × fasting glucose (mg/dL)/2]. ACEI/arb angiotensin-converting enzyme inhibitor/angiotensin Ⅱ receptor blocker, CCB calcium channel blocker
Association between CTI and CRAO risk
In unadjusted logistic regression, each unit increase in CTI was associated with an 80.8% higher odds of CRAO (OR = 1.808, 95% CI 1.269–2.574, P = 0.001) (Table 2). This association remained robust after sequential adjustments for demographic factors, comorbidities, laboratory indicators, and medication use (Model 2: OR = 1.464, 95% CI 1.138–1.882, P = 0.003). In quartile analysis, participants in the highest CTI quartile (≥ 9.32) had over twice the odds of CRAO compared to the lowest quartile (Q1) (Model 2 OR = 2.356, 95% CI 1.199–4.626, P = 0.013; P for trend = 0.023). Table 2. Logistic regression analyses of the association between CTI and CRAOVariablesCrudeModel 1Model 2OR (95%CI)P-valueOR (95%CI)P-valueOR (95%CI)P-valueCTI1.808 (1.269–2.574)0.0011.839 (1.281, 2.640)0.0011.464 (1.138, 1.882)0.003CTI (category)RangeQ1 ≤ 8.051(ref)1(ref)1(ref)Q28.05–8.731.779 (0.955, 3.312)0.0691.881 (0.988, 3.579)0.0541.740 (0.880, 3.438)0.111Q38.73–9.321.707 (0.914, 3.189)0.0931.865 (0.984, 3.536)0.0561.625 (0.822, 3.212)0.163Q4 ≥ 9.322.673 (1.470, 4.860)0.0012.811 (1.515, 5.217)0.0012.356 (1.199, 4.626)0.013P for trend0.0020.0020.023Crude: no adjustmentModel 1: adjusted for sex, age, hypertension, diabetes, fatty liver, smoking status, and drinking statusModel 2: adjusted for all variables in Model 1, plus the following laboratory indicators and medication use: laboratory indicators: white blood cell count, neutrophils, lymphocytes, neutrophil-to-lymphocyte ratio, triglycerides, high-density lipoprotein cholesterol, low-density lipoprotein cholesterol, total cholesterol/high-density lipoprotein cholesterol ratio, creatinine, estimated glomerular filtration rate, and glucose. Medication use: aspirin, statins, β-blockers, angiotensin-converting enzyme inhibitors/angiotensin Ⅱ receptor blockers, and calcium channel blockers
RCS analysis confirmed a significant overall association between CTI and CRAO risk (P-overall < 0.001), with no evidence of non-linearity (P for non-linearity = 0.228) (Fig. 2). CRAO risk increased steadily with CTI, with a steeper rise observed above approximately 9.810.Fig. 2. Restricted cubic spline curve showing the association between CTI and the risk of CRAO. The solid red line represents the odds ratio (OR), and the shaded area indicates the 95% confidence interval
Subgroup analyses
The positive association between CTI and CRAO was largely consistent across subgroups (Table 3), with no significant effect modification by age, sex, hypertension, diabetes, smoking status, lipid levels, or most medication categories (P for interaction > 0.05), except for statin use (P for interaction = 0.019), where the association was stronger in non-users (OR = 3.011, 95% CI 1.536–5.903, P = 0.001). Table 3. Subgroup analysis of the association between CTI and CRAO in model 2SubgroupCRAOOR (95% CI)P valueP for interactionAge0.255 < 601.595 (1.003, 2.537)0.049 ≥ 601.861 (1.291, 2.681)0.001Sex0.671 Male1.536 (1.058, 2.229)0.024 Female1.797 (1.147, 2.816)0.011Hypertension0.932 No2.224 (1.279, 3.867)0.005 Yes1.638 (0.864, 3.104)0.131Diabetes0.373 No1.860 (1.227, 2.818)0.003 Yes1.342 (0.211, 8.554)0.755Smoking status0.859 No1.683 (1.131, 2.504)0.010 Yes0.519 (0.041, 6.560)0.612WBC0.300 ≤ 5.811.337 (0.902, 1.981)0.148 > 5.811.764 (1.159, 2.685)0.008NEU0.674 ≤ 3.411.638 (1.077, 2.492)0.021 > 3.411.667 (1.119, 2.483)0.012LYM0.953 ≤ 1.701.653 (1.151, 2.374)0.007 > 1.701.716 (1.082, 2.721)0.022NLR0.703 ≤ 2.021.806 (1.144, 2.851)0.011 > 2.021.622 (1.128, 2.332)0.009CR0.681 ≤ 661.597 (1.115, 2.287)0.011 > 662.060 (1.312, 3.235)0.002eGFR0.488 ≤ 951.989 (1.268, 3.122)0.003 > 951.374 (0.962,1.964)0.081TC0.919 ≤ 4.361.687 (1.023, 2.781)0.040 > 4.461.494 (1.052, 2.122)0.025HDL0.237 ≤ 1.111.307 (0.864, 1.979)0.205 > 1.111.950 (1.273, 2.987)0.002LDL0.468 ≤ 2.412.456 (1.544, 3.939) < 0.001 > 2.411.240 (0.859, 1.790)0.250Aspirin0.558 No2.070 (1.201, 3.567)0.009 Yes1.798 (1.241, 2.606)0.002Statins0.019 No3.011 (1.536, 5.903)0.001 Yes1.329 (0.940, 1.877)0.107β-Blocker0.817 No1.602 (1.171, 2.190)0.003 Yes1.780 (0.829, 3.822)0.139ACEI/ARB0.970 No1.582 (1.195, 2.092)0.001 Yes–0.999CCB0.682 No1.761 (1.299, 2.387) < 0.001 Yes1.941 (0.717, 5.259)0.192WBC white blood cell, Neu neutrophil, Lym lymphocyte, NLR neutrophil-to-lymphocyte ratio, Tch total cholesterol, TG triglycerides, HDL-ch high-density lipoprotein cholesterol, LDL-ch low-density lipoprotein cholesterol, Glu glucose, CR Creatinine, eGFR estimated glomerular filtration rate, hs-CRP hypersensitive C-reactive protein, TYG (triglyceride-glucose index) is calculated using the formula: TYG index = ln[(fasting triglycerides (mg/dL) × fasting glucose (mg/dL)/2], CTI (C-reactive protein–triglyceride glucose index) is calculated through the formula: 0.412 × Ln [(high-sensitivity C-reactive protein(mg/L)] + ln[(fasting triglycerides (mg/dL) × fasting glucose (mg/dL)/2]. ACEI/ARB angiotensin-converting enzyme inhibitor/angiotensin Ⅱ receptor blocker, CCB calcium channel blockerModel 2: adjusted for all variables in Model 1, plus the following laboratory indicators and medication use: laboratory indicators: white blood cell count, neutrophils, lymphocytes, triglycerides, high-density lipoprotein cholesterol, low-density lipoprotein cholesterol, total cholesterol/high-density lipoprotein cholesterol ratio, creatinine, estimated glomerular filtration rate, and glucose. Medication use: aspirin, statins, β-blockers, angiotensin-converting enzyme inhibitors/angiotensin Ⅱ receptor blockers, and calcium channel blockers
Follow‑up outcomes
During a median follow‑up of 13 months (IQR, 8–20 months), participants with CTI > 9.810 had a significantly higher incidence of MACCEs compared with those with CTI ≤ 9.810 (31.1% vs. 10.1%, P < 0.001). Notably, the rate of acute coronary syndromes was markedly elevated in the high‑CTI group (20.3% vs. 7.1%, P < 0.001). Although the incidences of stroke (8.1% vs. 3.4%, P = 0.059) and atrial fibrillation (5.4% vs. 1.9%, P = 0.078) were higher in the high‑CTI group, these differences did not reach statistical significance. No significant associations were found between CTI level and all‑cause death, cardiac death, revascularization, or heart failure (Table 4). Table 4. Association between CRP–TyG index (CTI) level and follow-up clinical outcomes in all participantsFollow-up clinical outcomesTotal(n = 610)CTI ≤ 9.810(n = 536)CTI > 9.810(n = 77)P valueMACCEs (%)77 (12.6)54 (10.1)23 (31.1)** < 0.001All-cause death (%)3 (0.5)2 (0.4)1 (1.4)0.322Cardiac death (%)2 (0.3)1 (0.2)1 (1.4)0.228Revascularization (%)7 (1.1)5 (0.9)2 (2.7)0.204Stroke (%)24 (3.9)18 (3.4)6 (8.1)0.059Acute coronary syndromes (%)52 (8.7)38 (7.1)15 (20.3) < 0.001**Atrial fibrillation (%)14 (2.3)10 (1.9)4 (5.4)0.078Heart failure (%)4 (0.7)4 (0.7)0 (0.0)1.000Follow-up duration until MACCEs (months, IQR)13 (8, 20)14 (8, 20)12 (8, 21)0.802MACCEs major adverse cardiovascular and cerebrovascular events
To further elucidate the joint impact of CRAO status and CTI level on adverse vascular outcomes, participants were stratified into four subgroups: control group with CTI ≤ 9.810, control group with CTI > 9.810, CRAO group with CTI ≤ 9.810, and CRAO group with CTI > 9.810. Marked differences in MACCEs incidence were observed across these strata (Fig. 3A). The CRAO group with CTI > 9.810 exhibited the highest MACCE rate (40.0%) compared with the control group with CTI ≤ 9.810 (8.0%), the control group with CTI > 9.810 (26.5%), and the CRAO group with CTI ≤ 9.810 (19.6%) (all adjusted P < 0.05). Moreover, the CRAO group with CTI ≤ 9.810 also demonstrated a significantly higher MACCEs incidence than the control group with CTI ≤ 9.810 (adjusted P < 0.05).Fig. 3. Association between CTI levels and follow‑up clinical outcomes.** A** Incidence of major adverse cardiovascular and cerebrovascular events (MACCEs);** B** follow‑up duration until MACCEs occurrence. &, compared with the control group, CTI ≤ 9.810, P < 0.05; #, compared with the control group, CTI > 9.810, P < 0.05; $, compared with the CRAO group, CTI ≤ 9.810, P < 0.05
For specific outcomes, the CRAO group with CTI > 9.810 had significantly higher rates of all‑cause death (4.0% vs. 0.2%, adjusted P < 0.05 vs. control group with CTI ≤ 9.810), stroke (12.0% vs. 9.3%, 6.1%, and 2.1% in the other three groups, all adjusted P < 0.05), and acute coronary syndromes (all adjusted P < 0.05 vs. other three groups). Time‑to‑event analysis (Fig. 3B) showed that the CRAO group with CTI > 9.810 had the shortest median time to MACCEs occurrence (6 months [IQR, 4–11]), followed by the CRAO group with CTI ≤ 9.810 (8 months [IQR, 5–21]), the control group with CTI ≤ 9.810 (12 months [IQR, 8–22]), and the control group with CTI > 9.810 (17 months [IQR, 13–20]).
Discussion
In this cohort study, we found that the CTI, an integrated measure of systemic inflammation and metabolic dysfunction, was independently associated with both the presence of CRAO and the subsequent occurrence of MACCEs during a 36-month follow-up period. CTI levels were significantly higher in patients with CRAO compared with PSM matched controls, and this association persisted after rigorous adjustment for demographic, clinical, laboratory, and medication variables. RCS modeling revealed an inflection point at approximately 9.810, above which the risks of CRAO and MACCEs rose markedly. These results suggest that CTI may serve as a valuable biomarker for simultaneous stratification of ocular and systemic vascular risk, bridging the gap between ophthalmic findings and broader cardiovascular prevention.
CRAO is a vision-threatening ophthalmic emergency and an important indicator of systemic vascular disease [1, 4]. It shares common risk factors with systemic vascular conditions, including hypertension, diabetes, and lipid metabolism disorders, which contribute to atherosclerosis and thromboembolism [12, 13]. Lipid abnormalities, particularly elevated LDL-C and non-HDL-C, are prevalent in CRAO patients and may promote carotid plaque formation and rupture, a common source of retinal emboli [7, 8, 15, 16]. Previous studies have identified hs-CRP as an independent predictor of CRAO [7, 10]. As a liver-derived acute-phase protein primarily induced by interleukin-6, hs-CRP not only serves as a marker of systemic inflammation but also contributes directly to endothelial dysfunction, carotid atherogenesis, plaque instability, and thrombosis [17, 18]. These roles highlight its pivotal involvement in the pathophysiology of CRAO, ischemic stroke, and transient ischemic attack.
Emerging evidence emphasizes that vascular injury results from the interplay between lipid dysregulation and chronic inflammation, which synergistically drive the pathogenesis of atherosclerosis, plaque rupture, and thromboembolic events [19–21].
The CRP–TyG index, by combining markers of inflammation (CRP) and insulin resistance (TyG index), offers a comprehensive tool for vascular risk assessment. The TyG index alone has been identified as an independent predictor of CRAO (HR = 1.84, 95% CI = 1.19–4.23), emphasizing the critical role of metabolic dysfunction in its pathogenesis [11]. Recent large-scale cohort studies have demonstrated that the CTI is a robust predictor of cardiovascular and cerebrovascular disease risk across diverse metabolic profiles. Large-scale cohort studies, including data from CHARLS and NHANES, have consistently demonstrated that the CTI robustly predicts cardiovascular and cerebrovascular disease risk across diverse metabolic profiles. Elevated CTI is strongly associated with increased risk of total CVD, congestive heart failure, coronary heart disease, myocardial infarction, and stroke, with consistent effects across sex and age groups [14, 22]. Moreover, both cumulative exposure to high CTI and dynamic increases over time independently correlate with heightened cardiovascular risk, especially among middle-aged and elderly individuals [23]. Notably, the association between CTI and stroke risk is particularly pronounced in individuals with normal glucose regulation and prediabetes [13]. These findings align closely with our results, which demonstrate a significant association between elevated CTI and increased risk of CRAO. Our study further emphasizes the potential of CTI to identify high-risk individuals who may benefit from targeted preventive interventions, underscoring the importance of integrating CTI into clinical risk assessment for earlier detection and management of vascular risk.
In this study, elevated CTI was associated not only with an increased risk of CRAO, but also with a higher incidence and earlier onset of MACCEs, including myocardial infarction, stroke, and cardiovascular death, during long-term follow-up. Time-to-event analysis highlighted that patients with higher CTI experienced MACCEs significantly sooner than those with lower CTI, emphasizing its prognostic value. Consistent with these findings, recent large-scale studies have demonstrated that elevated CTI robustly predicts adverse cardiovascular outcomes and mortality. For instance, NHANES data revealed that higher CTI levels significantly increase risks of cardiovascular mortality (HR 2.28; 95% CI 1.69–3.24) and all-cause mortality (HR 2.14; 95% CI 1.76–2.55) [22]. Longitudinal cohort analyses have further established a dose–response relationship between cumulative CTI exposure and incident cardiovascular disease, with sustained high CTI trajectories linked to worse clinical outcomes [23]. Moreover, the CHARLS study confirmed that combined elevations in TyG and hsCRP synergistically elevate risks of coronary heart disease and stroke, partially mediating cardiovascular mortality [13, 24]. Together, these results support CTI as a comprehensive biomarker reflecting underlying pathophysiology and a powerful predictor of long-term cardiovascular, cerebrovascular, and mortality outcomes across diverse populations.
The CRP–TyG index captures the synergistic effects of chronic inflammation and insulin resistance, which converge on several molecular pathways that drive endothelial dysfunction, plaque vulnerability, and thrombosis, which together could explain the observed associations between elevated CTI, CRAO, and subsequent MACCEs. CRP promotes endothelial injury, vascular smooth muscle proliferation, and destabilization of atherosclerotic plaques [19, 25]. Simultaneously, the TyG index reflects insulin resistance, which exacerbates atherosclerosis by stimulating the production of sdLDL-C, activating adipose tissue inflammation, and elevating circulating free fatty acids [26, 27]. When both CRP and TyG are elevated, they may jointly activate pro-inflammatory and pro-thrombotic signaling pathways, including NF-κB, JNK, and TLR4, resulting in endothelial activation, local immune cell infiltration, and a hypercoagulable state [28, 29]. On the other hand, high CRP impairs endothelial nitric oxide synthesis, while TyG-related insulin resistance inhibits the PI3K–Akt–eNOS pathway, collectively diminishing endothelial vasoprotective function and promoting vasoconstriction [30–32]. Given that CRAO represents an occlusion of terminal retinal arteries, it may be a localized manifestation of broader systemic microvascular dysfunction. Elevated CTI could therefore reflect widespread vascular injury. Additionally, prior studies have shown that CRP enhances tissue factor expression and coagulation activation, and promotes platelet aggregation via the CD40-CD40L axis [33–35]. Insulin resistance and hypertriglyceridemia further aggravate blood viscosity and thrombotic risk, potentially accelerating the occurrence of macrovascular events. Given the robust epidemiological associations observed in our study, future research should explore the underlying biological mechanisms linking CTI to vascular outcomes.
Despite offering important insights, this study has limitations. First, its retrospective, single‑center design may introduce selection bias and residual confounding, although PSM was applied to enhance internal validity. Second, as a novel biomarker, the CTI’s optimal threshold and clinical utility require confirmation in larger prospective cohorts; the relatively high CTI values in our study may partly reflect the selection of controls without CAD. Third, the generalizability of these findings to other vascular‑risk populations remains uncertain, and the mechanistic pathways linking CTI to vascular events remain speculative. Future multicenter, long‑term studies should validate the predictive value of CTI, assess its integration with imaging or emerging biomarkers (e.g., FGF21), and test whether interventions targeting inflammation or insulin resistance can mitigate MACCEs risk in CRAO [36, 37]. Nevertheless, these results support CTI as a promising tool for vascular risk stratification and a potential target for personalized prevention.
Conclusions
CTI is independently associated with the risk of CRAO and predicts subsequent MACCEs over 36 months, with a threshold of approximately 9.810 marking substantially higher risk. These findings suggest that CTI could serve as a valuable biomarker for integrated ocular–cardiovascular risk assessment, supporting the need for proactive systemic evaluation and preventive care in patients with elevated CTI, regardless of CRAO status.