Pharmacy Benefit Manager Market Concentration for Prescriptions Filled at Retail Pharmacies by State and Payer Type
Dima Mazen Qato, Yugen Chen, Karen Van Nuys

TL;DR
This study analyzes how pharmacy benefit manager market concentration differs by state and type of payer for retail prescriptions.
Contribution
It provides new insights into the variation of market concentration across states and payer types.
Findings
Pharmacy benefit manager concentration varies significantly across states.
Differences in concentration are observed between payer types.
Abstract
This cross-sectional study examines whether and how pharmacy benefit manager concentration varies across states and payer types.
Genes, proteins, chemicals, diseases, species, mutations and cell lines named across the full text — each resolved to its canonical identifier and authoritative record.
Click any figure to enlarge with its caption.
 Figure
| State | Commercial insurance (1 824 166 912 total fills) | Medicaid managed care (336 980 256 total fills) | Medicare Part D (1 117 485 056 total fills) | ||||||
|---|---|---|---|---|---|---|---|---|---|
| HHI | Total fills, % | Fills at top 3 PBMs,% | HHI | Total fills, % | Fills at top 3 PBMs, % | HHI | Total fills, % | Fills at top 3 PBMs, % | |
| Alabama | 3141 | 2.1 | 82.4 | 1644 | 0.1 | 56.0 | 2681 | 2.2 | 83.0 |
| Alaska | 1957 | 0.2 | 72.3 | 3035 | 0.0 | 74.2 | 2869 | 0.1 | 78.3 |
| Arizona | 1810 | 1.8 | 71.0 | 4876 | 3.5 | 98.0 | 2768 | 1.8 | 79.3 |
| Arkansas | 2525 | 1.4 | 69.7 | 4722 | 0.3 | 92.9 | 2671 | 1.4 | 78.0 |
| California | 2144 | 6.8 | 69.9 | 1992 | 0.6 | 61.0 | 2609 | 8.2 | 81.0 |
| Colorado | 1566 | 1.3 | 63.7 | 2749 | 0.3 | 69.8 | 3058 | 1.0 | 76.4 |
| Connecticut | 2073 | 1.1 | 73.4 | 2512 | 0.2 | 77.7 | 3139 | 1.2 | 86.1 |
| Delaware | 2725 | 0.3 | 83.1 | 4857 | 0.7 | 65.2 | 3039 | 0.3 | 85.2 |
| Florida | 2274 | 6.9 | 77.6 | 3615 | 6.2 | 67.0 | 2320 | 7.8 | 66.3 |
| Georgia | 1923 | 3.9 | 67.3 | 3315 | 2.9 | 25.2 | 2675 | 3.2 | 68.5 |
| Hawaii | 3856 | 0.3 | 85.7 | 7097 | 0.6 | 97.5 | 4105 | 0.3 | 88.8 |
| Idaho | 1327 | 0.5 | 46.9 | 2318 | 0.1 | 53.3 | 2133 | 0.5 | 62.5 |
| Illinois | 2416 | 3.8 | 79.3 | 5763 | 6.2 | 97.0 | 2673 | 3.8 | 81.5 |
| Indiana | 1492 | 2.2 | 60.6 | 3199 | 4.6 | 29.9 | 2264 | 2.2 | 62.9 |
| Iowa | 2668 | 1.0 | 77.1 | 4610 | 1.9 | 52.6 | 2727 | 1.2 | 81.4 |
| Kansas | 1916 | 1.2 | 73.3 | 4807 | 0.9 | 96.2 | 2737 | 1.0 | 73.7 |
| Kentucky | 1668 | 1.6 | 59.1 | NA | NA | NA | 2265 | 2.1 | 49.8 |
| Louisiana | 2413 | 1.7 | 77.6 | 2309 | 5.3 | 71.3 | 2667 | 1.9 | 64.8 |
| Maine | 1569 | 0.4 | 58.9 | 2500 | 0.1 | 74.1 | 3187 | 0.5 | 76.3 |
| Maryland | 3471 | 1.9 | 84.9 | 2967 | 2.6 | 41.3 | 3164 | 1.3 | 85.9 |
| Massachusetts | 2704 | 2.1 | 83.6 | 3529 | 2.7 | 97.4 | 3608 | 2.2 | 88.2 |
| Michigan | 2309 | 3.2 | 78.9 | 2579 | 5.9 | 68.7 | 2822 | 3.5 | 83.9 |
| Minnesota | 2353 | 1.4 | 72.5 | 4573 | 2.2 | 69.2 | 3087 | 1.5 | 81.8 |
| Mississippi | 1839 | 1.2 | 63.6 | 3375 | 1.1 | 96.6 | 2859 | 1.3 | 64.5 |
| Missouri | 1724 | 2.1 | 68.9 | 3672 | 0.3 | 79.1 | 2535 | 2.2 | 72.5 |
| Montana | 1811 | 0.3 | 61.1 | 2446 | 0.0 | 69.6 | 2663 | 0.3 | 65.5 |
| Nebraska | 2318 | 0.7 | 79.8 | 3227 | 1.0 | 67.0 | 2698 | 0.7 | 83.2 |
| Nevada | 1845 | 0.8 | 67.4 | 3258 | 1.4 | 67.1 | 2369 | 0.7 | 62.8 |
| New Hampshire | 1840 | 0.5 | 68.5 | 3376 | 0.5 | 79.4 | 2624 | 0.4 | 78.8 |
| New Jersey | 2194 | 2.7 | 79.7 | 6006 | 5.5 | 89.0 | 2961 | 2.5 | 89.0 |
| New Mexico | 2160 | 0.5 | 76.6 | 3767 | 1.2 | 97.0 | 2713 | 0.5 | 79.6 |
| New York | 2297 | 6.1 | 78.9 | 4795 | 7.2 | 83.7 | 3260 | 7.2 | 86.0 |
| North Carolina | 2279 | 3.7 | 76.9 | 2519 | 3.3 | 54.3 | 2555 | 3.7 | 70.8 |
| North Dakota | 2823 | 0.3 | 82.6 | 4601 | 0.1 | 82.5 | 2763 | 0.3 | 76.1 |
| Ohio | 1599 | 4.0 | 64.1 | NA | NA | NA | 2239 | 4.0 | 66.2 |
| Oklahoma | 2560 | 1.3 | 81.0 | 2281 | 0.1 | 63.9 | 2643 | 1.2 | 82.3 |
| Oregon | 1433 | 0.9 | 54.1 | 2653 | 1.8 | 67.1 | 2139 | 1.0 | 70.5 |
| Pennsylvania | 2522 | 4.4 | 80.9 | 3600 | 7.9 | 46.6 | 2698 | 4.9 | 84.9 |
| Rhode Island | 2695 | 0.4 | 84.3 | 5001 | 1.0 | 98.9 | 3021 | 0.4 | 94.3 |
| South Carolina | 2109 | 1.9 | 77.1 | 2561 | 2.1 | 36.1 | 2507 | 1.9 | 74.6 |
| South Dakota | 2967 | 0.3 | 80.9 | 2191 | 0.1 | 60.9 | 3129 | 0.3 | 79.0 |
| Tennessee | 2028 | 2.8 | 72.3 | 1650 | 0.4 | 54.8 | 2475 | 2.8 | 72.7 |
| Texas | 1936 | 9.6 | 72.2 | 2706 | 8.2 | 51.0 | 2566 | 7.8 | 81.2 |
| Utah | 1512 | 1.1 | 49.3 | 3529 | 0.6 | 23.0 | 2420 | 0.6 | 72.6 |
| Vermont | 2060 | 0.2 | 77.1 | 2788 | 0.0 | 77.3 | 3098 | 0.2 | 87.8 |
| Virginia | 2002 | 2.8 | 65.7 | 2707 | 4.5 | 67.8 | 2204 | 2.1 | 63.8 |
| Washington | 1927 | 1.9 | 65.8 | 4647 | 2.9 | 86.8 | 2699 | 1.5 | 81.4 |
| Washington, DC | 3279 | 0.3 | 83.5 | 2900 | 0.6 | 28.7 | 3047 | 0.2 | 87.6 |
| West Virginia | 2461 | 0.7 | 74.9 | 2179 | 0.3 | 28.7 | 2648 | 0.8 | 60.9 |
| Wisconsin | 1425 | 1.6 | 57.4 | 2107 | 0.2 | 67.4 | 2042 | 1.7 | 68.4 |
| Wyoming | 1968 | 0.2 | 68.7 | 2068 | 0.0 | 65.3 | 2736 | 0.1 | 80.6 |
| Highly concentrated | 2194 | 16.1 | 82.0 | 3797 | 93.7 | 70.0 | 2868 | 74.8 | 80.0 |
Peer Reviews
No public reviews on file for this paper yet. If you reviewed it on a platform where reviews are public (OpenReview, ICLR, NeurIPS, ICML), you can paste yours below so the community can read it here.
Videos
No videos yet. Explain this paper in a talk, walkthrough, or lecture? Add one.
Taxonomy
TopicsMedication Adherence and Compliance · Pharmaceutical Economics and Policy · Economic and Financial Impacts of Cancer
Introduction
Pharmacy benefit managers (PBMs), which serve as intermediaries between health insurers and pharmacies, are under investigation by the Federal Trade Commission for potential antitrust violations and anticompetitive practices contributing to high out-of-pocket costs and pharmacy closures.^1^ In our prior study we found that nationally, PBM market concentration for retail prescriptions varied by payer type, was most concentrated in Medicare Part D, and the top 3 PBMs (Caremark, Express Scripts, and Optum Rx) accounted for more than 75% of the market for all payer types.^2^ Despite the critical role of states in PBM regulations,^3^ and evidence PBM markets vary across geographies,^4^ information on whether and how PBM concentration varies across states is limited.
Methods
We used IQVIA’s National Prescription Audit PayerTrak, which includes 92% of prescription fills at US retail pharmacies, including information on the processing PBM, payer type (commercial insurance, Medicare Part D, and Medicaid managed care), and state where the prescription was dispensed (eMethods in Supplement 1). We calculated PBM market concentration for all retail prescriptions filled in 2023 (primary outcome) and total market share for the top 3 PBMs overall and by payer type for each state (secondary outcomes). PBM market concentration was defined using the Herfindahl-Hirschman Index (HHI). Highly concentrated markets were defined as those with an HHI above 2500, consistent with US Department of Justice merger guidelines in 2023.^5^
This cross-sectional study followed the STROBE reporting guidelines. The University of Southern California institutional review board did not consider this study human participant research.
Results
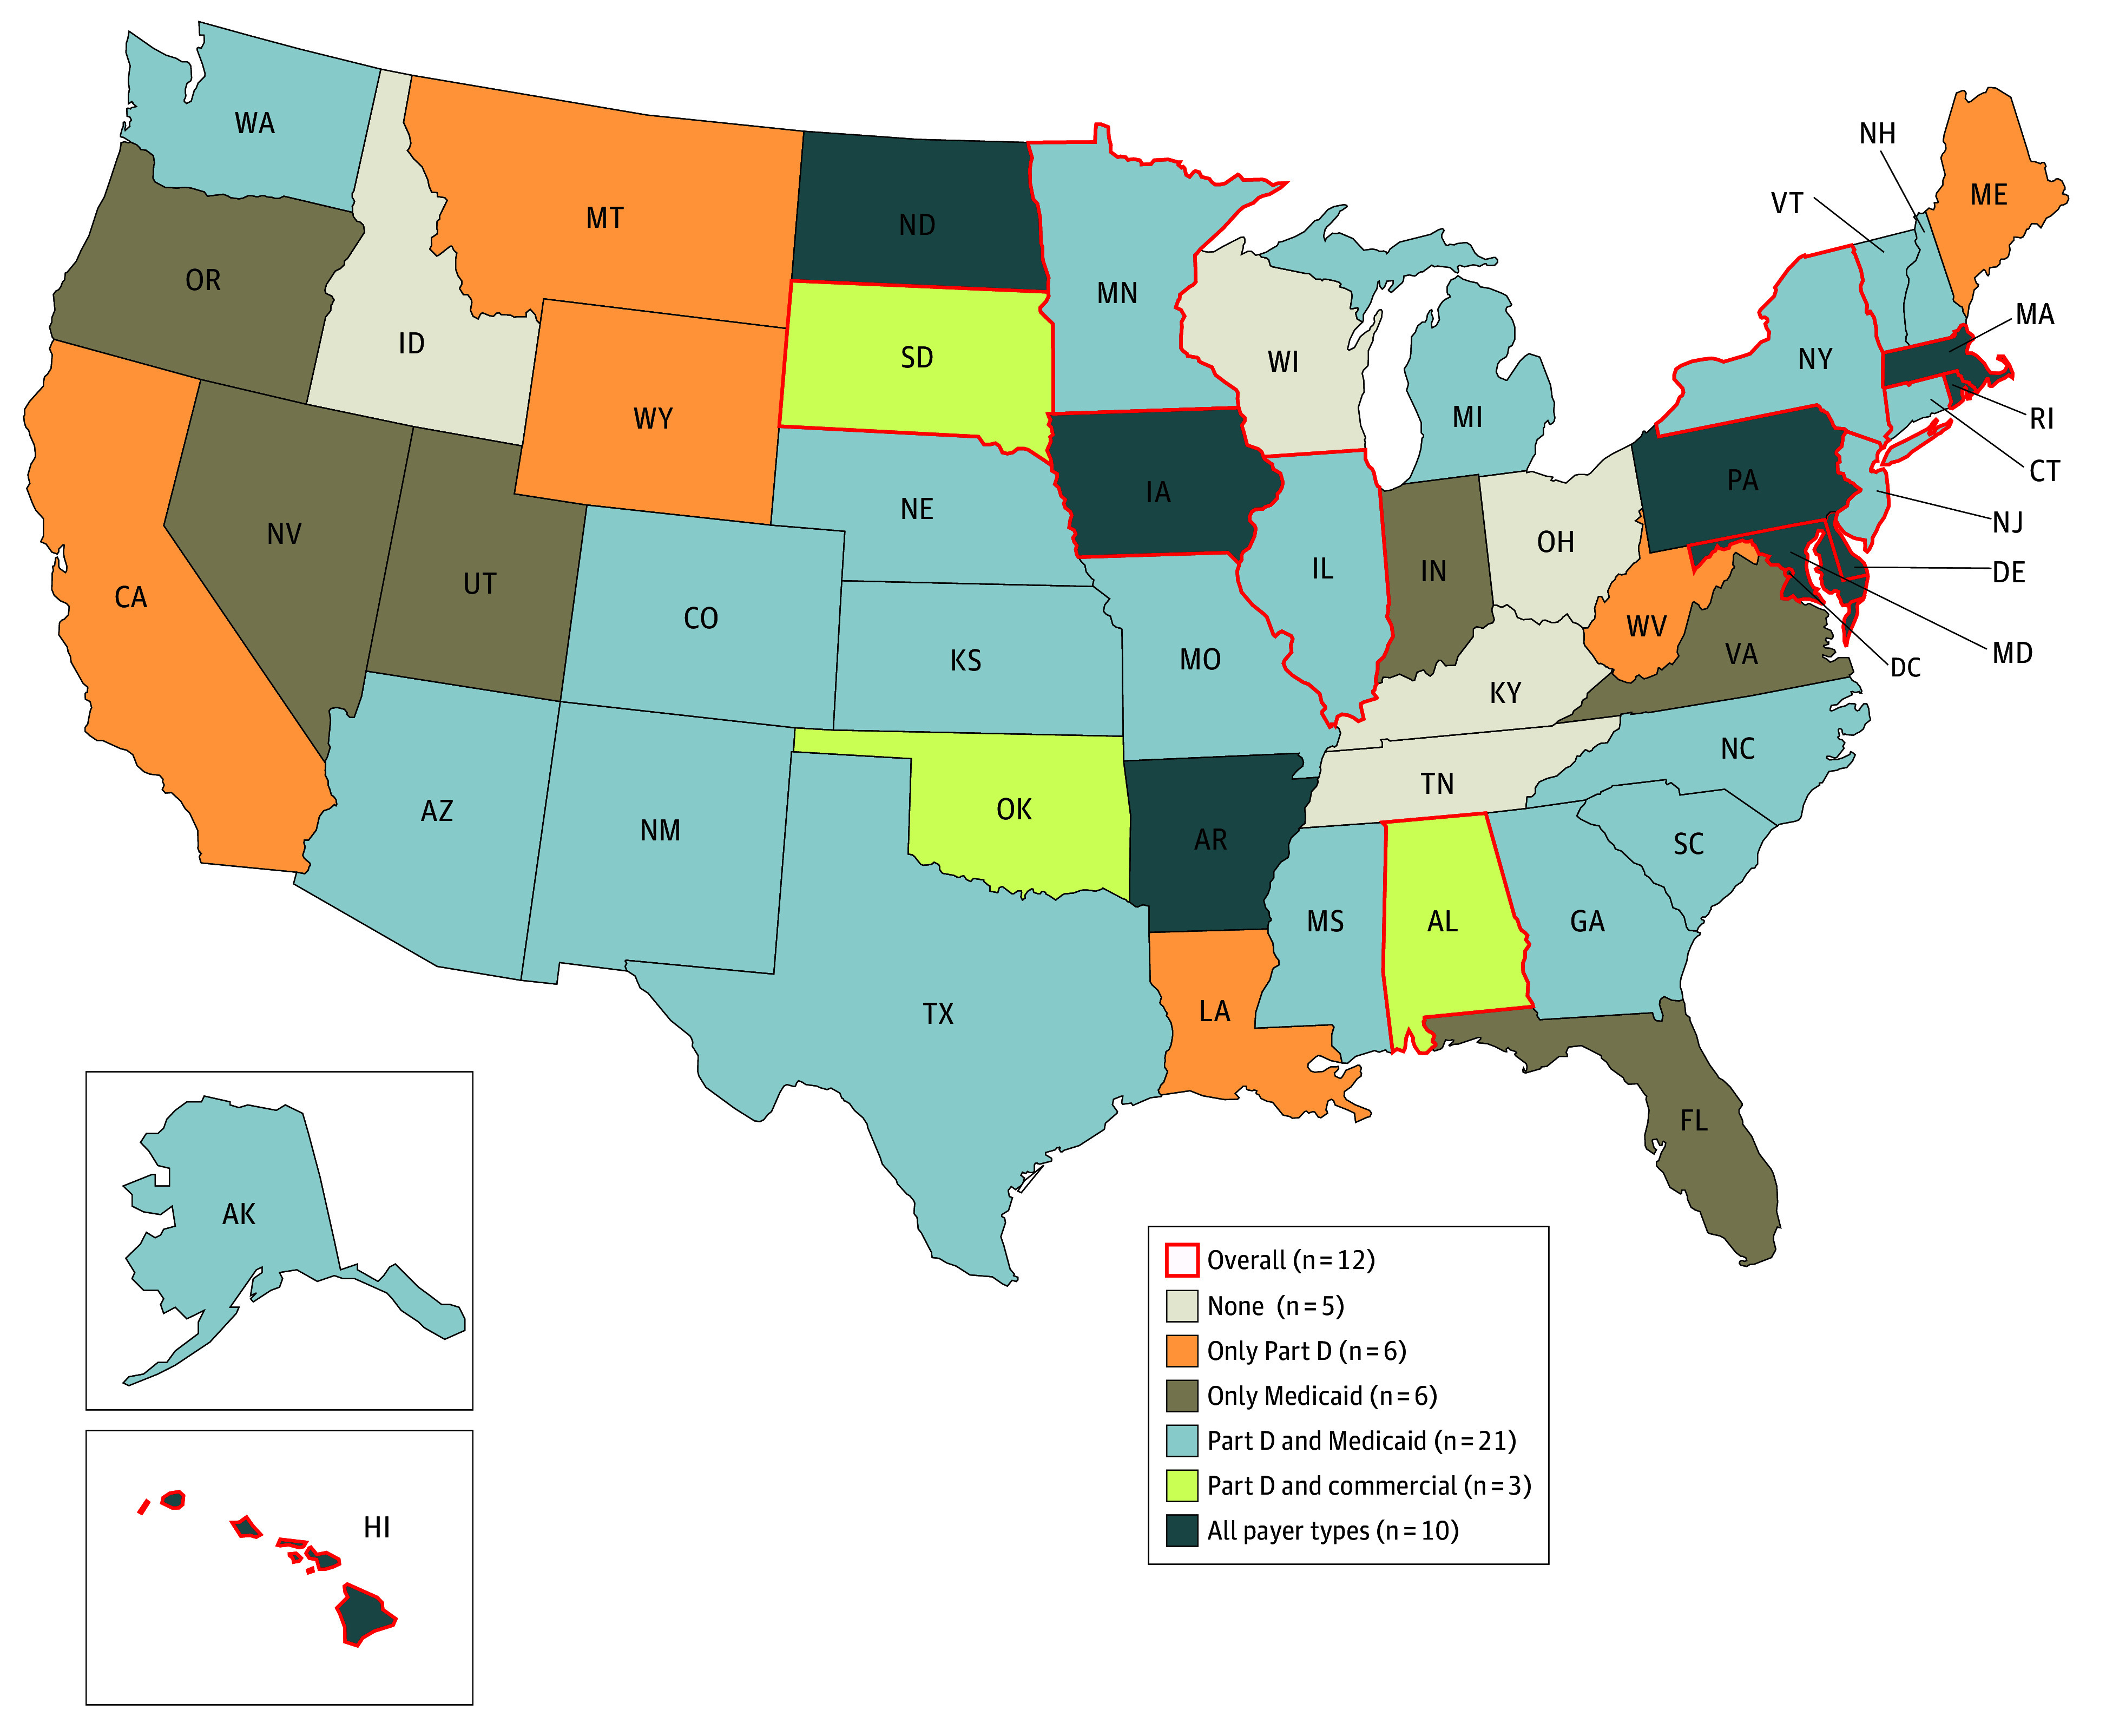
This study included 90% of prescriptions (3.6 billion) filled at US retail pharmacies and adjudicated by 91 PBMs in 2023. Overall, HHI varied substantially across states, ranging from 1443 in Idaho to 4273 in Hawaii, with 12 states identified as having highly concentrated PBM markets (Figure). While only 10 states were found to be highly concentrated for all payer types, 46 states were considered highly concentrated for at least Medicaid managed care or Part D. Specifically, 21 states were considered highly concentrated in both Part D and Medicaid; 17 states were highly concentrated for only Medicare (eg, California) or Medicaid (eg, Florida) PBM markets.
Pharmacy Benefit Manager (PBM) Market Concentration by State and Payer TypeConcentration was measured by Herfindahl-Hirschman Index (HHI; sum of each PBM’s share of retail prescriptions squared). Highly concentrated was defined as HHI above 2500. Retail prescriptions (10% out of 3.6 billion claims) filled through other methods of payments for which PBMs are not involved, including Medicaid fee-for-service, the Medicaid Children’s Health Insurance Program, and cash payment without insurance, were excluded. Certain PBMs (eg, Aetna with Caremark) were combined based on outsourcing and ownership relationships (eMethods in Supplement 1). Iowa, Delaware, Maryland, Hawaii, Rhode Island, Massachusetts, New Jersey, Illinois, New York, Minnesota, Alabama, and South Dakota had HHI above 2500 overall. HHI ranged from 1443 (Idaho) to 4273 (Hawaii), Part D HHI ranged from 2041 (Wisconsin) to 4105 (Hawaii), Medicaid HHI ranged from 1644 (Alabama) to 9205 (Kentucky), and commercial insurance HHI ranged from 1327 (Idaho) to 3856 (Hawaii). State Medicaid authorities in Ohio and Kentucky contracted with a single pass-through PBM for all Medicaid managed care business throughout the state.
States with highly concentrated PBM markets accounted for 16.1%, 93.7%, and 74.8% of all retail prescriptions paid for through commercial insurance (13 states), Medicaid managed care (37 states), and Medicare Part D (40 states), respectively (Table). In nearly all of these highly concentrated states, the top 3 PBMs accounted for the majority of retail prescriptions for all payer types. In fact, one of these top 3 PBMs accounted for at least 50% of the market in many cases (ie, Caremark alone accounted for 83.1% and 71.8% of the Medicaid managed care market in Hawaii and Illinois, respectively).
Discussion
In this cross-sectional study, PBM market concentration for retail prescriptions varied substantially across states and payer types, with most states having highly concentrated markets for Part D and/or Medicaid managed care. The majority of retail prescriptions for Part D and Medicaid managed care were filled in states with highly concentrated PBM markets where the top 3 PBMs dominate, suggesting PBM reform in publicly funded payer markets should be a priority. These findings can guide federal and state policy to improve PBM accountability and transparency. For example, states with highly concentrated PBM markets within Medicaid managed care, including Hawaii, where a state lawsuit was recently filed,^6^ may consider implementing fee-for-service carve outs of the pharmacy benefit, similar to New York. These findings can also inform federal policy interventions, including proposed legislation targeting anticompetitive PBM business practices in Medicare Part D, and the current investigation into PBM conduct.^1^
One study limitation is the lack of information on plan-level contractual arrangements, including specific PBM functions and authority, although the top 3 PBMs exert considerable control over pharmacy networks, cost sharing, and pharmacy reimbursement rates. Additionally, HHI alone does not provide conclusive evidence of anticompetitive PBM business practices. Future research should examine how PBM market concentration influences pharmacy networks, closures, and patient out-of-pocket costs.
The reference list from the paper itself. Each links out to its DOI / PubMed record.
- 1Pharmacy benefit managers: the powerful middlemen inflating drug costs and squeezing main street pharmacies. US Federal Trade Commission. July 2024. Accessed December 30, 2025. https://www.ftc.gov/reports/pharmacy-benefit-managers-report
- 2Qato DM, Chen Y, Van Nuys K. Pharmacy benefit manager market concentration for prescriptions filled at US retail pharmacies. JAMA. 2024;332(15):1298-1299. doi:10.1001/jama.2024.1733239255301 PMC 11388050 · doi ↗ · pubmed ↗
- 3Prescription drugs: selected states’ regulation of pharmacy benefit managers. United States Government Accountability Office. March 18, 2024. Accessed September 5, 2025. https://www.gao.gov/assets/gao-24-106898.pdf
- 4New AMA analysis of consolidation in PBM markets. American Medical Association. Accessed December 30, 2025. https://www.ama-assn.org/print/pdf/node/137116
- 5Horizontal merger guidelines. US Department of Justice and Federal Trade Commission. August 19, 2010. Accessed December 30, 2025. https://www.justice.gov/atr/file/810276/dl?inline
- 6Attorney General Lopez sues major pharmacy benefit managers to protect Hawaiʻi consumers. Office of the Governor, Hawaii. October 4, 2023. Accessed December 30, 2025. https://governor.hawaii.gov/newsroom/2023-45-attorney-general-lopez-sues-major-pharmacy-benefit-managers-to-protect-hawai%CA%B Bi-consumers/