Zinc Sulfate Alleviates Olanzapine Induced Alteration in Hepatic Protein Patterns and Antioxidant Defense System in Rats
Wael Mahmoud Aboulthana, Sherif Abdelmottaleb Moussa, Samir Wassef Aziz, Amal Gouda Hussien, Enayat A. Omara, Samir A. E. Bashandy

TL;DR
This study shows that zinc sulfate can reduce liver damage caused by the antipsychotic drug olanzapine in rats.
Contribution
The study demonstrates that zinc sulfate supplementation can reverse olanzapine-induced hepatic alterations in protein patterns and antioxidant defenses.
Findings
Zinc sulfate reduced oxidative stress and inflammatory markers in liver tissues affected by olanzapine.
Zinc sulfate improved electrophoretic protein and isoenzyme patterns altered by olanzapine.
Zinc sulfate enhanced heme interactions and oxygen utilization in hemoglobin.
Abstract
One of the atypical antipsychotic drugs is olanzapine (OLZ). Enhancing metabolic and detoxifying activities requires zinc (Zn). Thus, the objective of the current study was to determine if Zn supplementation might effectively reduce hepatic lesions induced by OLZ. The oxidative stress, inflammatory, and fibrotic indicators of the liver tissues were evaluated, and electrophoretic methods were used to analyze the native protein and isoenzyme patterns. Furthermore, the liver tissues were examined histopathologically. The dynamic motion of the extracted hemoglobin was also examined. In addition to the serious damage identified histopathologically, our results show that OLZ treatment altered the liver tissue’s antioxidant and inflammatory indicators. The zinc sulfate (ZnSO4) salt solution, given in a dose-dependent fashion, reduced these changes. Additionally, the ZnSO4 salt solution…
Genes, proteins, chemicals, diseases, species, mutations and cell lines named across the full text — each resolved to its canonical identifier and authoritative record.
Click any figure to enlarge with its caption.
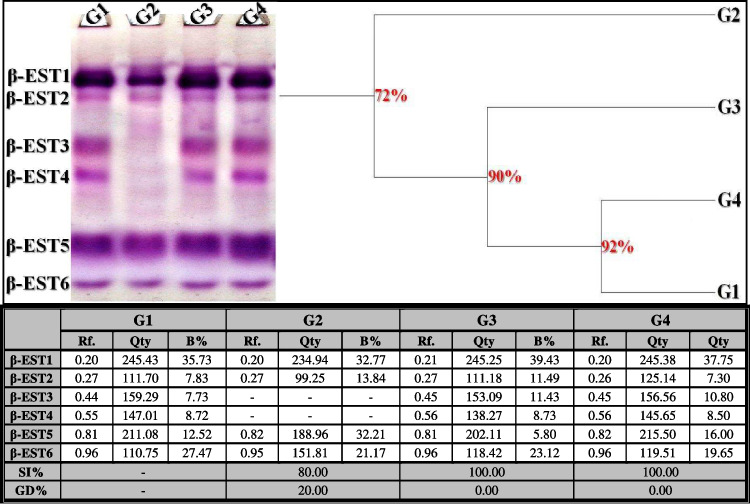 Figure 10
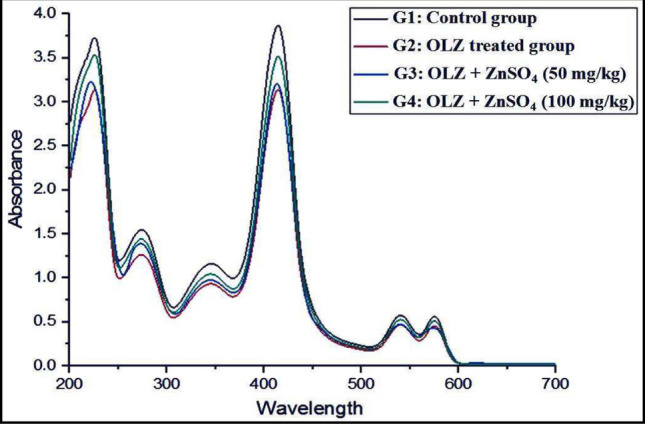 Figure 11
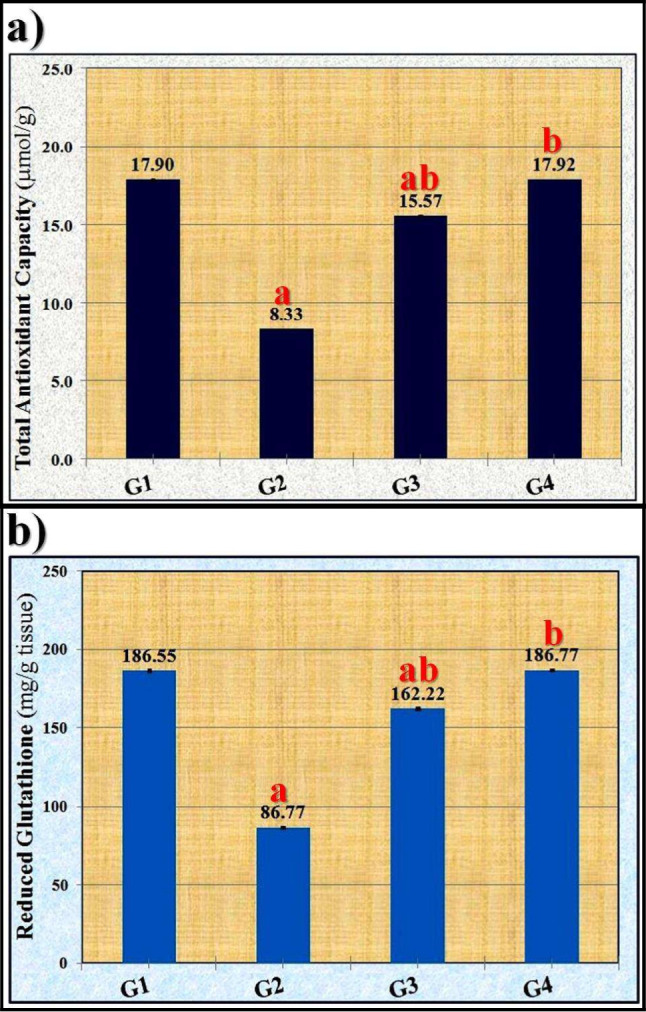 Figure 1
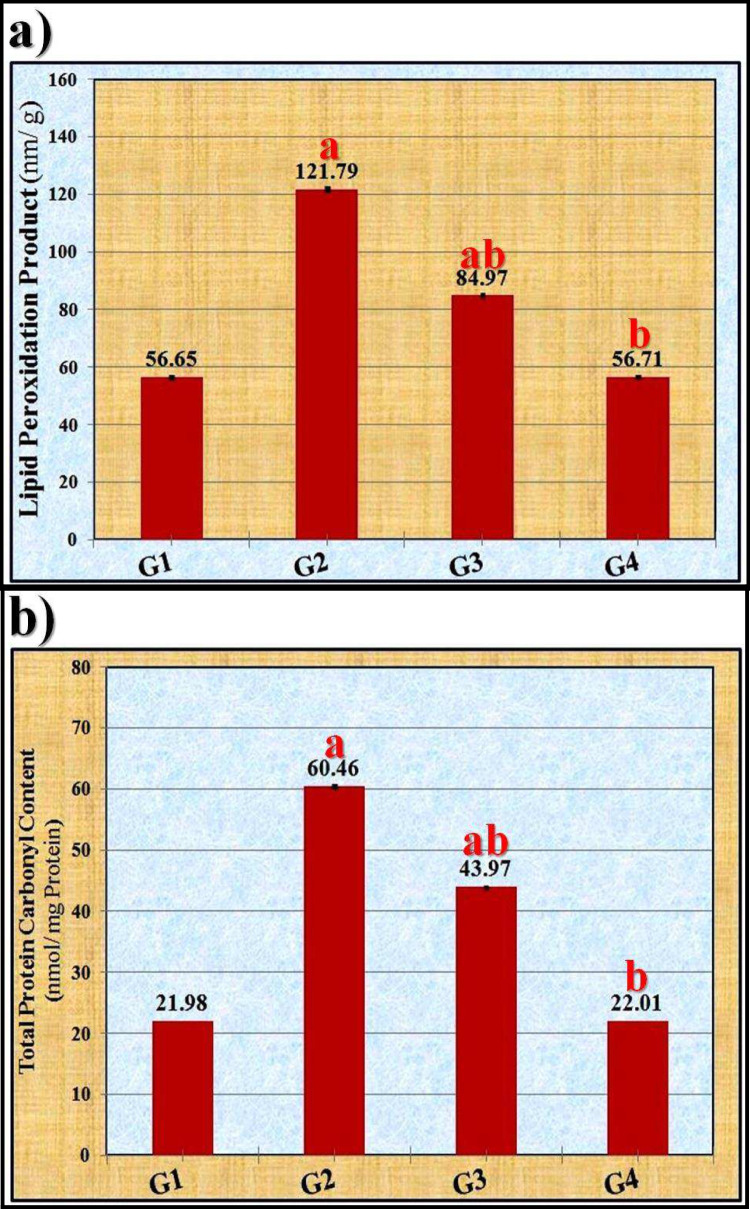 Figure 2
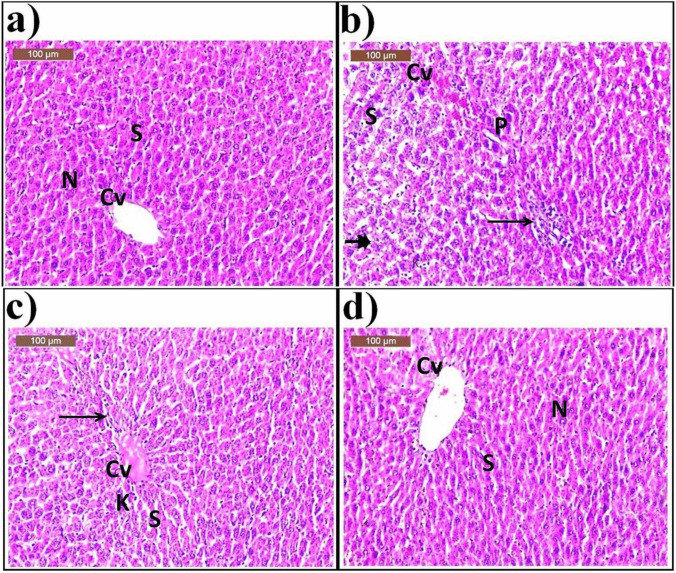 Figure 3
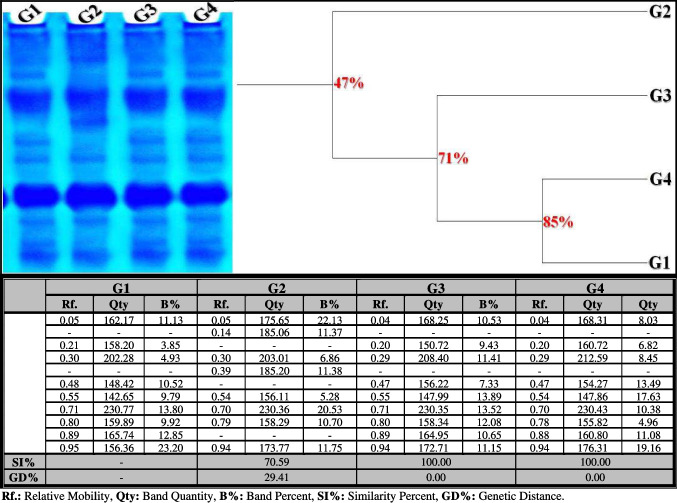 Figure 4
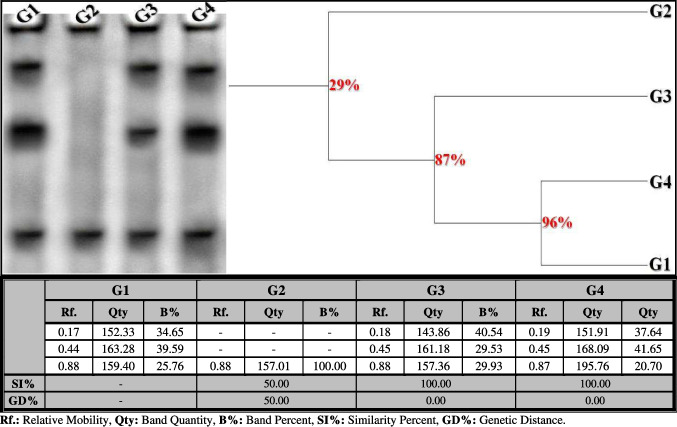 Figure 5
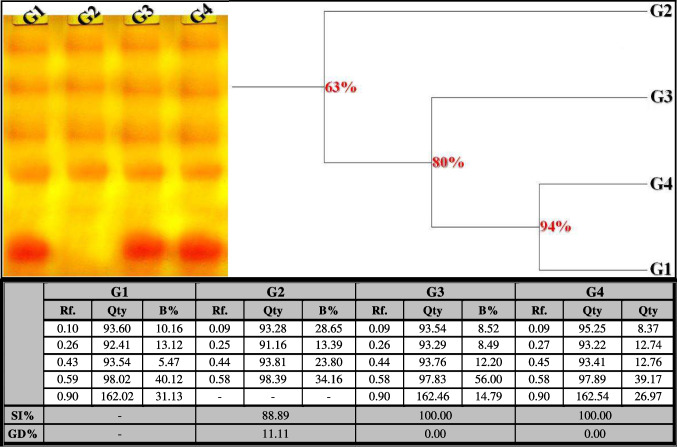 Figure 6
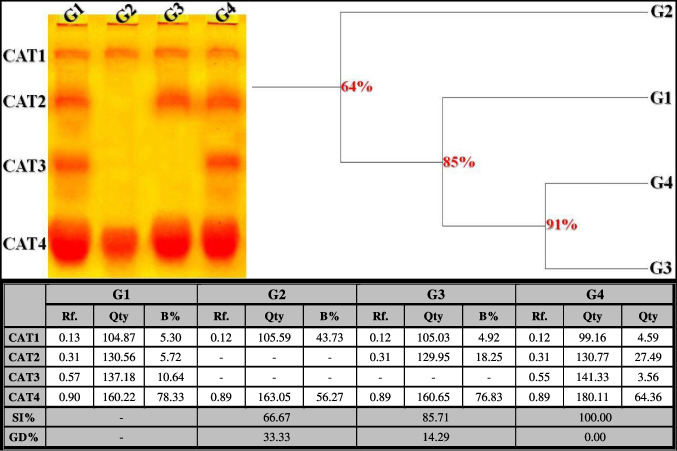 Figure 7
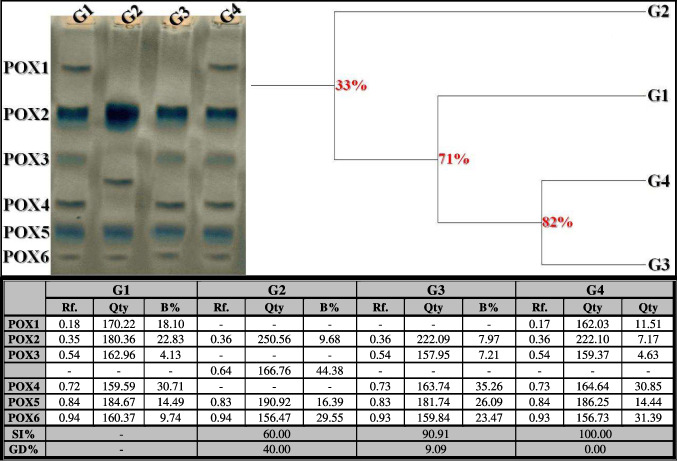 Figure 8
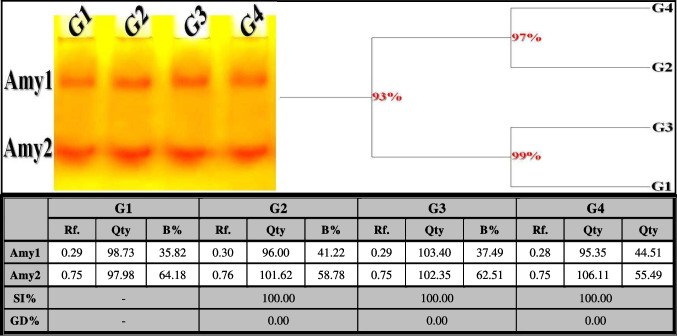 Figure 9
- —National Research Centre Egypt
Peer Reviews
No public reviews on file for this paper yet. If you reviewed it on a platform where reviews are public (OpenReview, ICLR, NeurIPS, ICML), you can paste yours below so the community can read it here.
Videos
No videos yet. Explain this paper in a talk, walkthrough, or lecture? Add one.
Taxonomy
TopicsTrace Elements in Health · Heavy Metal Exposure and Toxicity · Drug Transport and Resistance Mechanisms
Introduction
Olanzapine (OLZ) and other atypical antipsychotic drugs are frequently prescribed to treat psychotic disorder. They are considered the prototype of the second generation. OLZ has also been used as monotherapy or in combination with antidepressants to treat depressive disorders with or without psychotic symptoms [1].
The cytochrome P450 system primarily converts OLZ into inactive metabolites in the liver, which is the primary location of OLZ metabolism [2]. Both high and low dosages of OLZ are sufficient to damage rat livers at the cellular level in histological and stereological studies. Therefore, while it is effective for stress-related mental illnesses, further studies are needed to understand its effects on the liver [3]. Given the increased risk of death and consequences from obesity, it is important to emphasize that OLZ is associated with several metabolic issues, including weight gain, hyperglycemia, and hypertriglyceridemia, all of which should be treated with extreme caution [4].
The majority of studies on the metabolic abnormalities induced by OLZ have been conducted in normal experimental animals due to the limitations of the schizophrenia model. Further investigations are needed to determine if the schizophrenia phenotype affects the metabolic anomalies induced by OLZ [5]. Inflammation and oxidative stress occur with the administration of OLZ. High blood pressure, impaired glucose tolerance, and hyperlipidemia are examples of metabolic comorbidities that significantly impact and contribute to metabolic dysfunction. They play a crucial role in the development of metabolic diseases [6, 7].
Zinc (Zn) is one of the most important trace elements in all tissues, secretions, and liquids. It is essential for metabolism, detoxification, growth, development, signaling pathways, and gene regulation [8]. It also carries out a number of biological functions, including protein synthesis, proliferation, redox equilibrium, and antioxidant activities, by maintaining the integrity of the cell membrane, increasing the amount of metallothionein (MT), or decreasing calcium influx [9].
Zn is particularly important for cellular function as it is an essential part of many proteins, such as structural proteins, transcription factors, and metalloenzymes. Apart from its role as a component of several enzymes involved in cell division and macronutrient metabolism, Zn is also considered a cofactor [10]. Low Zn levels can activate rat hepatocytes, which are vulnerable to oxidative stress. It has been discovered that Zn provides protection against toxicant-induced liver damage [11].
Proteins that scavenge superoxide and hydroxyl radicals can be activated by Zn [12]. This is why the current study was conducted to demonstrate how Zn supplementation protects rats against oxidative hepatic lesions, changes in hepatic protein patterns, and alterations in hemoglobin mobility induced by OLZ.
Materials and Methods
Experimental Design
In the Animal House of the National Research Center in Giza, Egypt, thirty-two (32) adult male Wistar rats weighing between 120 and 150 g were kept in a well-regulated environment. The rats were fed ad libitum with a standard chow diet purchased from local feed production companies following international specifications for food ingredients for rodents as presented in Supplementary Table 1. They were given free access to tap water. They were divided randomly into four groups (eight rats per group).
The control group (G1) received 1 mL of distilled water daily (OLZ vehicle), along with normal food and distilled water for 8 weeks. The OLZ-treated group (G2) was orally administered OLZ at a dose of 10 mg/kg body weight for 8 weeks, following the study conducted by Ardıç et al. [13]. The OLZ- + ZnSO4-treated groups (G3 and G4) were orally treated with OLZ as in G2 and ZnSO_4_ at doses of 50 and 100 mg/kg, respectively for 8 weeks as proposed by Ebaid et al. [14].
Collection of Blood Samples and Tissues
Eight weeks after treatment, the rats were starved for around 12 h. Rats in all groups were anesthetized using xylazine and ketamine (20 and 50 mg/kg, intraperitoneally, respectively). The liver tissues of the animals were removed following cervical dislocation and cleaned in ice-cold saline. Using the Tissue Master TM125 (Omni International, USA), the tissue was homogenized in potassium phosphate buffer (pH 7.4) and centrifuged for ten minutes at 3000 rpm. For histological analysis, a portion of the autopsied tissue was stored in a 10% neutral buffered formalin solution. The clean supernatants from the biochemical assays were stored at − 80 °C for storage.
Biochemical Assays in Liver Tissues Homogenates
Oxidative Stress Markers
In the clear supernatants of the liver tissue homogenates, oxidative stress indicators such as reduced glutathione (GSH) [15] and total antioxidant capacity (TAC) [16] were measured as µmol/g and mg/g tissue, respectively. Total protein carbonyl (TPC) [17] and lipid peroxidation products (LPO) [18] were measured and reported as nmol of reactive carbonyl compounds per mg protein of tissue and nmol/g wet tissue, respectively.
Fibrotic and Inflammatory Reactions Markers
The amount of the fibrotic marker hydroxyproline [19] was expressed as µg/mg of tissue. Additionally, the quantitative sandwich enzyme immunoassay (ELISA) technique was employed to test two commonly used inflammatory markers, interleukin-6 (IL-6) [20] and tumor necrosis factor-α (TNF-α) [21], and the results were represented as pg/g of tissue.
Statistical Analysis
Results from five replicates are presented as mean ± standard error (SE). The data were statistically examined by a one-way analysis of variance (ANOVA) test using the Statistical Package for Social Sciences (SPSS for Windows, version 19.0), followed by the Bonferroni test as a post-hoc analysis. A “p” value less than 0.05 indicates a statistically significant difference between the groups being investigated.
Histopathological Examination
The liver was preserved for 48 h in neutrally buffered formalin in order to be examined. After that, it was washed in distilled water, put through a grading sequence of alcohol processes, removed with xylene, and then imbedded in paraffin wax. The 5-μm-thick paraffin slices were stained with hematoxylin and eosin (H&E) [22]. A light microscope was used for inspecting for histopathological changes in the stained sections.
Electrophoretic Assays
Native Protein Patterns
Following the homogenization of the liver tissues (with known weights) in extraction buffer, the mixture was centrifuged. To ensure that the protein concentrations in each well were the same, the Bradford method [23] was used to determine the protein concentration in the supernatants. The protein concentration was then diluted with sample loading dye according to the protein concentration. Vertical slab polyacrylamide gel electrophoresis was used to assay the protein bands, lipids, and calcium moieties of native proteins using Coomassie Brilliant Blue (CBB) [24], Sudan Black B (SBB) [25], and Alizarin Red “S” [26].
Isoenzyme Patterns
To identify the electrophoretic catalase (CAT) and peroxidase (POX) types, the native gel was treated with the particular conditioning buffer and hydrogen peroxide (H_2_O_2_) as a substrate. It was then stained with potassium iodide (KI) [27] and benzidine [28]. The native gel was colored with an iodine solution after being incubated in a soluble starch solution as a substrate to distinguish the electrophoretic α-amylase (α-Amy) types [29]. The β-esterase (β-EST) types were identified electrophoretically by coloring the gel with a reaction mixture that included Fast Blue RR and β-naphthyl acetate substrates, as suggested by Ahmad et al. [30].
Data Analysis
Quantity One software (Version 4.6.2) was used to analyze the colored bands to determine the relative mobilities (Rfs), band quantity (Qty), and band percentage (B%) of the electrophoretically separated bands. The percentages of genetic distances (GD%) and similarity indices (SI%) between each treated group and the control were computed using a method developed by Nei and Li [31].
Extraction and absorption spectra of hemoglobin
Using a modified method described by Trivelli et al. [32], hemolysates of packed and cleaned erythrocytes were prepared. Under these conditions, the hemoglobin concentration was found to be between 2.9 and 3.4 × 10^−5^ M. The deoxyhemoglobin component was ignored since it is too small to be detected spectrophotometrically at this high dilution and under air-saturated conditions. A UV/VIS dual-beam spectrophotometer with kinetic measurements (model: DS5) from Edinburgh Instruments, UK, was used to generate HbO_2_ absorption spectra at 25 ± 1 °C.
Results
Oxidative Stress Markers
TAC and GSH levels in the liver tissue homogenates were significantly (p ≤ 0.05) reduced by OLZ, according to the results in Fig. 1. These values increased significantly (p ≤ 0.05) in the tissue of the zinc sulfate (ZnSO_4_)-treated groups in a dose-dependent manner when compared to the OLZ-treated group. These values reverted to normal after receiving a dose of 100 mg/kg of ZnSO_4_. Fig. 1. Effect of zinc sulfate (ZnSO_4_) against depletion of the antioxidant system induced by olanzapine on a total antioxidant capacity (TAC) and b concentration of reduced glutathione (GSH) in liver tissue of rats. The data were statistically examined using the Bonferroni test as a post-hoc analysis. “a” denotes significant difference (p ≤ 0.05) compared to control group, “b” denotes significant difference (p ≤ 0.05) compared to toxic group. G1: control group, G2: OLZ-treated group, G3: OLZ + ZnSO_4_ at a dose of 50 mg/kg treated group, and G4: OLZ + ZnSO_4_ at a dose of 100 mg/kg treated group
Rats treated with OLZ had significantly (p ≤ 0.05) higher levels of LPO and TPC than the control group in terms of the products of peroxidation reactions (Fig. 2). The concentrations of these indicators were significantly (p ≤ 0.05) reduced in the ZnSO_4_-treated groups at both doses (50 and 100 mg/kg) in a dose-dependent manner. Rats given 100 mg/kg of ZnSO_4_ showed a recovery to normal values in these assays in their livers. Fig. 2. Effect of zinc sulfate (ZnSO_4_) against the oxidative stress induced by olanzapine on a lipid peroxidation products (LPO) and b total protein carbonyl content (TPC) in liver tissue of rats. The data were statistically examined using the Bonferroni test as a post-hoc analysis. “a” denotes significant difference (p ≤ 0.05) compared to the control group, “b” denotes significant difference (p ≤ 0.05) compared to the toxic group. G1: control group, G2: OLZ-treated group, G3: OLZ + ZnSO_4_ at a dose of 50 mg/kg treated group, and G4: OLZ + ZnSO_4_ at a dose of 100 mg/kg treated group
Inflammatory and Fibrotic Markers
Indicators of tissue integrity include levels of inflammatory markers (TNF-α and IL-6) and fibrotic marker (hydroxyproline). Rats treated with OLZ showed significantly (p ≤ 0.05) higher levels of the inflammatory markers TNF-α and IL-6 than the control group (Table 1). At both doses (50 and 100 mg/kg), ZnSO_4_ administration significantly (p ≤ 0.05) reduced these markers’ levels in the ZnSO_4_-treated groups in a dose-dependent manner. Rats given 100 mg/kg of ZnSO_4_ had their liver levels of these indicators returned to normal. The group that received OLZ orally showed no change in the amount of the fibrotic marker, hydroxyproline. ZnSO_4_ administration at the two doses under study did not alter this marker’s level. Table 1. Effect of zinc sulfate (ZnSO_4_) against the alterations in markers of the inflammatory response induced by olanzapine (OLZ) in the liver tissues of ratsG1G2G3G4TNF-α(pg/g tissue)229.68 ± 2.84401.93 ± 4.97^a^321.55 ± 3.97^ab^232.33 ± 2.87^b^IL-6(pg/g tissue)287.10 ± 3.55502.42 ± 6.21^a^401.93 ± 4.97^ab^290.41 ± 3.59^b^Hydroxyproline(µg/mg tissue)0.52 ± 0.010.55 ± 0.010.54 ± 0.010.58 ± 0.01Data were presented as mean ± SE (from five replicates). The data were statistically examined using the Bonferroni test as a post-hoc analysis. “a” denotes significant difference (p ≤ 0.05) compared to the control group and “b” denotes significant difference (p ≤ 0.05) compared to the toxic group. G1: control group, G2: OLZ-treated group, G3: OLZ + ZnSO_4_ at a dose of 50 mg/kg treated group, and G4: OLZ + ZnSO_4_ at a dose of 100 mg/kg treated group
Histopathological Examination
The sections of the liver in the control group (G1) showed typical hepatic architecture, with hepatocytes distributed in cords extending from the central veins. Hepatocytes contained spherical vesicular nuclei with blood sinusoids (Fig. 3a). Fig. 3A photomicrograph of rat liver of a control group (G1) showing normal hepatic architecture, central vein (Cv), blood sinusoids (S), and nucleus (N); b OLZ-treated group (G2) showing dilated congested central veins (Cv), necrosis (arrowhead), with pyknotic nuclei (P) and increase in kupffer cells (K). Notice a focal area of aggregations of lymphocytes infiltrating (star) in between the hepatocytes; c OLZ + ZnSO_4_ at a dose of 50 mg/kg treated group (G3) showing moderate improvement as congestion of central vein (Cv), minimal inflammatory cells (arrow) with slight dilated blood sinusoids (S), and mild increase in kupffer cells (K); and d OLZ + ZnSO_4_ at a dose of 100 mg/kg treated group (G4) showing remarkable improvement of histological structure, normal appearance of central vein (Cv), and nucleus (N) associated with slight dilated blood sinusoids (S)
In the OLZ-treated group (G2), the histopathological examination of hepatic tissues showed dilated congested central veins, necrosis with pyknotic nuclei, and an increase in Kupffer cells. There was a focal area of aggregations of lymphocytes infiltrating between the hepatocytes **(**Fig. 3b). In the rats treated with OLZ coinciding with ZnSO_4_ at a dose of 50 mg/kg (G3), the examination section showed moderate improvement such as congestion of the central vein, minimal inflammatory cells with slightly dilated blood sinusoids, and a mild increase in Kupffer cells (Fig. 3c). In the rats treated with OLZ coinciding with ZnSO_4_ at a dose of 100 mg/kg (G4), the sections of liver tissues showed a remarkable improvement in histological structure, normal appearance of the central vein and nucleus, and slightly dilated blood sinusoids (Fig. 3d).
Electrophoretic Assays
Native Protein Patterns
Protein Pattern
The native protein pattern showed nine bands (Rfs 0.05, 0.21, 0.30, 0.48, 0.55, 0.71, 0.80, 0.89, and 0.95; Qty 162.17, 158.20, 202.28, 148.42, 142.65, 230.77, 159.89, 165.74, and 156.36; B% 11.13, 3.85, 4.93, 10.52, 9.79, 13.80, 9.92, 12.85, and 23.20, respectively) in the control liver (Fig. 4). Six common bands (Rfs 0.05, 0.30, 0.55, 0.71, 0.80, and 0.95) were identified. In the OLZ-treated group, the physiological changes were represented by the disappearance of three normal bands and the appearance of two characteristic (abnormal) ones (Rfs 0.14 and 0.39; Qty 185.06 and 185.20; B% 11.37 and 11.38, respectively). Therefore, the SI value (SI = 70.59%; GD = 29.41%) decreased compared to the control group. In the rats treated with OLZ coinciding with ZnSO_4_ at both doses, the protein pattern was improved by hiding the abnormal ones while restoring the absent normal bands (Rfs 0.20, 0.47, and 0.89) in the ZnSO_4_-treated group at a dose of 50 mg/kg (Qty 150.22, 156.22, and 164.95; B% 9.43, 7.33, and 10.65, respectively) and in the ZnSO_4_-treated group at a dose of 100 mg/kg (Qty 160.72, 154.27, and 160.80; B% 6.82, 13.49, and 11.08, respectively). Therefore, both treated groups are physiologically resembled to the control group by 100.00% (GD = 0.00%).Fig. 4. Native electrophoretic protein pattern showing the physiological effect of zinc sulfate (ZnSO_4_) against the toxicity induced by olanzapine on number and arrangement of the enzyme bands in liver tissue of rats. G1: control group, G2: OLZ treated group, G3: OLZ + ZnSO_4_ at a dose of 50 mg/kg treated group, and G4: OLZ + ZnSO_4_ at a dose of 100 mg/kg treated group. Rf., relative mobility; Qty, band quantity; B%, band percent; SI%, similarity percent; GD%, genetic distance
Lipid Moiety of Native Protein Pattern
The native pattern showed three bands (Rfs 0.17, 0.44, and 0.88; Qty 152.33, 163.28, and 159.40; B% 34.65, 39.59, and 25.76, respectively) in the control liver (Fig. 5). Only one common band (Rf 159.40) was identified. In the OLZ-treated group, the physiological changes were represented by the disappearance of two normal bands without the appearance of abnormal ones. Therefore, the SI value (SI = 50.00%; GD = 50.00%) decreased compared to the control group. In the rats treated with OLZ coinciding with ZnSO_4_ at both doses, the native pattern was improved by restoring the absent normal bands (Rfs 0.17 and 0.44) in the ZnSO_4_-treated group at a dose of 50 mg/kg (Qty 143.86 and 161.18; B% 40.54 and 29.53, respectively) and in the ZnSO_4_-treated group at a dose of 100 mg/kg (Qty 151.91 and 168.09; B% 37.64 and 41.65, respectively). Therefore, at the physiological state, both treated groups are completely similar to the control group (SI = 100.00%; GD = 0.00%).Fig. 5. Electrophoretic lipid moiety of native protein pattern showing the physiological effect of zinc sulfate (ZnSO_4_) against the toxicity induced by olanzapine on number and arrangement of the enzyme bands in liver tissue of rats. G1: control group, G2: OLZ-treated group, G3: OLZ + ZnSO_4_ at a dose of 50 mg/kg treated group, and G4: OLZ + ZnSO_4_ at a dose of 100 mg/kg treated group. Rf., relative mobility; Qty, band quantity; B%, band percent; SI%, similarity percent; GD%, genetic distance
Calcium Moiety of Native Protein Pattern
In the control liver, the native protein pattern showed five bands (Rfs 0.10, 0.26, 0.43, 0.59, and 0.90; Qty 93.60, 92.41, 93.54, 98.02, and 162.02; B% 10.16, 13.12, 5.47, 40.12, and 31.13, respectively) (Fig. 6). Four common bands (Rfs 0.10, 0.26, 0.43, and 0.59) were identified. No unique (characteristic) bands were detected. The physiological changes caused by OLZ injection were represented by the disappearance of one normal band without the appearance of abnormal ones. Therefore, the physiological similarity to the control group decreased to 88.89% (GD = 11.11%). In the rats treated with OLZ coinciding with ZnSO_4_ at both doses, the native pattern was improved by restoring the previously absent normal band (Rf 0.90) in the ZnSO_4_-treated group at a dose of 50 mg/kg (Qty 162.46; B% 14.79) and in the ZnSO_4_-treated group at a dose of 100 mg/kg (Qty 162.54; B% 26.97). Therefore, at the physiological state, both treated groups are identical to the control group by 100.00% (GD = 0.00%).Fig. 6. Electrophoretic calcium moiety of native protein pattern showing the physiological effect of zinc sulfate (ZnSO_4_) against the toxicity induced by olanzapine on number and arrangement of the enzyme bands in liver tissue of rats. G1: control group, G2: OLZ-treated group, G3: OLZ + ZnSO_4_ at a dose of 50 mg/kg treated group, and G4: OLZ + ZnSO_4_ at a dose of 100 mg/kg treated group. Rf., relative mobility; Qty, band quantity; B%, band percent; SI%, similarity percent; GD%, genetic distance
Native Isoenzyme Patterns
Catalase (CAT) Pattern
The CAT isoenzyme pattern in the control liver tissue was represented by four types (Rfs 0.13, 0.31, 0.57, and 0.90; Qty 104.87, 130.56, 137.18, and 160.22; B% 5.30, 5.72, 10.64, and 78.33, respectively) (Fig. 7). Two common bands were identified (CAT1 and CAT4; Rfs 0.13 and 0.90, respectively). The quantitative abnormalities caused by the treatment with OLZ were represented by the disappearance of two CAT types (CAT2 and CAT3). The physiological similarity of this group to the control group decreased to 66.67% (GD = 33.33%). The isoenzyme pattern was significantly improved by reintroducing only one missing normal (CAT2) type (Rf 0.31; Qty 129.95; B% 18.25) in the rats that received ZnSO_4_ treatment at a dose of 50 mg/kg. This closely resembled the control group at a physiological level by 85.71% (GD = 14.29%). The deleterious effect induced by OLZ was alleviated by restoring the two absent CAT types (CAT2 and CAT3) identified at Rfs 0.31 and 0.55 (Qty 130.77 and 141.33; B% 27.49 and 3.56, respectively) in the rats that received ZnSO_4_ treatment at a dose of 100 mg/kg. This completely resembled the control group at a physiological level (SI = 100.00%; GD = 0.00%).Fig. 7. Electrophoretic catalase (CAT) isoenzyme pattern showing the physiological effect of zinc sulfate (ZnSO_4_) against the toxicity induced by olanzapine on the number and arrangement of the enzyme bands in liver tissue of rats. G1: control group, G2: OLZ-treated group, G3: OLZ + ZnSO_4_ at a dose of 50 mg/kg treated group, and G4: OLZ + ZnSO_4_ at a dose of 100 mg/kg treated group. Rf., relative mobility; Qty, band quantity; B%, band percent; SI%, similarity percent; GD%, genetic distance
Peroxidase (POX) Pattern
In the control liver tissue, the POX isoenzyme pattern was represented by six types (Rfs 0.18, 0.35, 0.54, 0.72, 0.84, and 0.94; Qty 170.22, 180.36, 162.96, 159.59, 184.67, and 160.37; B% 18.10, 22.83, 4.13, 30.71, 14.49, and 9.74, respectively) (Fig. 8). Three common bands were identified (POX2, POX5, and POX6; Rfs 0.35, 0.84, and 0.94, respectively). In the OLZ-injected group, the disappearance of three normal POX types (POX1, POX3, and POX4) and the appearance of one characteristic abnormal band (Rf 0.64; Qty 166.76; B% 44.38) were indicative of qualitative changes. The physiological similarity of this group to the control group decreased to 60.00% (GD = 40.00%). The isoenzyme pattern was significantly improved by the disappearance of the characteristic band with the reintroduction of only two missing normal types (POX3 and POX4) (Rfs 0.54 and 0.73; Qty 157.95 and 163.74; B% 7.21 and 35.26, respectively) in the rats that received ZnSO_4_ treatment at a dose of 50 mg/kg. This closely resembled the control group at a physiological level by 90.91% (GD = 9.09%). The abnormalities caused by OLZ were alleviated by the disappearance of the characteristic band with the restoration of the three absent POX types (POX1, POX3, and POX4) identified at Rfs 0.17, 0.54, and 0.73 (Qty 162.03, 159.37, and 164.64; B% 11.51, 4.63, and 30.85, respectively) in the rats that received ZnSO_4_ treatment at a dose of 100 mg/kg. This was completely similar to the control group at the qualitative level (SI = 100.00%; GD = 0.00%).Fig. 8. Electrophoretic peroxidase (POX) isoenzyme pattern showing the physiological effect of zinc sulfate (ZnSO_4_) against the toxicity induced by olanzapine on number and arrangement of the enzyme bands in liver tissue of rats. G1: control group, G2: OLZ-treated group, G3: OLZ + ZnSO_4_ at a dose of 50 mg/kg treated group, and G4: OLZ + ZnSO_4_ at a dose of 100 mg/kg treated group. Rf., relative mobility; Qty, band quantity; B%, band percent; SI%, similarity percent; GD%, genetic distance
α-Amylase (α-Amy) Pattern
In the control liver tissue, this isoenzyme pattern appeared as two types (Rfs 0.29 and 0.75; Qty 98.73 and 97.98; B% 35.82 and 64.18, respectively) and was considered common bands (Fig. 9). No physiological or quantitative changes were detected in the OLZ-injected group. The treatment with ZnSO_4_ at both studied doses (50 and 100 mg/kg) showed no electrophoretic changes affecting the physiological similarity compared to the control group (SI = 100.00%; GD = 0.00%).Fig. 9. Electrophoretic amylase (Amy) isoenzyme pattern showing the physiological effect of zinc sulfate (ZnSO_4_) against the toxicity induced by olanzapine on number and arrangement of the enzyme bands in liver tissue of rats. G1: control group, G2: OLZ-treated group, G3: OLZ + ZnSO_4_ at a dose of 50 mg/kg treated group, and G4: OLZ + ZnSO_4_ at a dose of 100 mg/kg treated group. Rf., relative mobility; Qty, band quantity; B%, band percent; SI%, similarity percent; GD%, genetic distance
β-Esterase (β-EST) Pattern
In the control liver tissue, the β-EST isoenzyme pattern was represented by six types (Rfs 0.20, 0.27, 0.44, 0.55, 0.81, and 0.96; Qty 245.43, 111.70, 159.29, 147.01, 211.08, and 110.75; B% 35.73, 7.83, 7.73, 8.72, 12.52, and 27.47, respectively) (Fig. 10). Four common bands were identified (β-EST1, β-EST2, β-EST5, and β-EST6; Rfs 0.20, 0.27, 0.81, and 0.96, respectively). In the OLZ-injected group, the physiological alterations were represented by the disappearance of two normal types (β-EST3 and β-EST4). As a result, this group showed the lowest physiological similarity to the control group (SI = 80.00%; GD = 2.00%). In the rats treated with OLZ coinciding with ZnSO_4_ at both doses, the isoenzyme pattern was improved by restoring the previously absent normal types (β-EST3 and β-EST4; Rf 0.45 and 0.56, respectively) in the ZnSO_4_-treated group at a dose of 50 mg/kg (Qty 153.09 and 138.27; B% 11.43 and 8.73, respectively) and in the ZnSO_4_-treated group at a dose of 100 mg/kg (Qty 156.56 and 145.65; B% 10.80 and 8.50, respectively). Therefore, in the physiological state, both treated groups resembled the control group by 100.00% (GD = 0.00%).Fig. 10. Electrophoretic β-esterase (β-EST) isoenzyme pattern showing the physiological effect of zinc sulfate (ZnSO_4_) against the toxicity induced by olanzapine on number and arrangement of the enzyme bands in liver tissue of rats. G1: control group, G2: OLZ-treated group, G3: OLZ + ZnSO_4_ at a dose of 50 mg/kg treated group, and G4: OLZ + ZnSO_4_ at a dose of 100 mg/kg treated group. Rf., relative mobility; Qty, band quantity; B%, band percent; SI%, similarity percent; GD%, genetic distance
Absorption Spectra of Hemoglobin
Table 2 and Fig. 11 show the absorption spectra and associated absorbance bands of hemoglobin for all treatment groups as compared to the control group. During the current experiment, the concentration of hemoglobin for all groups under these conditions was found to be 3.4 × 10^−5^ M. The absorbance band at 340 nm (indicating globin-heme interaction) decreased significantly in the OLZ-treated group (G2), but groups treated with ZnSO_4_ (50 or 100 mg/kg) showed a considerable increase in absorbance at the same wavelength compared to the control group. Furthermore, animals treated with OLZ in combination with ZnSO_4_ at a dosage of 100 mg/kg (G4) had a significantly higher hemoglobin Soret band at 415 nm than rats given OLZ alone (G2). The absorbance band at 540 nm fell considerably in the groups treated with various levels of ZnSO_4_; although, a significant rise was seen in the group treated with OLZ in combination with ZnSO_4_ at a dosage of 50 mg/kg (G3) compared to the OLZ-treated group (G2). In rats treated with OLZ plus ZnSO_4_ at a dosage of 100 mg/kg (G4), the absorbance band at 578 nm (indicating heme-heme interaction) increased significantly compared to the OLZ-treated group (G2). The absorbance ratio A578/A540 was less than one in all groups, with a significant drop in the OLZ-treated group (G2) and a significant rise in the groups treated with ZnSO_4_ at all dosages (50 and 100 mg/kg) compared to the control group. Table 2. Absorbance of different hemoglobin bands of all treated groups compared to the control groupGroupGlobin-heme interaction (λ = 340 nm)Soret band (λ = 415 nm)λ = 540 nmHeme-heme interaction (λ = 578 nm)Ratio A578/A540G_1_0.7315 ± 0.00241.1725 ± 0.01670.691 ± 0.001730.642 ± 0.000560.9290G_2_0.5471 ± 0.00271^a^1.1367 ± 0.038^a^0.543 ± 0.0022^a^0.423 ± 0.00034^a^0.7790G_3_0.7030 ± 0.0025^ab^1.1531 ± 0.202^ab^0.679 ± 0.00062^ab^0.579 ± 0.00046^ab^0.8527G_4_0.7164 ± 0.0028^ab^1.1631 ± 0.215^ab^0.685 ± 0.00051^ab^0.599 ± 0.00043^ab^0.8744Data were presented as mean ± SE (from five replicates). The data were statistically examined using the Bonferroni test as a post-hoc analysis. “a” denotes significant difference (p ≤ 0.05) compared to the control group and “b” denotes significant difference (p ≤ 0.05) compared to the toxic group. G1: control group, G2: OLZ-treated group, G3: OLZ + ZnSO_4_ at a dose of 50 mg/kg treated group, and G4: OLZ + ZnSO_4_ at a dose of 100 mg/kg treated groupFig. 11Hemoglobin absorption spectra of treated groups compared to the control group. G1: control group, G2: OLZ-treated group, G3: OLZ + ZnSO_4_ at a dose of 50 mg/kg treated group, and G4: OLZ + ZnSO_4_ at a dose of 100 mg/kg treated group
Discussion
OLZ may have adverse consequences including weight gain, elevated plasma lipid levels, and hormonal abnormalities, despite being often used to treat schizophrenia and other psychiatric diseases [33]. According to the results of the current investigation, OLZ raised the levels of peroxidation products (LPO and TPC) by decreasing antioxidant system markers (TAC and GSH). This supports the theory of Miljevic et al. [34] that OLZ therapy causes oxidative stress, which could be a mechanism by which it raises the risk of diabetes and metabolic syndrome and causes these distinct unfavorable metabolic consequences. According to Xu and Zhuang [35], oxidative cell damage also leads to an increase in the oxidation of proteins and lipids after OLZ therapy. Furthermore, according to Holt [36], the activation of superoxide production—which is connected to the depletion of GSH—increases the level of malondialdehyde, an indicator of lipid peroxides, in the liver tissues of rats treated with OLZ. The administration of OLZ has been shown by Raben et al. [37] to enhance oxidative stress and cell damage in certain organs, particularly the liver, as a result of an increase in reactive oxygen species (ROS) generation. Supplementation with ZnSO_4_ increases the antioxidant state of the liver tissues, which is similar to the findings of Mard et al. [38], who showed that Zn helps reduce ROS production while preserving tissue integrity and function by stabilizing the activity of antioxidant enzymes. Zn also reduces collagen accumulation in the tissue and has an important physiological role in controlling cell shape and function.
TNF-α and IL-6 levels in the liver of the rats that received OLZ were significantly elevated in terms of inflammatory markers. This is consistent with the results of Calevro et al. [39] and Mahmoud and El-Deek [40], who pointed out that OLZ increased the pro-inflammatory cytokines IL-6 and TNF-α, which might have important consequences for metabolic dysregulation. Increases in TNF-α and IL-6 mRNA expression levels may raise the levels of these indicators [41]. When Zn was administered in addition to OLZ, the mean levels of these cytokines were considerably lower. The findings of Bonaventura et al. [42], who demonstrated that Zn preparations can reduce the production of TNF-α and IL-6 among other inflammatory cytokines, are consistent with this finding. According to Ni et al. [43], zinc preparations (ZnSO_4_) may have an anti-inflammatory impact because of their antioxidant function, which stabilizes cell membranes and lowers apoptosis.
The histopathological analysis demonstrated severe damage to the liver tissue as a result of OLZ treatment. This is consistent with the findings of Abd El-Hameed et al. [2], who observed that the liver of the OLZ-treated group had increased portal area congestion, severe lipid alterations, inflammatory infiltration, and vacuolization of hepatocytes. These effects could be linked to the production of ROS, which damage various cell membrane components. According to Contreras-Zentella and Hernández-Muñoz [44], these alterations are linked to increased lipid peroxidation, which causes cellular architecture to degenerate or be destroyed. Furthermore, the release of reactive species, cytokines, and chemokines from Kupffer cells, which led to the stimulation of extravasation and activation of neutrophils, explained the cellular infiltration [45]. The liver histoarchitecture was improved and restored to its typical state upon treatment with ZnSO_4_ at a dose of 100 mg/kg. This might be related to the stimulated antioxidant defense system in the liver in the presence of Zn, which reduces tissue injury caused by a free radical–mediated mechanism [46]. Moreover, ZnSO_4_ administration stimulates the synthesis of MT, which is responsible for maintaining the integrity of organelle membranes by increasing the expression of its mRNAs [47].
Physiological differences between treated groups can be detected using the electrophoretic method [48]. To ensure that various proteins and isoenzymes can carry out their biological roles, they are employed to evaluate their integrity [49]. By employing the SI percentage values as an analytical tool in conjunction with electrophoretic methods, the physiological condition of the tissue may be observed. High SI values indicate that the two samples’ band counts and configurations are almost the same [50].
The results of this study demonstrated that the OLZ-treated group had an altered native protein pattern. These changes might be linked to metabolic issues, which result in a reduction of glutathione and antioxidant activities as well as an excess of ROS [51]. Furthermore, by altering the way proteins fold, the excess ROS make it more difficult for chaperones to carry out their biological role [52].
An increase in ROS that target the lipid portion and oxidatively modify the lipid moiety of proteins may be the source of the physiological changes brought on by OLZ in the lipid moiety of the native protein pattern [53]. The protein binds to lipoproteins, of course. Consequently, modifying the lipid moiety may result in a change in the protein pattern [54].
Because OLZ inhibits the mineralization process, which is necessary for tissue protection and detoxification against harmful substances, it may alter the calcium moiety of the native protein pattern [55]. Variations in the tissue’s calcium ion concentration may modify this natural cycle [56].
Extracellular Zn is effective in enhancing insulin metabolism and lowering blood glucose levels through regulation of the insulin-signaling pathway or interaction with insulin receptors. Administering ZnSO_4_ improved the protein pattern and returned it to its normal physiological state [57].
Zn administration prevented oxidative damage to lipids and proteins in the tissue under study, leading to an increase in GSH levels. This, in turn, reduced peroxidation and carbonylation processes [58]. Furthermore, the efficiency of Zn in preventing oxidative stress resulting from an imbalance in oxidative/antioxidative processes helps protect cellular macromolecules from damage [59].
Antioxidant enzymes are tissue-dependent tools because their activity varies depending on the tissue. The electrophoretic patterns of CAT and POX in the liver tissues under study were changed by OLZ treatment. De Freitas et al. [60] claim that this shift may be connected to oxidative stress, altered metabolic pathways, and the generation of too many ROS, which might result in the breakdown of protein content and affect physicochemical and immunologic traits. The changed electrophoretic isoenzyme pattern may be a sign of a shift in the rate of protein production brought on by ROS-induced DNA damage, which would affect the fractional activities of the proteins [61]. Furthermore, elevated glucose levels may be a factor in these electrophoretic alterations by glycating these enzymes [62].
Since EST enzymes may accelerate the breaking of ester linkages to release acetylcholine during nervous system stimulation, it is widely accepted that they play an important role in the neurotransmission process [63]. Additionally, they hydrolyze neutral lipids that are delivered into cells into the appropriate carboxylic acids, which is necessary for their hypolipidemic action [64].
According to the current study, the differences in the electrophoretic β-EST pattern in the liver of the group treated with OLZ may be caused by changes in hormones, metabolism, or the expression of the protein part responsible for its enzymatic activity [65]. According to Seif et al. [63], deviations in the β-EST pattern might be caused by ROS’s impact on the protein molecule’s integrity, which could vary the pace at which reactive species-induced protein production occurs and change fractional activity linked to DNA damage. Protein instability and disintegration might result from glycosylation of β-EST types brought on by elevated glucose levels from the OLZ-induced metabolic disease [66].
The physiological abnormalities in all electrophoretic isoenzyme (CAT, POX, and β-EST) patterns that were caused in the liver of rats treated with OLZ were alleviated in a dose-dependent manner by administering the ZnSO_4_ solution. This is due to the effectiveness of exogenous Zn in boosting antioxidant status and improving antioxidant defense against ROS and peroxidation processes, protecting these vital biomacromolecules from oxidation [67, 68]. The MT, which is stimulated by Zn and contains cysteine residues, plays a significant role in reducing oxidative stress. MT overexpression in metabolic organs effectively reduces oxidative damage caused by hyperglycemia [69]. As a result, it reduces the electrophoretic changes caused by the glycosylation process.
Hemoglobin’s absorption spectrum can reveal important information about structural changes in the biomolecule. Reduced absorption at 340 nm and decreased Soret band absorbance (415 nm) in the OLZ-treated group relative to the control group indicate that hemoglobin’s structure has changed as a result of oxidative stress induced by OLZ. Through the activation of pro-inflammatory pathways, this oxidative stress likely contributes to cellular damage. For example, it has been demonstrated that OLZ activates nuclear factor kappa B (NF-κB), a transcription factor essential for inflammatory reactions. Tissue damage and metabolic dysfunction are exacerbated by the interaction of inflammation and oxidative stress. Increased ROS production, mitochondrial dysfunction, lipid peroxidation, and a compromised antioxidant defense system are the main causes of oxidative stress brought on by OLZ. Long-term usage of this imbalance may contribute to neurotoxicity and cause a number of adverse consequences, including metabolic diseases such as insulin resistance and dyslipidemia [70–73].
Hemoglobin stability during folding processes under stress is suggested by the notable rise in the Soret band absorbance at 415 nm and 340 nm in the rats treated with OLZ concurrently with ZnSO_4_ at a dosage of 100 mg/kg. In these conditions, hemoproteins showed increased binding to novel prosthetic groups, suggesting a change in globin-heme interactions [74].
The instability of oxyhemoglobin as a macromolecule is reflected in the OLZ-treated group’s drop in absorbance at 578 nm (heme-heme interaction) and the accompanying fall in the A578/A540 ratio. However, the enhanced heme-heme interaction and increase in the A578/A540 ratio showed that these alterations were reversed after ZnSO_4_ treatment. This implies that Met-Hb is reduced to HbO_2_, improving hemoglobin’s ability to carry oxygen and stabilizing oxyhemoglobin [75, 76].
By increasing the activity of enzymes such as superoxide dismutase (SOD), preserving glutathione levels, and lowering lipid peroxidation, Zn sulfate functions as a potent antioxidant. It is a potential drug for lowering oxidative stress and metabolic dysfunction brought on by OLZ because of its capacity to reduce inflammation, safeguard mitochondrial function, and enhance insulin sensitivity. For patients receiving long-term OLZ treatment, Zn supplementation may help reduce OLZ-induced adverse effects and enhance general health [77, 78].
Conclusion
Our findings reveal that Zn treatment improved the dynamic motion of hemoglobin and enhanced oxygen utilization. The administration of Zn along with OLZ may be favorable for schizophrenic patients since it reduced its adverse side effects. Moreover, the changes induced by OLZ in the antioxidants and inflammatory markers in the liver tissues, in addition to the severe lesions that were detected histopathologically, were alleviated by the ZnSO_4_ salt solution administered in a dose-dependent manner. Levels of these markers were restored to normal values by the highest ZnSO_4_ dose (100 mg/kg). Furthermore, the alterations caused by OLZ in native protein, lipid, and calcium moieties of the electrophoretically identified protein patterns were diminished by the ZnSO_4_ salt solution at both studied doses. Regarding the isoenzyme patterns, ZnSO_4_ normalized the physiological state of the electrophoretic CAT, POX, and β-EST isoenzyme patterns when administered at a dose of 100 mg/kg.
Supplementary Information
Below is the link to the electronic supplementary material.ESM 1(DOC 2.01 MB)