Prevalence of vitamin D deficiency and related factors among adults in Tokat province, Türkiye: a community-based cross-sectional study
Muzaffer Katar, Rıza Çıtıl, Yalçın Önder, Osman Demir

TL;DR
This study found high rates of vitamin D deficiency in adults in Tokat, Türkiye, with women, older adults, and obese individuals being most affected.
Contribution
The study provides new data on vitamin D deficiency prevalence and risk factors in an under-researched adult population in Türkiye.
Findings
38.7% of participants had vitamin D deficiency and 46.4% had insufficiency.
Female sex, obesity, and lower education were independent predictors of deficiency.
Public health interventions should target high-risk groups like women and older adults.
Abstract
Vitamin D deficiency is a major public health concern, worldwide yet data on the adult population in Türkiye remain limited. This study aimed to determine the prevalence of vitamin D deficiency and its associated risk factors in Tokat Province, Türkiye. A population based cross-sectional study was conducted among 2,225 adults aged ≥20 years through multistage stratified cluster sampling from both urban and rural areas. Data were obtained via structured questionnaires, anthropometric measurements, and fasting blood samples. Serum 25-hydroxyvitamin D3 [25(OH)D3] levels were measured and categorized as deficient (<10 ng/mL), insufficient (10–20 ng/mL), or sufficient (>20 ng/mL). Multivariate logistic regression was used to identify predictors of deficiency. The mean age was 47.2 ± 15.2 years, and 54.8% were women. Vitamin D deficiency was present in 38.7% and insufficiency in 46.4% of…
Genes, proteins, chemicals, diseases, species, mutations and cell lines named across the full text — each resolved to its canonical identifier and authoritative record.
Click any figure to enlarge with its caption.
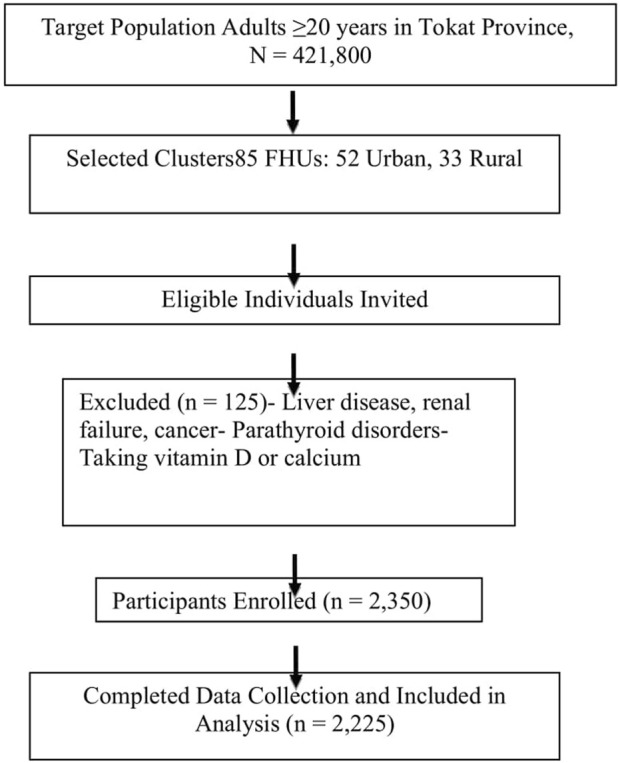 FIGURE 1
| Variables | VitD status | p | |||
|---|---|---|---|---|---|
| Total | Deficiency | Insufficiency | Sufficiency | ||
| Vitamin D | |||||
| Serum vitamin D level; n (%) | 2,225 (100) | 861 (38,7) | 1,033 (46,4) | 331 (14,9) | |
| Clinical parameters | |||||
| Height (cm) | 162.31 ± 9.54 | 161.52 ± 9.59 | 162.79 ± 9.52 | 162.82 ± 9.33 | 0.009 |
| Weight (kg) | 75.95 ± 14.82 | 75.39 ± 14.97 | 76.17 ± 14.72 | 76.72 ± 14.73 | 0.309 |
| Waist (cm) | 106.25 ± 11.29 | 106.59 ± 11.56 | 106 ± 11.08 | 106.14 ± 11.24 | 0.521 |
| WHR | 0.89 ± 0.08 | 0.88 ± 0.08 | 0.89 ± 0.09 | 0.89 ± 0.08 | 0.213 |
| BMI (kg/m2) | 28.88 ± 5.53 | 28.96 ± 5.77 | 28.78 ± 5.39 | 28.98 ± 5.34 | 0.731 |
| sBP (mmHg) | 12.41 ± 2.25 | 12.48 ± 2.22 | 12.36 ± 2.26 | 12.37 ± 2.33 | 0.504 |
| dBP (mmHg) | 7.74 ± 1.27 | 7.81 ± 1.24 | 7.7 ± 1.26 | 7.69 ± 1.36 | 0.113 |
| Obesity | |||||
| Normal | 1,367 (61.4) | 450 (52.3)a | 678 (65.6)b | 239 (72.2)b | <0.001 |
| Obese (BKİ >= 30) | 858 (38.6) | 411 (47.7)a | 355 (34.4)b | 92 (27.8)b | |
| Chronic disease | |||||
| Absent | 1,054 (47.4) | 347 (40.3)a | 524 (50.7)b | 183 (55.3)b | <0.001 |
| Present | 1,171 (52.6) | 514 (59.7)a | 509 (49.3)b | 148 (44.7)b | |
| Sociodemographic | |||||
| Age (year) ± SD | 47.17 ± 15.23 | 48.4 ± 15.95 | 46.44 ± 14.81 | 46.29 ± 14.47 | 0.011 |
| Gender; n (%) | |||||
| Woman | 1,220 (54.8) | 737 (85.6)a | 406 (39.3)b | 77 (23.3)c | <0.001 |
| Man | 1,005 (45.2) | 124 (14.4)a | 627 (60.7)b | 254 (76.7)c | |
| Age group (year); n (%) | |||||
| 20–39 | 889 (40) | 342 (39.7) | 408 (39.5) | 139 (42) | <0.001 |
| 40–64 | 988 (44.4) | 348 (40.4)a | 494 (47.8)b | 146 (44.1)ab | |
| 65+ | 348 (15.6) | 171 (19.9)a | 131 (12.7)b | 46 (13.9)ab | |
| Geographic localization; n (%) | |||||
| Urban | 1,299 (58.4) | 524 (60.9) | 583 (56.4) | 192 (58) | 0.149 |
| Rural | 926 (41.6) | 337 (39.1) | 450 (43.6) | 139 (42) | |
| Income status; n (%) | |||||
| <500 $ | 1,135 (51) | 454 (52.7) | 513 (49.7) | 168 (50.8) | 0.263 |
| 500–1,000 $ | 693 (31.1) | 268 (31.1) | 316 (30.6) | 109 (32.9) | |
| >1,000 $ | 397 (17.8) | 139 (16.1) | 204 (19.7) | 54 (16.3) | |
| Education | |||||
| Illiterate or literate. But no formal education | 393 (17.7) | 222 (25.8)a | 139 (13.5)b | 32 (9.7)b | <0.001 |
| Formal education under high school | 1,299 (58.4) | 490 (56.9) | 602 (58.3) | 207 (62.5) | |
| High school or above | 533 (24) | 149 (17.3)a | 292 (28.3)b | 92 (27.8)b | |
| Marital status | |||||
| Married | 1928 (86.7) | 728 (84.6) | 912 (88.3) | 288 (87) | <0.001 |
| Single | 140 (6.3) | 42 (4.9)a | 67 (6.5)ab | 31 (9.4)b | |
| Widowed | 157 (7.1) | 91 (10.6) | 54 (5.2) | 12 (3.6) | |
| Smoke | |||||
| Absent | 1,383 (62.2) | 677 (78.6)a | 554 (53.6)b | 152 (45.9)c | <0.001 |
| Present | 842 (37.8) | 184 (21.4)a | 479 (46.4)b | 179 (54.1)c | |
| Alcohol | |||||
| Absent | 2017 (90.7) | 834 (96.9)a | 905 (87.6)b | 278 (84)c | <0.001 |
| Present | 208 (9.3) | 27 (3.1)a | 128 (12.4)b | 53 (16)c | |
| Değişkenler | | Gender | p | |
|---|---|---|---|---|
| Total | Female | Male | ||
| Age (year) | 47.17 ± 15.23 | 46.64 ± 15.19 | 47.83 ± 15.28 | 0.067 |
| Height (cm) | 162.31 ± 9.54 | 162.08 ± 9.49 | 162.58 ± 9.58 | 0.222 |
| Weight (kg) | 75.95 ± 14.82 | 75.77 ± 14.92 | 76.17 ± 14.71 | 0.524 |
| Waist (cm) | 106.25 ± 11.29 | 106.22 ± 11.21 | 106.29 ± 11.38 | 0.869 |
| WHR | 0.89 ± 0.08 | 0.89 ± 0.08 | 0.89 ± 0.08 | 0.773 |
| BMI (kg/m2) | 28.88 ± 5.53 | 28.89 ± 5.62 | 28.86 ± 5.42 | 0.898 |
| sBP (mmHg) | 12.41 ± 2.25 | 12.47 ± 2.28 | 12.34 ± 2.22 | 0.195 |
| dBP (mmHg) | 7.74 ± 1.27 | 7.76 ± 1.3 | 7.71 ± 1.24 | 0.328 |
| Age group (year) | ||||
| 20–39 | 889 (40) | 506 (41.5) | 383 (38.1) | 0.223 |
| 40–64 | 988 (44.4) | 523 (42.9) | 465 (46.3) | |
| 65+ | 348 (15.6) | 191 (15.7) | 157 (15.6) | |
| Geographic localization | ||||
| Urban | 1,299 (58.4) | 703 (57.6) | 596 (59.3) | 0.424 |
| Rural | 926 (41.6) | 517 (42.4) | 409 (40.7) | |
| Income status | ||||
| <500 $ | 1,135 (51) | 677 (55.5)a | 458 (45.6)b | <0.001 |
| 500–1,000 $ | 693 (31.1) | 365 (29.9) | 328 (32.6) | |
| >1,000 $ | 397 (17.8) | 178 (14.6)a | 219 (21.8)b | |
| Smoke | ||||
| Absent | 1,383 (62.2) | 1,048 (85.9)a | 335 (33.3)b | <0.001 |
| Present | 842 (37.8) | 172 (14.1)a | 670 (66.7)b | |
| Alcohol | ||||
| Absent | 2017 (90.7) | 1,195 (98)a | 822 (81.8)b | <0.001 |
| Present | 208 (9.3) | 25 (2)a | 183 (18.2)b | |
| Education | ||||
| Illiterate or literate. But no formal education | 393 (17.7) | 330 (27)a | 63 (6.3)b | <0.001 |
| Formal education under high school | 1,299 (58.4) | 708 (58) | 591 (58.8) | |
| High school or above | 533 (24) | 182 (14.9)a | 351 (34.9)b | |
| Marital status | ||||
| Married | 1928 (86.7) | 1,040 (85.2)a | 888 (88.4)b | <0.001 |
| Single | 140 (6.3) | 54 (4.4)a | 86 (8.6)b | |
| Widowed | 157 (7.1) | 126 (10.3)a | 31 (3.1)b | |
| Obesity | ||||
| NORMAL | 1,367 (61.4) | 635 (52)a | 732 (72.8)b | <0.001 |
| Obese (BKİ >= 30) | 858 (38.6) | 585 (48)a | 273 (27.2)b | |
| Chronic disease | ||||
| Absent | 1,054 (47.4) | 505 (41.4)a | 549 (54.6)b | <0.001 |
| Present | 1,171 (52.6) | 715 (58.6)a | 456 (45.4)b | |
| Variable | Univariate | Multivariate | ||||||
|---|---|---|---|---|---|---|---|---|
| p | Odds | 95% confidence interval | p | Adjusted odds ratio | 95% confidence interval | |||
| Lower | Upper | Lower | Upper | |||||
| Age | 0.252 | 1,005 | 0.997 | 1,012 | 0.079 | 1,009 | 0.999 | 1,019 |
| Gender | <0.001 | 0.199 | 0.152 | 0.261 |
| 0.191 | 0.137 | 0.266 |
| Smoking | <0.001 | 0.457 | 0.361 | 0.579 | 0.820 | 1,033 | 0.781 | 1,366 |
| Alcohol | <0.001 | 0.468 | 0.334 | 0.655 | 0.440 | 0.868 | 0.605 | 1,244 |
| Education | 0.006 | 0.718 | 0.565 | 0.911 | 0.153 | - | - | - |
| Formal education under high school | <0.001 | 0.468 | 0.316 | 0.691 | 0.664 | 0.906 | 0.580 | 1,415 |
| High school or above | <0.001 | 0.425 | 0.278 | 0.650 | 0.479 | 1,209 | 0.715 | 2,043 |
| Marital status | 0.176 | 1,173 | 0.931 | 1,477 | 0.829 | 1,029 | 0.797 | 1,327 |
| Obesity | <0.001 | 1,764 | 1,364 | 2,282 | 0.124 | 1,241 | 0.943 | 1,633 |
| Chronic disease | 0.002 | 1,452 | 1,148 | 1,837 | 0.411 | 1,117 | 0.858 | 1,454 |
| Variable | Univariate | Multivariate | |||||||
|---|---|---|---|---|---|---|---|---|---|
| p | Odds | 95% confidence interval | p | Adjusted odds ratio | 95% confidence interval | ||||
| Lower | Upper | Lower | Upper | ||||||
| <10 ng/mL | Age | 0.033 | 1,009 | 1,001 | 1,018 |
| 1,017 | 1,006 | 1,029 |
| 10–20 ng/mL | Age | 0.876 | 1,001 | 0.992 | 1,009 | 0.394 | 1,004 | 0.994 | 1,015 |
| <10 ng/mL | Gender | <0.001 | 19,606 | 14,264 | 26,949 |
| 20,380 | 13,783 | 30,133 |
| 10–20 ng/mL | Gender | <0.001 | 2,136 | 1,608 | 2,837 |
| 2,271 | 1,612 | 3,200 |
| <10 ng/mL | Smoking | <0.001 | 4,333 | 3,305 | 5,680 | 0.761 | 0.948 | 0.671 | 1,339 |
| 10–20 ng/mL | Smoking | 0.015 | 1,362 | 1,062 | 1,746 | 0.838 | 0.971 | 0.729 | 1,293 |
| <10 ng/mL | Alcohol | <0.001 | 5,889 | 3,633 | 9,544 | 0.055 | 1,708 | 0.989 | 2,951 |
| 10–20 ng/mL | Alcohol | 0.092 | 1,348 | 0.953 | 1,907 | 0.700 | 1,075 | 0.745 | 1,550 |
| <10 ng/mL | Education | <0.001 | 2,135 | 1,633 | 2,791 |
| 0.681 | 0.481 | 0.966 |
| 10–20 ng/mL | Education | 0.887 | 1,018 | 0.792 | 1,310 | 0.059 | 0.752 | 0.559 | 1,011 |
| <10 ng/mL | Marital status | 0.285 | 0.817 | 0.565 | 1,183 | 0.616 | 0.896 | 0.583 | 1,376 |
| 10–20 ng/mL | Marital status | 0.534 | 1,125 | 0.776 | 1,633 | 0.519 | 1,136 | 0.771 | 1,674 |
| <10 ng/mL | Obesity | <0.001 | 0.421 | 0.320 | 0.555 | 0.061 | 0.742 | 0.544 | 1,013 |
| 10–20 ng/mL | Obesity | 0.027 | 0.735 | 0.560 | 0.966 | 0.255 | 0.849 | 0.640 | 1,126 |
| <10 ng/mL | Chronic disease | <0.001 | 0.546 | 0.423 | 0.705 | 0.259 | 0.839 | 0.618 | 1,138 |
| 10–20 ng/mL | Chronic disease | 0.149 | 0.833 | 0.649 | 1,068 | 0.544 | 0.920 | 0.701 | 1,206 |
Peer Reviews
No public reviews on file for this paper yet. If you reviewed it on a platform where reviews are public (OpenReview, ICLR, NeurIPS, ICML), you can paste yours below so the community can read it here.
Videos
No videos yet. Explain this paper in a talk, walkthrough, or lecture? Add one.
Taxonomy
TopicsVitamin D Research Studies · Nutritional Studies and Diet · Human Health and Disease
Introduction
Vitamin D deficiency is recognized as one of the most common public health problems worldwide. Low levels of vitamin D have been associated with a wide range of chronic and infectious conditions, including, diabetes (Hyppönen et al., 2001), cardiovascular disease (Lee et al., 2008), cancer (Holick, 2006a), multiple sclerosis (VanAmerongen et al., 2004), osteoporoz (Lips, 2001), autoimmune diseases (Cantorna et al., 2004), and microbial infections (White, 2008).
The role of vitamin D was first noted by Whistler in the 17th century in relation to rickets (O’riordan and Bijvoet, 2014). By the early 1900s, its fat-soluble nature, its production through ultraviolet (UV) sunlight exposure, and its antirachitic properties were described. The discovery of the specific forms vitamin D2 (ergocalciferol) and provitamin D3 (cholecalciferol) followed in the 1930s (DeLuca, 2014).
Vitamin D plays a critical role in bone metabolism as well as in various cellular and immunological processes. Inadequate sun exposure due to cultural clothing styles or excessive use of sunscreens, along with insufficient dietary intake or lack of supplementation, are common reasons for this vitamin D deficiency (Lips, 2007). Tropospheric ozone has also been linked to reduced synthesis of vitamin D. Other factors such as skin pigmentation, age, body weight, malabsorption disorders, and conditions affecting vitamin D metabolism can also influence serum levels (Holick, 2006b).
Currently, plasma (or serum) 25-hydroxyvitamin D [25(OH)D] is considered the best indicator of vitamin D status (Manicourt and Devogelaer, 2008), reflecting total input from cutaneous synthesis, diet, and supplements (Holick, 2007). The circulating concentration of 25(OH)D represents the cumulative effect of dietary intake and sunlight exposure, and it is widely accepted as a reliable marker of vitamin D status (Holick, 1996).
Although there is no universal consensus on the optimal serum level of 25(OH)D, most experts define deficiency as a level below 20 ng/mL (Holick, 2007). It is estimated that vitamin D deficiency affects approximately 30%–50% of the general population worldwide, yet this widespread condition often remains undiagnosed and untreated (Lee et al., 2008). To date, there is limited data available regarding the vitamin D status of adults in Türkiye (Atli et al., 2005; Alagöl et al., 2000; Guzel et al., 2001; Erkal et al., 2006).
This study aimed to determine the prevalence of vitamin D deficiency and insufficiency among adults in Tokat Province, Türkiye, and to identify sociodemographic and lifestyle factors associated with low vitamin D status.
Materials and methods
Study design, population, and sampling
This population-based cross-sectional study was conducted in Tokat Province, Turkey, including both urban and rural areas. The target population comprised adults aged ≥20 years, which based on the report by the Turkish Institute of Statistics as of 31 December 2021, the population in the province is 602,567.
Sample size was calculated assuming a 35% expected prevalence of vitamin D deficiency, 3% margin of error, 95% confidence level, and a design effect of 2, yielding a minimum required sample of 1,955 participants. Using multistage stratified proportional cluster sampling, 85 clusters (52 urban, 33 rural) representing 50% of all Family Health Units (FHUs) were selected proportionally by age and sex according to the local population pyramid. Ultimately, data were collected from 2,225 participants.
Individuals with a history of liver disease, renal failure, cancer, parathyroid disorders, or who were taking calcium/vitamin D supplements were excluded from the study. More clearly shown in Figure 1.
Flow diagram of participant selection, recruitment, and final data analysis.
Data collection procedures
Data were collected between 10 April and 1 June 2013. However, given the time elapsed since data collection, changes in lifestyle, economy, and health awareness may have influenced current vitamin D status, which should be considered when interpreting these findings. Trained staff measured height, weight, waist and hip circumference using standardized protocols. Blood pressure was measured twice after a 15-min rest with a validated sphygmomanometer. Fasting blood samples were collected in the morning after an overnight fast of (at least 8 hours). All samples were stored at −80 °C. until analysis.
Participants completed a structured face-to-face interview that included sociodemographic characteristics, medical history, lifestyle factors, and dietary calcium intake.
Biochemical analyses
Serum 25-hydroxyvitamin D3 [25(OH)D3] concentrations were determined using Roche Elecsys Vitamin D Total III assay kits on a Roche Cobas e 601 analyzer (Roche Diagnostics, Germany).
Definitions
- Vitamin D Status: Categorized according to the 2020 Turkish Endocrinology and Metabolism Society (TEMD) guidelines as deficiency (<10 ng/mL), insufficiency (10–20 ng/mL), sufficient for bone health (>20 ng/mL), sufficient for extra-skeletal benefits (30–50 ng/mL), and intoxication (>150 ng/mL) (1 ng/mL = 2.5 nmol/L) (Prevention et al., 2003).
- Sunlight Exposure: Although direct measurement was not performed, data collection was conducted during spring, when average daily sunlight duration ranges from 6.2 to 8.0 h with temperatures between 6.7 °C and 27.0 °C. Most rural participants engaged in outdoor farming activities between 10 AM and 4 PM, generally without sunscreen.
Statistical analysis
Continuous variables are reported as mean ± standard deviation, and categorical variables as frequencies and percentages. Group comparisons were performed using independent-sample t-tests or one-way ANOVA for continuous variables and chi-square tests for categorical variables. Multivariate logistic regression was used to identify factors associated with vitamin D deficiency. A two-tailed p-value <0.05 was considered statistically significant. Analyses were conducted using IBM SPSS Statistics version 20 (IBM Corp., Armonk, NY, United States).
Ethics approval and permissions
The study protocol was reviewed and approved by the Clinical Research Ethics Committee of Tokat Gaziosmanpaşa University Faculty of Medicine (Approval No: 13-KAEK-024). Administrative permissions were obtained from relevant health authorities prior to data collection. The present study, which utilized these samples for vitamin D status analyses, approved by the Clinical Research Ethics Committee of Tokat Gaziosmanpaşa University Faculty of Medicine (Approval No: 21-KAEK-042). Researchers fully adhered to ethical guidelines throughout the study process, The study was supported by the Scientific Research Projects Unit (BAP) of Tokat Gaziosmanpaşa University for assay kits (Code number: 200/112).
Results
A total of 2,225 adults participated in the study, including 1,220 (54.8%) women and 1,005 (45.2%) men. The mean age was 47.17 ± 15.23 years. Based on serum 25(OH)D3 levels, 38.7% of participants were classified as vitamin D deficient (<10 ng/mL), 46.4% as insufficient (10−20 ng/mL), and only 14.9% had sufficient levels (>20 ng/mL) (Table 1). These findings indicate that the majority of the population has suboptimal vitamin D status.
Women were significantly more likely to be vitamin D deficient compared to men (p < 0.001). The prevalence of deficiency (<10 ng/mL) was highest among older participants: individuals with lower income and education levels tended to have lower vitamin D levels (p < 0.001). On the other hand widowed individuals had higher mean vitamin D levels than married or single individuals (p < 0.001) (Table 1).
Lifestyle factors negatively affect vitamin D levels. Participants who did not smoke or consume alcohol had lower vitamin D levels than smokers and drinkers (p < 0.001), On the other hand, there were no significant differences in mean height, weight, waist circumference, waist-to- hip ratio, or blood pressure among vitamin D groups (p > 0.05), Participants with obesity (BMI ≥30) had a higher prevalence of deficiency compared to normal-weight individuals (p < 0.001). Similarly, those with chronic diseases had significantly lower vitamin D levels than participants without chronic conditions (p < 0.001). Interestingly, although obesity is generally associated with lower vitamin D, some data suggested slightly higher levels among certain obese subgroups, highlighting possible confounding effects of age and lifestyle (Table 1).
Significant sex-based differences were observed in demographic and clinical variables. Female participants had higher rates of obesity and chronic diseases (e.g., hypertension, DM), whereas males showed higher smoking and alcohol use (p < 0.05) (Table 2).
Multivariate analysis
In multivariate analysis, the factors that remained associated with vitamin D deficiency after adjustment were: Gender: Women had significantly higher odds of vitamin D deficiency compared to men (AOR 0.191; 95% CI 0.137–0.266; p < 0.001). Other factors such as age, smoking, alcohol, education, obesity, and chronic disease were not significant after being controlled simultaneously (p > 0.05).
The multinomial model shows: Women have a much higher risk of vitamin D deficiency, either in the <10 ng/mL category (AOR 20.38; 95% CI 13.78–30.13) and 10–20 ng/mL (AOR 2.27; 95% CI 1.61–3.20) than men (p < 0.001). Older age significantly increases the risk of severe deficiency (<10 ng/mL) (AOR 1.017 per year; 95% CI 1.006–1.029; p = 0.003). Low education was associated with a higher risk for <10 ng/mL (AOR 0.681; 95% CI 0.481–0.966; p = 0.031).
Obesity, chronic disease, smoking, and alcohol consumption were not significantly associated after adjustment (Tables 3, 4).
Overall taken together, these results indicate that vitamin D deficiency is common across all age groups but is particularly prevalent among women, the older adult, individuals with lower socioeconomic status, those with chronic diseases, and obese individuals. The observed inverse relationship between age, income, education, and vitamin D levels underlines the potential impact of social determinants on vitamin D status in this population.
Discussion
This study comprehensively assessed the relationship between serum vitamin D levels and a broad range of sociodemographic, behavioral, and clinical factors in a large adult population in Türkiye. Our findings demonstrate that vitamin D deficiency is highly prevalent and confirm that specific subgroups—including women, older adults, and individuals with obesity—are at significantly higher risk (Tables 1, 2, 4).
More than 85% of participants had serum vitamin D levels below 20 ng/mL, consistent with global evidence indicating widespread hypovitaminosis D even in countries with abundant sunlight exposure (Qureshi et al., 2024).
Gender emerged as the strongest independent determinant: women were significantly more likely to have both severe (<10 ng/mL) and moderate (10–20 ng/mL) deficiency of vitamin D than men, possibly due to cultural clothing practices, less outdoor activity, and hormonal influences (Kader et al., 2020). Sex-based differences in lifestyle and clinical characteristics may contribute to the higher prevalence of vitamin D deficiency observed among women. This finding aligns with prior studies demonstrating higher deficiency rates in females attributable to cultural clothing patterns, lower sun exposure, and metabolic differences (Choi et al., 2019). For example: These findings align with earlier studies reporting high prevalence of deficiency across Turkey. Founded a deficiency rate of nearly 75% in adults from the Aegean region, with women at higher risk due to clothing limiting sun exposure (Hekimsoy et al., 2010)
Occupational studies by Aykal et al. (2016) and Skarphedinsdottir et al. (2014) emphasizing that indoor working conditions revealed high deficiency rates among operating room staff and anesthesia care providers in Turkey, Iceland, and the US (Du et al., 2023; Chu et al., 2021; Zhao et al., 2017). Add literature related to gender hormones.
Age showed a nuanced pattern; although mean age did not differ significantly in crude comparisons, regression analysis revealed that younger and middle-aged adults had significantly lower odds of severe deficiency than older adults, in line with literature indicating reduced cutaneous synthesis and increased chronic disease burden in older adult populations (Gallagher, 2013). Obesity was also a significant factor, with obese participants having up to 76% higher odds of deficiency—likely due to vitamin D sequestration in adipose tissue (Pereira-Santos et al., 2015) —although this association weakened but remained significant after adjustment.
Behavioral factors such as smoking and alcohol use initially appeared inversely related to deficiency but lost significance after adjustment, reflecting confounding by lifestyle and socioeconomic patterns. Likewise, lower education level was associated with greater risk in crude analyses but did not remain significant in adjusted models. Chronic diseases were related to deficiency in univariate analysis but not independently, likely due to collinearity with age and obesity.
The health consequences of vitamin D deficiency extend beyond bone metabolism. It may play a role in neurodegenerative disorders: Knekt et al. (2010) demonstrated a significant inverse association between baseline vitamin D levels and Parkinson’s disease risk in a Finnish cohort over nearly three decades. Sato et al. (1997) and Evatt et al. (2008) likewise reported lower vitamin D levels and higher prevalence of deficiency in Parkinson’s patients compared to controls. In our research, it was found that the patient subgroup, who experienced chronic disease, had a lower rates of deficiency, possibly due to smaller sample size and greater sunlight exposure in our region, but the trend remains consistent with international evidence suggesting neuroprotective effects via antioxidative mechanisms and neuronal calcium modulation. Further research with larger cohorts and cerebrospinal fluid analyses is needed to clarify this potential link.
Multiple international studies support these findings. Hovsepian et al. (2011) in Iran reported a median 25(OH)D level of 18–21 ng/mL, with deficiency prevalence exceeding 50%, higher among women and younger adults, and worse during autumn–winter. Brot et al. (2001) in Denmark showed that vitamin supplementation and intentional sun exposure raised serum levels significantly, while Heidari and Mirghassemi (2012) found a strikingly high 70% deficiency rate in Iranian adults, again worse for women. Occupational studies by Aykal et al. (2016) and Skarphedinsdottir et al. (2014) revealed high deficiency rates among operating room staff and anesthesia care providers in Türkiye, Iceland, and the US, emphasizing that indoor working conditions and lifestyle factors are key contributors.
Childhood and adolescent data echo this pattern. Aypak et al. (2013) showed nearly universal deficiency in Turkish children, with stronger associations in females and pubertal adolescents, and identified potential links to insulin resistance. Ethnic disparities have also been reported: Ford et al. (2006) highlighted higher deficiency rates among Asian and Black Afro-Caribbean groups in the UK, especially among women. Sahota et al. (2004) showed moderate seasonal variation and a clear inverse correlation between 25(OH)D and PTH levels, underlining potential effects on calcium homeostasis.
Despite abundant sunlight in Türkiye, factors such as latitude (around 39°N), cultural dress codes, modern indoor lifestyles, and limited supplementation contribute to persistent deficiency. Moreover, there is no universal consensus on optimal serum 25(OH)D thresholds; the WHO defines levels below 10 ng/mL as deficient, while other organizations consider <20 ng/mL insufficient and <10 ng/mL as severe deficiency (Prevention, 2003).
Key strengths of our study include its large representative sample and robust multivariate analysis, adding valuable national data to the global literature. However, limitations include its cross-sectional design, absence of seasonal follow-up, and lack of detailed dietary assessments. Additionally, since data collection occurred only in spring and early summer, the prevalence of vitamin D deficiency may have been underestimated due to seasonal variation. We measured vitamin D levels during summer when they are expected to peak; future research should include winter–spring sampling and more precise tracking of dietary intake, supplementation, and sun exposure habits. In addition, future studies should collect more detailed data on sunlight exposure duration, use of protective clothing, and dietary sources of vitamin D to improve exposure assessment accuracy.
In conclusion, our findings reinforce that vitamin D deficiency is highly prevalent in Türkiye and globally, with higher risk among women, older adults, obese individuals, indoor workers, and populations with cultural or lifestyle-related sun avoidance. Preventive public health strategies should prioritize awareness, routine screening, safe sun exposure, and appropriate supplementation to address this modifiable but significant health burden.
Conclusion
In summary, this large, population-based study confirms that vitamin D deficiency is highly prevalent in the adult population of Tokat, Türkiye, reflecting a broader national and global public health challenge. Our results highlight that women, older adults, and individuals with obesity are particularly vulnerable to severe deficiency, despite living in a region with sufficient sunlight.
Given the growing evidence linking vitamin D status not only to bone and musculoskeletal health but also to neurological, metabolic, and chronic diseases, effective public health measures are urgently needed. Regular screening, education on safe sun exposure, dietary improvements, and targeted supplementation strategies should be prioritized for high-risk groups.
Future research should be prioritized for high-risk groups. Public health authorities should also consider national vitamin D fortification policies, population-level screening programs, and awareness campaigns to address widespread deficiency.
Addressing this modifiable risk factor through coordinated prevention and awareness efforts can significantly contribute to reducing the burden of vitamin D deficiency–related morbidity and improving overall population health.
The reference list from the paper itself. Each links out to its DOI / PubMed record.
- 1Alagöl F. Shihadeh Y. Boztepe H. Tanakol R. Yarman S. Azizlerli H. (2000). Sunlight exposure and vitamin D deficiency in Turkish women. J. Endocrinological Investigation 23, 173–177. 10.1007/BF 03343702 10803475 · doi ↗ · pubmed ↗
- 2Atli T. Gullu S. Uysal A. Erdogan G. (2005). The prevalence of vitamin D deficiency and effects of ultraviolet light on vitamin D levels in older adult Turkish population. Archives Gerontology Geriatrics 40, 53–60. 10.1016/j.archger.2004.05.006 15531023 · doi ↗ · pubmed ↗
- 3Aykal G. Cerit N. Tekeli S. Ö. EllidağH. Y. YıLMAZN. (2016). Ameliyathane personelinde D vitamini eksikliği ve yetersizliği prevalansı. Türk Klin. Biyokim. Derg. 14, 18–25.
- 4Aypak C. YıKıLKANH. Dicle M. ÖnderÖ. Görpelioğlu S. (2013). Erişkin obez hastalarda D vitamini düzeyinin vücut kitle indeksi ile ilişkisi. Haseki Tıp Bülteni 51, 95–98. 10.4274/haseki.954 · doi ↗
- 5Brot C. Vestergaard P. Kolthoff N. Gram J. Hermann A. P. Sørensen O. H. (2001). Vitamin D status and its adequacy in healthy Danish perimenopausal women: relationships to dietary intake, sun exposure and serum parathyroid hormone. Br. J. Nutr. 86, S 97–S 103. 10.1079/bjn 2001345 11520426 · doi ↗ · pubmed ↗
- 6Cantorna M. T. Zhu Y. Froicu M. Wittke A. (2004). Vitamin D status, 1, 25-dihydroxyvitamin D 3, and the immune system. Am. Journal Clinical Nutrition 80, 1717 S–1720 S. 10.1093/ajcn/80.6.1717 S 15585793 · doi ↗ · pubmed ↗
- 7Choi S. B. Jung Y. T. Lee J. G. (2019). Association of initial low serum selenium level with infectious complications and 30-day mortality in multiple trauma patients. Nutrients 11, 1844. 10.3390/nu 11081844 31395837 PMC 6723457 · doi ↗ · pubmed ↗
- 8Chu C. Tsuprykov O. Chen X. Elitok S. Krämer B. K. Hocher B. (2021). Relationship between vitamin D and hormones important for human fertility in reproductive-aged women. Front. Endocrinology 12, 666687. 10.3389/fendo.2021.666687 33935976 PMC 8081388 · doi ↗ · pubmed ↗