Disruption of a six-nucleotide miRNA motif improves PKD1 dosage and ameliorates polycystic kidney disease
Ronak Lakhia, Chunzi Song, Laurence Biggers, Maggie Zumwalt, Jesus Alvarez, Arvind Somasundaram, Harini Ramalingam, Patricia Cobo-Stark, Vishal Patel

TL;DR
Scientists disrupted a six-nucleotide miRNA motif to increase PKD1 protein levels and reduce kidney cysts in a mouse model of polycystic kidney disease.
Contribution
The study identifies a minimal six-nucleotide miR-17 motif in PKD1's 3′UTR and demonstrates its disruption as a therapeutic strategy for ADPKD.
Findings
Disrupting the six-nucleotide miR-17 motif in PKD1's 3′UTR stabilizes Pkd1 mRNA and increases PC1 protein levels.
A steric-blocking oligonucleotide targeting the motif reduces cyst growth and preserves kidney function in mouse models.
The oligonucleotide treatment also mitigates cystic events in patient-derived ADPKD cells.
Abstract
Disrupting microRNA interactions to restore protein expression from haploinsufficient genes offers a promising precision-therapy strategy for monogenic disorders. PKD1 heterozygosity underlies autosomal dominant polycystic kidney disease (ADPKD), a disorder affecting nearly 12 million people worldwide, where reduced PKD1 dosage drives progressive cyst formation and kidney failure. We previously identified a 55-bp cis-repressive element in the PKD1 3′UTR. Here, we define a six-nucleotide miR-17 seed match within this element that is sufficient to reproduce PKD1 repression. In vivo base substitution of this motif stabilizes Pkd1 messenger RNA and increases polycystin-1 (PC1) protein levels, producing a robust reduction in cyst growth and preservation of kidney function in mouse models. To therapeutically recapitulate this effect, we developed a steric-blocking oligonucleotide that…
Genes, proteins, chemicals, diseases, species, mutations and cell lines named across the full text — each resolved to its canonical identifier and authoritative record.
Click any figure to enlarge with its caption.
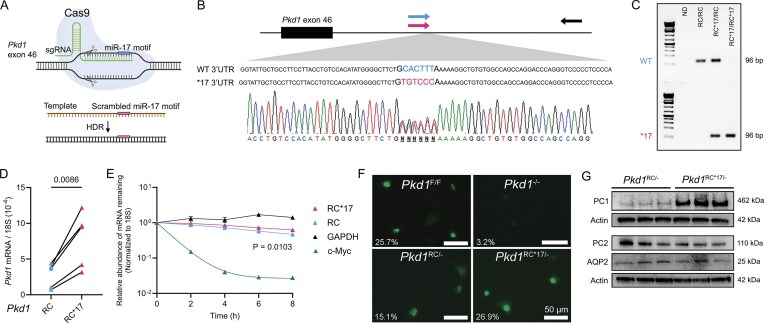 Figure 1
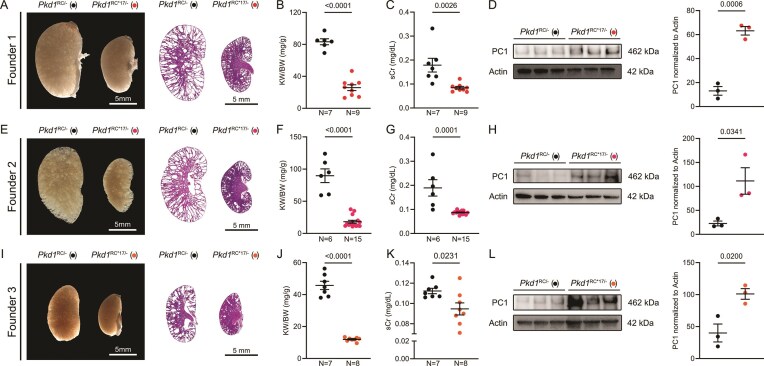 Figure 2
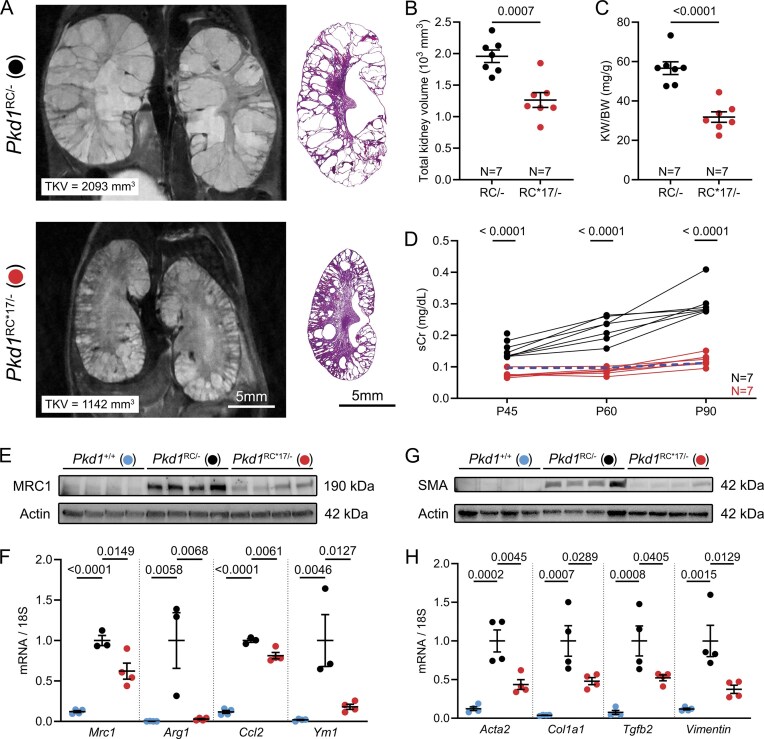 Figure 3
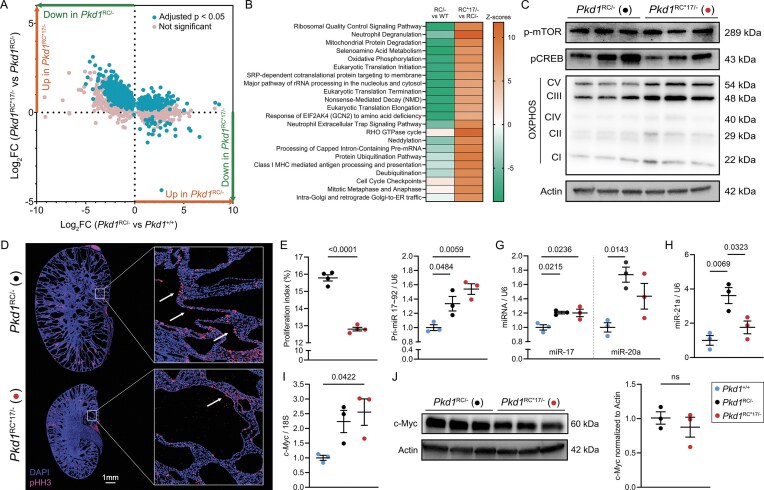 Figure 4
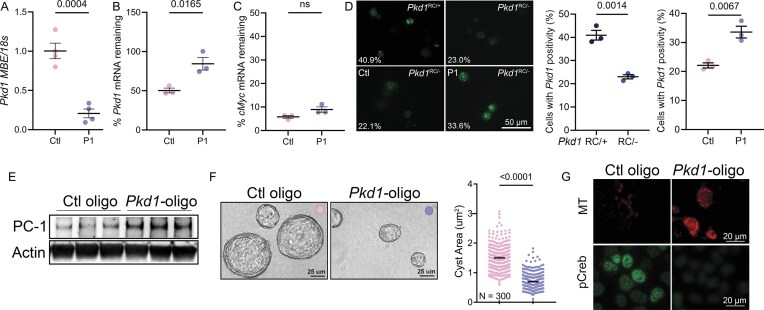 Figure 5
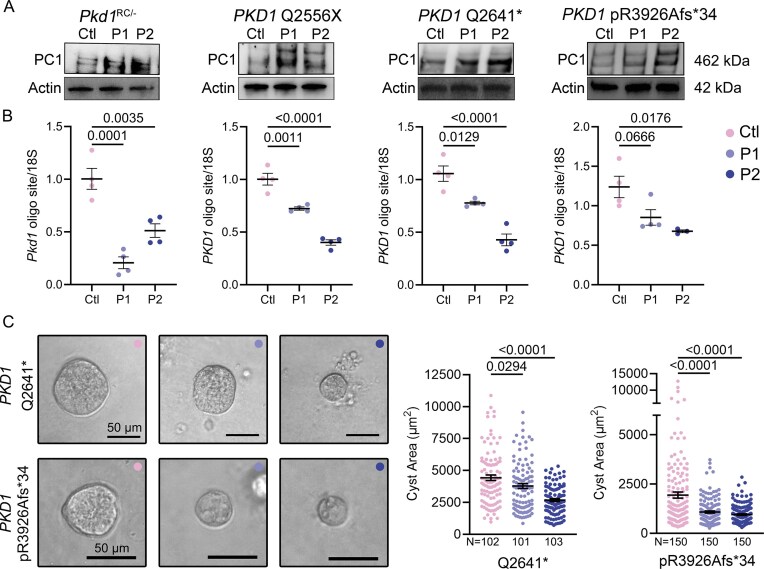 Figure 6
- —National Institute of Health
- —PKD-RRC Sprint
Peer Reviews
No public reviews on file for this paper yet. If you reviewed it on a platform where reviews are public (OpenReview, ICLR, NeurIPS, ICML), you can paste yours below so the community can read it here.
Videos
No videos yet. Explain this paper in a talk, walkthrough, or lecture? Add one.
Taxonomy
TopicsGenetic and Kidney Cyst Diseases · Renal and related cancers · Vascular Malformations and Hemangiomas
Introduction
MicroRNAs (miRNAs) are ubiquitous posttranscriptional regulators that fine-tune gene expression by base-pairing to short motifs within messenger RNA (mRNA) 3′-untranslated regions (3′UTRs) [1, 2]. By coordinately causing relatively modest changes in stability or translation of mRNA networks, miRNAs exert broad effects on cellular physiology and disease phenotypes [3, 4]. However, in certain contexts, a single miRNA interaction can play an outsized regulatory role by suppressing a disease-critical transcript, as occurs in monogenic disorders [5]. Despite this potential, nucleotide-level dissection of individual miRNA motifs, which could enable precise therapeutic targeting, remains rare. This gap is particularly consequential in haploinsufficient diseases, where selectively evading miRNA-mediated repression could restore native gene dosage and confer substantial therapeutic benefit while minimizing off-target effects.
Autosomal dominant polycystic kidney disease (ADPKD) provides a compelling example of a haploinsufficient disorder in need of such targeted strategies. ADPKD is most often caused by heterozygous loss-of-function mutations in PKD1, the gene encoding polycystin-1 (PC1) [6]. Reduced dosage of PKD1 initiates cyst formation and drives progressive replacement of functional parenchyma, ultimately leading to kidney failure in many patients. Current disease-modifying therapy is limited to tolvaptan, which slows eGFR decline but has tolerability and safety limitations [7, 8]. Thus, approaches that increase endogenous PKD1 expression in affected cells are of major therapeutic interest.
The miR-17 family has emerged as a central suppressor of PKD1 and PKD2 expression. Genetic and pharmacologic inhibition of miR-17 in preclinical ADPKD models increases polycystin levels and slows cyst growth [5, 9–11]. Notably, the anti-miR-17 oligonucleotide farabursen has demonstrated favorable pharmacodynamic effects, biomarker responses, and trends toward reduced kidney growth in early-phase clinical trials and is now advancing in development for ADPKD [12, 13]. While these studies establish miR-17 as a disease-relevant regulator, they also highlight an alternative strategy—precisely blocking miR-17 interaction on the PKD1 transcript. This approach would theoretically preserve the broader regulatory functions of the miRNA while selectively restoring the PKD1 gene.
We previously showed that deletion of an ~55-bp segment of the PKD1 3′UTR that includes a predicted miR-17 binding site increases PKD1 translation and attenuates disease phenotypes in ADPKD model systems [5]. However, deletions of this size necessarily remove other *cis-*elements and potential RNA-binding protein sites, making it difficult to ascribe the observed benefits specifically to the loss of miR-17 binding. Resolving this ambiguity requires nucleotide-level fine mapping to define the minimal motif within the 3′UTR required to mediate miR-17-dependent repression and whether that motif is amenable to targeted therapeutic intervention. Canonical miRNA targeting depends principally on Watson–Crick base pairing between the miRNA seed (nucleotides 2–7) and a complementary stretch in the mRNA [1]. This mechanistic simplicity presents an opportunity for discrete modification or steric masking of those bases to selectively disrupt repression without perturbing broader UTR architecture.
Here, we employ complementary genetic and pharmacologic approaches to address these questions. First, we generated a base-edited allele in which six nucleotides of the Pkd1 3′UTR miR-17 motif are altered in the genome, preventing canonical pairing while preserving the UTR’s broader architecture. Second, we designed a steric-blocking oligonucleotide complementary to the same minimal motif to test whether transient masking could phenocopy the genetic edit. Using primary renal epithelial cells, engineered cell lines, and mouse models, we evaluated the impact of seed disruption or oligonucleotide masking on Pkd1/PKD1 mRNA stability, PC1 protein abundance, cyst growth, and downstream pathogenic programs.
Materials and methods
Generation of Pkd1RC*17/RC mice
Ksp ^Cre^;Pkd1^RC/RC^ female and male mice on a C57BL/6J background were used for creation of Pkd1^RC17/RC^ mice [14, 15]. A DNA template was designed with 50-nucleotide homology arms flanking the 6 cardinal nucleotides complementary to the seed of miR-17, which were modified purine for purine and pyrimidine for pyrimidine as noted in Supplementary Table S4. A standard hormonal regimen that was used to induce superovulation was induced in prepubertal female. Sperm was harvested from the epididymis of male mice, after which in vitro fertilization was performed. CRISPR reagents (HDR template, Single Guide RNA (sgRNA) and Cas9 protein, IDT) were introduced into the cytoplasm of one-cell fertilized eggs via electroporation using the Nepa21 Super Electroporator (NEPAGENE, Ichikawa, Japan). Eggs that survived electroporation were washed and cultured in microdrops of fresh M16 media. Next, the eggs were surgically delivered into oviducts of day 1 pseudopregnant ICR female mice. At postnatal day 27, identification of Pkd1^RC17/RC^ mice was performed using genotyping and confirmed with Sanger sequencing. Primer sequences are noted in Supplementary Table S4.
Mice
Ksp ^Cre^, Pkd1^F/F^, and Pkd1^RC/RC^ mice on a C57BL/6J background were used for all experiments [14–16]. At the time of sacrifice, mice were anesthetized with isoflurane, blood was collected using cardiac puncture, and the right kidney was retrieved, weighed, and immediately flash-frozen in liquid nitrogen. The left kidney was perfused with 1× phosphate-buffered saline (PBS) followed by 4% (wt/vol) paraformaldehyde and then immersed in 4% paraformaldehyde for 2 h before transferring to 1× PBS for storage or further processing. Equal male and female mice were used for all studies. All animal experiments have been approved by the UTSW Institutional Animal Care and Use Committee.
Histology
Histology was performed using standard protocols by the UTSW Histology Core. The tissues were embedded in paraffin and sliced into 5-µm sections. Staining was performed with hematoxylin-eosin (H&E) and unstained slides were used for immunofluorescence staining. All stained sections were imaged with a slide scanner. Cyst Index (cyst area/total kidney area) was calculated using ImageJ software.
Isolation of primary kidney tubule epithelial cells
Primary epithelial cells were isolated from 10- to 14-day-old Pkd1^RC17/RC17^, Pkd1^RC17/RC^, and Pkd1^RC/RC^ mice kidneys. Briefly, each mouse was perfused first with Dulbecco’s modified Eagle medium (DMEM) and then with DMEM containing 0.5% collagenase. Kidneys were retrieved, washed, and then minced into 1-mm pieces before incubating in prewarmed 0.5% collagenase in DMEM for 15 min at 37°C with shaking. Samples were passed through an 18-gauge needle (3–4×) and then returned to 37°C with shaking for an additional 15 min. Samples were subsequently filtered through a 40-µm cell strainer, washed with complete media, and pelleted. Cells were resuspended in PBS with 0.1% bovine serum albumin (BSA) then incubated in 10 µg/ml biotinylated dolichos biflorus agglutinin (DBA) (VectorLabs, #B-1035). After 1 h, cells were pelleted and washed with PBS with 0.1% BSA, and subsequently DBA positive cells were isolated using CELLection Biotin binder kit (Invitrogen, #11533D). Primary cells were plated and grown in culture media for 48 h and then used for experiments or set up for immortalization. Primary Pkd1^RC/−^ and Pkd1^RC17/−^ cells were immortalized using SV40 T Antigen Cell Immortalization Kit (ALSTEM, #CILV01). Cells were placed in a 96-well plate for single clone expansion and genotyped for SV40, Pkd1^RC/−^ or Pkd1^RC*17/−^, and Ksp^Cre^ by DNA PCR. Clones positively identified by genotyping for SV40 and Ksp^Cre^ were stained for kidney tubule epithelial markers. Cell lines that stained positive for Aquaporin 2 (Sigma–Aldrich, #A7310) and HNF1β (Santa Cruz Biotechnology, #sc-22840) (Supplementary Fig. S2) were used for subsequent analysis.
qRT-PCR
Qiagen miRNeasy mini kit was used to extract total RNA. Half to one microgram of RNA was treated with DNase I (Invitrogen) and complementary DNA (cDNA) was produced with Invitrogen First Strand Superscript III cDNA synthesis kit. Q-PCR was performed using iQ SYBR Green Supermix (Bio-Rad). Each sample was loaded in duplicate or triplicate for analysis using the CFX ConnectTM Real-time PCR machine. The conditions for qRT-PCR were as follows: Initial denaturation at 95°C for 30 s followed by 45 cycles of 95°C for 5 s, and 60°C for 30 s coupled with capture florescence. 18s rRNA was used to normalize mRNA expression. For mature miRNA analysis, the Taqman MicroRNA Reverse Transcription Kit and Taqman Fast Advanced qPCR Mastermix (Thermo Fisher Scientific) were used, and values were normalized to U6. Primer sequences are noted in Supplementary Table S4. Primers for primary miR-17 were purchased from Thermo Fisher Scientific (Taqman Pri-miRNA-Assay, #4427012).
mRNA stability assay
Primary Pkd1^RC*17/RC^ cells were seeded into six-well plates to reach 50% confluence. The next morning, culture media was replaced with media containing 5 µg/ml media of actinomycin. Cells were harvested at 0, 2, 4, 6, and 8 h after actinomycin treatment for analysis. Similarly, normal collecting duct cells or Pkd1^RC/−^ cells were plated into six-well plates (1.5 × 10^5^ cells per well) and the next morning transfected with control or Pkd1 oligo using Lipofectamine 3000 (Invitrogen) to reach a final concentration of 40 nM. Forty-eight hours after transfection, culture media was replaced with media containing 5 µg/ml media of actinomycin. Cells were harvested at 0, 2, 4, 6, and 8 h after actinomycin treatment for analysis. We used qRT-PCR as noted above to measure the Pkd1, c-Myc, and Gapdh. All measurements were normalized to 18s rRNA.
Western blot
Total protein was extracted from kidneys by homogenization in a lysis buffer containing T-PER and protease phosphatase inhibitor (Thermo Fisher Scientific, #PIA32961). For cell culture studies, adherent cells were scraped with cell scrapers in 1× PBS, transferred into 1.5 ml microcentrifuge tubes, and centrifuged at 10 000 rpm for 5 min. Supernatant was aspirated and then pellet was resuspended in T-PER + PPI. Protein concentrations were measured with Bradford Assay reagent. For proteins <150 kDa in size, 10 µg was loaded for western blot. For full-length PC1 protein (462 kDa), 40–60 µg was used. For detection of PC1, protein lysate was prepared in 0.1 M dithiothreitol and incubated at 25°C for 15 min immediately before gel electrophoresis. Samples were loaded onto NuPAGE 3%–8% Tris-Acetate Protein Gel (Thermo Fisher Scientific) alongside a high molecular weight protein ladder (HiMark, Invitrogen) and run at 150V for 20 min at room temperature, followed by 40 min at 4°C. Protein transfer onto a nitrocellulose membrane was performed using the Invitrogen transfer system at 200 mAmps for 100 min at 4°C. The membrane was then blocked in 5% fat-free milk in tris-buffered saline with tween 20 (TBST) for 30 min and incubated in PC1 primary antibody (1:500 dilution) in TBST overnight. The next morning, the PC1 membrane was incubated on shaker for 1 additional hour at room temperature with PC1 primary antibody (1:250 dilution). Membranes were then washed thrice with TBST and incubated in secondary antibody (anti-mouse HRP-conjugated IgG at 1:500 for PC1) for 1 h at room temperature. After three additional washes in TBST, membrane was developed using SuperSignal West Femto or Atto (Thermo Fisher Scientific) using Bio-Rad digital imager. For actin for PC1 blots, 3 µl of the same protein lysate prepared in 0.1 M dithiothreitol was loaded onto mini-PROTEAN SDS-polyacrylamide precast gels (Bio-Rad), alongside a standard molecular weight ladder (Precision Plus Protein Kaleidoscope Standards, Bio-Rad). Protein transfer and all subsequent steps were identical as for all other western blots described below.
For all other western blots, protein was prepared in 4× NuPage LDS Sample buffer with 0.5% β-mercaptoethanol. For OXPHOS assessment, samples were kept at 50°C for 10 min before loading. For all other proteins, samples were boiled for 3 min at 98°C and cooled to room temperature, before loading onto mini-PROTEAN SDS-polyacrylamide precast gels (Bio-Rad), against a standard molecular weight ladder (Precision Plus Protein Kaleidoscope Standards, Bio-Rad). Gels were run at 200V at room temperature until the dye ran out. Protein transfer was performed using the Trans-Blot Turbo Transfer System (Bio-Rad) with the mixed MW or Mini TGX program. Nitrocellulose membranes were then blocked with 5% fat-free milk in TBST for an hour, and then probed with primary antibody (1:1000) for 1 h at room temperature followed by overnight at 4°C. After completing incubation with primary antibody, membranes were washed three times with TBST, and then probed for 1 h at room temperature with secondary antibody (1:5000). For β-actin, an HRP-conjugated actin antibody diluted at 1:40 000 (Sigma–Aldrich) was used, with incubation of 1 h. Blots were then washed three times and developed using the chemiluminescence substrate Pierce ECL, SuperSignal West Dura, or Femto (if needed) and imaged with the Bio-Rad digital imager. Quantification was performed using ImageJ.
Primary antibodies used: PC1 (7E12 Santa Cruz, #sc-130554), PC2 (PKD-RRC), AQP2 (Sigma–Aldrich, #A7310), Beta-Actin (Sigma–Aldrich, #A3854), Mannose Receptor (Abcam, #ab64693), Alpha Smooth Muscle (Sigma–Aldrich, #F377), Phospho-mTOR (Cell Signaling, #2971), pCREB (Cell Signaling, #9198), Total OXPHOS Rodent WB Antibody Cocktail (Abcam, #ab110413), and c-Myc (Abcam, #ab185656). Secondary Antibodies used: goat-anti-rabbit IgG HRP-conjugated and goat-anti-mouse IgG HRP-conjugated (Thermo Fisher Scientific).
Immunofluorescence
Paraffin-embedded kidney tissue slides were deparaffinized by incubating at 60°C for 1 h, followed three serial 5-min washes in Histo-clear (Thermo Fisher Scientific). Slides were rehydrated by washing in 100%, 95%, and 70% ethanol for 5 min each followed by direct immersion in 1× PBS. Antigen retrieval was performed using warm sodium citrate. After cooling, slides were blocked in blocking solution (1× PBS + 10% goat serum + 0.1% BSA) for 1 h at room temperature and then incubated in primary antibody at 1:500 dilution overnight. The next morning, slides were washed thrice with 1× PBS and then incubated in secondary antibody at 1:500 dilution for 1 h at room temperature in a light-protected slide box. Slides were again washed with 1× PBS three times and then mounted with Vecta Shield containing Dapi. Zeiss AxioObserver deconvolution microscope and Zeiss Axioscan Z1 microscope were used for imaging. Primary antibodies used: phospho-histone H3 (Sigma–Aldrich, #H0412). Secondary antibodies: Alexa Fluor 594 Dye (Fisher Scientific, #PIA32758).
Proteomics
Protein was prepared in 0.1 M dithiothreitol, incubated at 25°C for 15 min, then immediately loaded into mini-PROTEAN TGX 4%–10% SDS-polyacrylamide gels (Bio-Rad). Gels were run at 180V for 5–10 min to allow protein to enter the top 1 cm of the gel. The gel was then removed from its cassette and placed in Coomassie Blue R-250 (Bio-Rad) on a shaker for 90 min. The stained gel was washed in ddH_2_O and the top 1 mm of each well was discarded to reduce variability due to captured detergents. The next 1 cm of each well was excised and diced into 1-mm cubes for protein extraction prior to liquid chromatography-mass spectrometry (LC–MS). Gel protein extraction, trypsin digestion, and complex mixture LC–MS using a 90-min HPLC gradient were performed by the Proteomics Core at UTSW to identify proteins. Abundance of proteins was normalized to beta-actin for each sample. Three samples were analyzed for each genotype. One-way Anova was used to identify differentially abundant proteins. Differential pathway analysis was performed using Ingenuity Pathway Analysis software.
Magnetic resonance imaging
Eighty-four-day-old mice were imaged with MRI at the UTSW Pre-Clinical MRI Research Core on the 7-T Bruker Biospec scanner. Kidney volumes were quantified manually by multiplying areas of kidneys for each slice by the slice thickness, using PiPro provided by the UTSW Pre-Clinical MRI Research Core.
Serum creatinine
Serum creatinine was measured using capillary electrophoresis by the UTSW Division of Nephrology.
Oligonucleotide design
Binding regions for oligonucleotide candidates were found using the findMotif utility by Kent Informatics, distributed by UCSC. This search was conducted against the T2T-CHM13 v2.0 genome for human, and GRCm39 genome for mouse. Gene annotations were added by intersecting the binding motifs with NCBI Refseq annotations using bedtools. Monomer and homodimer free energies were calculated using the RNAcofold tool from the ViennaRNA package. Optimal locked nucleic acid (LNA) placement and oligonucleotide synthesis was performed by Qiagen.
Luciferase assay
mIMCD3 or Pkd1^RC/−^ cells were seeded into six-well dishes (2 × 10^5^ cells per well) and transfected with 0.4 μg of pLS-Pkd1-3′-UTR plasmid, 10 nM of miR-17 or scramble mimic (Dharmacon), and 40 nM of Control or Pkd1 oligo (Qiagen). Cells were also transfected with 0.04 μg of the pGL3-Control plasmid (Promega Corp) encoding Photinus luciferase to serve as control for differences in transfection efficiency. Lipofectamine 2000 (Invitrogen) was used as a transfection reagent. After 48 h, the cells were lysed in 250 μl of passive lysis buffer (Promega Corp), and 40 μl of the cell lysate was added to 96-well plates. Photinus and Renilla luciferase activities were measured by using the Dual-Luciferase Reporter Assay System (Promega Corp) according to the manufacturer’s directions.
Cell lines
Pkd1 ^RC/−^ cells, kidney epithelial cells, and mIMCD3 cells were used in these experiments. mIMCD3 cells were obtained from ATCC. Collecting duct derived kidney epithelial cells and Pkd1^RC/−^ cells are immortalized tubule derived kidney epithelial cells derived in our laboratory from 12-day-old male mouse kidneys [5, 17].
RGLS4326 studies
One hundred thousand Pkd1^RC/−^ cells were seeded into six-well plates. The next morning, each well was transfected using Lipofectamine 3000 with one of the following reagents to reach the denoted final concentration: 1× PBS, 100 nM RGLS4326 (MedChemExpress, HY-139290), 40 nM Ctl Oligo, or 40 nM P1 oligo. After 48 h, cells were collected for protein lysate extraction and subsequent immunoblot analysis.
Human ADPKD cell lines
WT9-7 cells (PKD1.Q2556X) were obtained from ATCC. Immortalized human ADPKD cell lines were derived from primary human cyst cells from human kidneys affected by ADPKD obtained from the PKD Research Biomarker and Biomaterial Core at University of Kansas Medical Center. The use of tissues was approved by the KUMC Institutional Review Board and complied with federal regulations. Mutation analysis has been previously performed by Ambry Genetics (Aliso Viejo, CA) [5]. Culture media consisted of DMEM/F12++ (Gibco, #10565-018) supplemented with 10% fetal bovine serum (FBS), 5 μg/kg insulin, 5 μg/ml transferrin, and 5 ng/ml sodium selenite. Each primary cell line was grown in an atmosphere of 95% air and 5% CO_2_ at 37°C until 80% confluency. At the second, passage primary cell lines underwent immortalization as described above. Single clones that expressed SV40 were selected for expansion and downstream utilization. Immortalized human ADPKD cell lines were grown to 80% confluency, then cells were trypsinized and seeded at 2 × 10^5^ cells per well in a six-well plate. The next day, cells were transfected with Lipofectamine 3000+ control oligo, P1 oligo, or P2 oligo. After 48 h, cells were harvested or fixed with 100% methanol for analysis or placed in Matrigel for cystogenesis assay.
3D cystogenesis assay
Ninety-six-well plates or eight-well chamber slides and 200 µl sterile pipette tips were pre-cooled at −20°C for a minimum of 6 h. The floor of each well of an eight-well chamber slide or selected wells of a 96-well plate was carefully coated with 25 µl of 100% Matrigel (Fisher Scientific, #354234) using 200 µl sterile pipette tips. The plate was then placed in a 37°C incubator for 30 min to set the Matrigel. During this time, cells were washed with 1× PBS, trypsinized and filtered through a 40-µm cell strainer to create a single-cell suspension. Cells were counted with hemocytometer and diluted to reach a final concentration of 5000 cells per 150 µl. One hundred fifty microliters of cell suspension was combined 1:1 with 4% Matrigel and placed in each well. Each treatment condition was seeded in triplicate and incubated at 37°C for 7 days. After 72 h, each well was supplemented with 100 µl of epithelial media. On day 7, the cysts were imaged using a Leica DMI 3000B light microscope. The images were analyzed using ImageJ software to measure cyst size. In immortalized cells, each assay was repeated three times.
Immunofluorescence staining of cells
Adherent cells were fixed onto chamber slides with ice-cold 100% methanol for 5 min at 4°C and then washed thrice with 1× PBS. The cells were then blocked for 30 min to 1 h in 1× PBS + 10% goat serum + 0.1% BSA + 0.1 M glycine + 0.1% Tween 20 (blocking solution) at room temperature. pCREB antibody (Cell Signaling, #9198) at 1:400 dilution in blocking solution was added, and slides were incubated overnight at 4°C. The next morning, primary antibody was removed and slides were washed thrice in 1× PBS. Then secondary antibody was applied at 1:400 dilution for 1 h at room temperature and then again washed thrice in 1× PBS. Cells were counterstained with DAPI diluted 1:10 000 in 1× PBS and visualized using Carl Zeiss AxioObserver microscope. All conditions for each experiment were processed and imaged simultaneously.
MitoTracker staining
Cells were washed with 1× PBS and then incubated in 100 nM MitoTracker Red CMXRos dissolved in serum free DMEM (Thermo Fisher Scientific). After 8 min, the media was aspirated and replaced with regular epithelial media and cells were immediately imaged using Carl Zeiss AxioObserver microscope. All images for each experiment were taken with identical exposure to allow comparison of intensity of MitoTracker fluorescence, a proportional surrogate of mitochondrial membrane potential.
RNA sensor assay
CSM vector pDAC565 (Addgene, #195242) was obtained from Addgene with institutional MTA. We followed the creators’ instructions to design and insert a crRNA specific to Pkd1 (Supplementary Table S4) into the CSM vector [18]. To image Pkd1 mRNA in live cells, 2 × 10^4^ cells were seeded into 24-well plates. The next morning, cells were transfected with 0.4 µg of CSM plasmid and control oligo or Pkd1 oligo at total concentration of 40 nM using Lipofectamine 3000. At 48 h, cells were evaluated using the Zeiss AxioObserver microscope at 20× magnification. Two hundred cells per condition that exhibited green background signal (indicating plasmid transfection) were evaluated for the presence of green fluorescent protein (GFP) fluorescent puncta, which marked Pkd1 mRNA. The percentages of cells positive for Pkd1 mRNA puncta were recorded. Each experiment was repeated at least three times.
Statistical analysis
Equal males and females were used for all studies. Two-tailed Student’s *t-*test was used to compare two groups. Analysis of variance (ANOVA) followed by Tukey’s multiple comparison test was used to compare three or more groups. Survival analysis was determined by Mantel Cox test. All statistical analysis was performed using GraphPad Prism software, Python scipy modulator or Microsoft Excel. *P *< .05 was considered statistically significant.
Results
Substitution of six nucleotides in the miR-17 seed motif stabilizes Pkd1 mRNA
To define the minimal region required for miR-17–Pkd1 interaction, we targeted six evolutionarily conserved nucleotides within the Pkd1 mRNA complementary to the miR-17 seed sequence (nucleotides 2–7). Using Cas9/sgRNA-mediated homology-directed repair, we generated a base-substituted allele (*17) with purine-to-purine (A↔G) and pyrimidine-to-pyrimidine (C↔T) substitutions designed to disrupt Watson–Crick base pairing with miR-17 while preserving nucleotide class. This precise modification maintains the overall UTR architecture, allowing us to isolate the effect of this single miRNA interaction site. We introduced this modification into the hypomorphic Pkd1^RC3277^ allele, enabling the simultaneous assessment of the *cis-*regulatory impact on Pkd1 expression and ADPKD progression [14].
We injected Pkd1^RC/RC^ zygotes with Cas9 protein, a Pkd1 3′UTR-targeting sgRNA, and a single-stranded DNA donor template containing the intended motif sequence changes (5′-CACTTT-3′ → 5′-TGTCCC-3′) within the 8-base-pair miR-17 binding site (Fig. 1A). The embryos were implanted in pseudo-pregnant females, and founder mice were genotyped via allele-specific PCR and confirmed via Sanger sequencing (Fig. 1B and C). We selected mice carrying one allele with the native miR-17 motif (Pkd1^RC^) and the other with the base-edited motif (Pkd1^RC*17^), enabling direct allele-to-allele comparisons in the same cells and under a constant genetic background.
Substitution of six nucleotides within the miR-17 motif stabilizes Pkd1 mRNA. (A) Schematic illustrates the CRISPR/Cas9 editing + HDR template DNA approach utilized to precisely switch six nucleotides within the miR-17 motif in the Pkd1RC 3′UTR. (B) Sanger sequencing of tail DNA from Pkd1RC/RC17 mouse demonstrates successful 3′UTR editing. The edited allele with disrupted miR-17 motif is denoted in pink, and the unedited allele with intact miR-17 motif is shown in blue. (C) Allele-specific DNA genotyping primers selectively detected edited [primer positions indicated as pink and black arrows in panel (B)] and unedited [primer positions indicated blue and black arrows in panel (B)] Pkd1RC alleles. (D) Allele-specific qRT-PCR primers were used to compare Pkd1RC and Pkd1RC17 transcript abundance within primary kidney epithelial cells derived from Pkd1RC/RC17 mice. qRT-PCR demonstrated higher abundance of Pkd1RC17 mRNA compared to Pkd1RC mRNA. (E) Primary Pkd1RC/RC17 cells were treated with actinomycin and harvested at 2-h intervals to measure abundance of Pkd1 mRNA transcripts. qRT-PCR analysis demonstrated slower degradation of Pkd1RC17 mRNA compared to Pkd1RC mRNA. c-Myc and Gapdh mRNA degradation was measured as internal controls. (F) Pkd1F/F or Pkd1−/− cells (Top panel) and Pkd1RC/− or Pkd1RC17/− cells (lower panel) were transfected with the CRISPR-based Pkd1 exon-4 mRNA GFP sensor (green). Live-cell images and the quantification of percentage of cells exhibiting the GFP-positive puncta marking Pkd1 mRNA is shown in the lower left corner. The essential lack of detection of GFP puncta in Pkd1−/− cells indicates specificity of Pkd1 mRNA sensor. A 78% increase in Pkd1 mRNA detection in Pkd1RC17/− cells compared to Pkd1RC/− cells implies increased Pkd1 mRNA transcript in cells lacking the miR-17 motif. (G) Western blot demonstrates PC1 expression is increased in Pkd1RC17/− cells compared to Pkd1RC/− cells, whereas PC2 and AQP2 expression remain unchanged. Error bars indicated SEM. Statistics: paired t-test (D); nonlinear regression (E); unpaired two-tailed t-test (F).*
To test whether the substitution altered endogenous Pkd1 mRNA stability, we isolated primary kidney epithelial cells from 10-day-old Pkd1^RC/RC^, Pkd1^RC/RC17^, and Pkd1^RC17/RC17^ mice. We designed allele-specific qRT-PCR primers that selectively amplify either the native Pkd1^RC^ mRNA or the Pkd1^RC17^ mRNA. The Pkd1^RC17^-specific primer amplified transcripts from Pkd1^RC17/RC17^ kidney cells but not from Pkd1^RC/RC^ kidney cells. Conversely, the Pkd1^RC^-specific primer amplified transcripts only from Pkd1^RC/RC^ cells but not from Pkd1^RC17/RC17^ kidney cells (Supplementary Fig. S1). Using these primers, we next quantified allele-specific Pkd1 transcript abundance in the Pkd1^RC/RC17^ mouse kidney epithelial cells. The Pkd1^RC17^ mRNA levels were about three-fold higher than Pkd1^RC^ mRNA levels (Fig. 1D), implying larger contribution to the Pkd1 mRNA pool from the edited allele compared to the unedited allele. To determine whether the substitution affected transcript stability, we treated Pkd1^RC/RC17^ cells with actinomycin D to halt transcription and harvested RNA every 2 h for 8 h. Within the same cells, Pkd1^RC17^ mRNA degraded at a slower rate than the native Pkd1^RC^ transcript. After 8 h, Pkd1^RC17^ mRNA remained more abundant (Fig. 1E). We next determined whether the increased mRNA levels due to base substitutions corresponded to higher PC1 in a monoallelic setting. We generated primary and immortalized kidney epithelial cell lines from 14-day-old Ksp^Cre^; Pkd1^RC/F^ (Pkd1^RC/−^) and Ksp^Cre^; Pkd1^RC17/F^ (Pkd1^RC17/−^) littermate mice. In this model, the floxed Pkd1 allele is deleted in renal tubules, primarily collecting ducts, generating an ADPKD model with the remaining RC allele that either contains an intact miR-17 motif or the base-edited version. The baseline characterization of these cell lines is shown in Fig. 1G and Supplementary Fig. S2A and B. First, we used a CRISPR-based live-cell RNA sensing system to detect the Pkd1^RC^ transcript. This system employs a catalytically inactive CRISPR-Cas complex (Csm-GFP) with an sgRNA that we designed to specifically recognize and bind exons 2–4 of Pkd1 mRNA, resulting in GFP fluorescence at the site [18] (Supplementary Fig. S2C). In wildtype cells, we observed punctate GFP signals representing Pkd1 mRNA, whereas Pkd1^−/−^ cells showed no such signals, confirming specificity (Fig. 1F). When we employed this RNA sensor system in Pkd1^RC/−^ and Pkd1^RC17/−^ cells, we noted a 78% increase in Pkd1 mRNA signal in Pkd1^RC17/−^ cells. Importantly, immunoblot analysis revealed higher PC1 expression in Pkd1^RC*17/−^ compared to Pkd1^RC/−^ cells (Fig. 1G). Thus, these findings demonstrate that the six-nucleotide substitution within the miR-17 binding site stabilizes the Pkd1 transcript in cis and leads to higher PC1 protein levels in cultured cells.
miR-17 motif disruption raises PC1 and ameliorates cyst growth in mice
We next asked whether the Pkd1^RC17^ allele would raise PC1 in mouse models and consequently reduce cyst burden. To answer this question, we analyzed the impact of miR-17 motif disruption using three independent Ksp^Cre^; Pkd1^RC/RC17^ founder mice. In each case, we bred the heterozygous Ksp^Cre^; Pkd1^RC/RC17^ founder mice to Pkd1^F/F^ mice. This cross produced littermate Ksp^Cre^; Pkd1^RC/F^ (Pkd1^RC/−^) and Ksp^Cre^; Pkd1^RC17/F^ (Pkd1^RC17/−^) mice, enabling direct comparison under a similar genetic background. Consistent with our previous studies, the Pkd1^RC/−^ progeny from each of the three founder mice developed severe PKD by post-natal day (P)18. In contrast, we noted a marked improvement in cyst burden in their littermate P18 Pkd1^RC17/−^ mice (Fig. 2A, E, and I). We observed near normalization of kidney-weight-to-body-weight ratio (KW/BW), cyst index, and serum creatinine levels in P18 Pkd1^RC17/−^ compared to Pkd1^RC/−^ mice (Fig. 2B, C, F, G, J, and K, and Supplementary Fig. S3). Crucially, immunoblot analysis confirmed that P18 Pkd1^RC17/−^ kidneys consistently showed increased PC1 protein abundance compared to Pkd1^RC/−^ kidneys across all three founder lines (Fig. 2D, H, and L).
Substitution of six nucleotides within the miR-17 motif ameliorates PKD. Three independent Pkd1RC17/RC founder mouse lines were crossed with KspCre; Pkd1F/F mice to produce littermate KspCre; Pkd1RC17/F (Pkd1RC17/−, red circles) and KspCre; Pkd1RC/F (Pkd1RC/−, black circles) mice. Representative gross kidney images and H&E-stained kidney sections (A), kidney-weight-to-body-weight ratios (KW/BW) (B), serum creatinine levels (C), and PC1 immunoblot with quantification (D) are shown for 18-day-old Pkd1RC17/− and Pkd1RC/− progeny derived from founder 1. Equivalent analyses for progeny from founder 2 (E–H) and founder 3 (I–L) also revealed reduced cystic burden and increased PC1 expression in Pkd1RC17/− mice compared to Pkd1RC/− mice. Error bars indicate SEM. Statistical analysis: Unpaired two-tailed t-test. N indicates biological replicates.*
To assess durability of the cyst suppression phenotype, we longitudinally followed cohorts of Pkd1^RC17/−^ and Pkd1^RC/−^ littermate mice for 3 months. We measured serum creatinine at P45, P60, and P90, performed MRI to measure total kidney volume at P84, and performed histological and molecular analyses at P90. Compared with Pkd1^RC/−^ littermates, which showed progressive cyst growth, kidney tissue destruction, and declining renal function, Pkd1^RC17/−^ mice exhibited an attenuated disease course, with preserved renal parenchyma, serum creatinine remaining at near-normal levels, reduced total kidney volume by MRI, and lower KW/BW and cyst index at endpoint (Fig. 3A–D and Supplementary Fig. S4). Furthermore, we noted that Pkd1^RC*17/−^ kidneys have reduced inflammation evidenced by downregulation of MRC1 expression by western blot analysis (Fig. 3E) and blunted expression of inflammatory marker transcripts (Mrc1, Ccl2, Arg1, and Ym1) by qRT-PCR (Fig. 3F). Similarly, we observed a reduction in fibrosis markers, including SMA by western blot analysis (Fig. 3G), as well as decreased Acta2, Col1a1, Tgfb2, and Vimentin transcripts by qRT-PCR (Fig. 3H). Together, these studies confirm the protective effect of a six-nucleotide substitution in the Pkd1 3′UTR in delaying cyst progression, and mitigating cyst-associated inflammation and fibrosis.
Pkd1 RC17 substitution results in durable suppression of disease progression. A cohort of Pkd1RC/− and Pkd1RC17/− littermate mice derived from founder 1 were aged past postnatal day (P) 18 to examine the durability of disease suppression. MRI at P84 and H&E at P90 (A), total kidney volume (B), and KW/BW (C) demonstrate that cyst growth is significantly retarded even in aged 3-month-old Pkd1RC17/− (red circles) compared to Pkd1RC/− mice (black circles). (D) Serum creatinine levels at P45, P60, and P90 in Pkd1RC17/−, and Pkd1RC/− mice are shown. Pkd1RC/− mice exhibited a steady increase in serum creatinine with age implying worsening renal function. In contrast, serum creatinine levels remained at or near normal levels (dashed blue line indicates average serum creatinine of wild-type mice; N = 4 at each time point) in Pkd1RC17/−. Immunoblot (E, G) and qRT-PCR analysis (F, H) showing expression of inflammatory markers (E, F) MRC1/Mrc1, Arg1, Ccl2, and Ym1 and fibrosis markers (G, H) SMA/Acta2, Col1a1, Tgfb2, and Vimentin in kidneys of Pkd1+/+, Pkd1RC/−, and Pkd1RC17/− are shown (N = 4 for each group). Error bars indicate SEM. Statistical analysis: Unpaired, two-tailed t-test (B–D); ANOVA with Tukey’s (F–H).
PC1 restoration disrupts the c-Myc–miR-17–mitochondrial axis in ADPKD
Our miR-17 motif-edited Pkd1 allele provides a powerful system to address a central unresolved question: what are the downstream molecular consequences of restoring endogenous PC1? Mitochondrial dysfunction and hyperproliferation, orchestrated in part by the c-Myc–miR-17 axis, are major drivers of ADPKD, yet it remains unclear the extent to which PC1 restoration can directly reprogram these pathogenic processes [19–21]. Because this allele uncouples PC1 from miR-17 regulation, it offers a unique opportunity to isolate the effects of PC1 restoration on mitochondrial function and c-Myc signaling.
To obtain converging lines of evidence, we simultaneously assessed global proteomic changes, cellular proliferation, and mitochondrial function in kidneys from P18 Pkd1^RC17/−^ mice and Pkd1^RC/−^ mice. Shotgun label-free quantitative proteomics revealed widespread changes in protein abundance, with 733 proteins upregulated and 1624 proteins downregulated in Pkd1^RC/−^ relative to age-matched non-cystic Pkd1^+/+^ control kidneys (Supplementary Fig. S5 and Supplementary Table S1). Nearly 50% of dysregulated proteins in Pkd1^RC/−^ kidneys showed improved (or normalized) expression in Pkd1^RC17/−^ kidneys, implying that along with producing a marked improvement in disease burden, PC1 restoration also positively affects the downstream proteo-molecular footprint (Fig. 4A). Pathway enrichment analysis highlighted mitochondrial metabolism, cell proliferation, and RNA translation and processing as the major processes that were positively affected by miR-17 motif disruption (Fig. 4B). Consistent with these findings, immunoblotting using a panel of antibodies demonstrated marked improvement in the expression of mitochondrial electron transport chain complexes in Pkd1^RC17/−^ kidneys compared to Pkd1^RC/−^ kidneys (Fig. 4C). qRT-PCR analysis further revealed improved expression of Ppargc1a, a key regulator of mitochondrial biogenesis, in Pkd1^RC17/−^ compared to Pkd1^RC/−^ kidneys, supporting enhanced mitochondrial function (Supplementary Fig. S6A). In parallel, we noted reduced expression of p-mTOR and pCREB1 (Fig. 4C), implying that global proteomic changes were associated with attenuation of cyst-pathogenic signaling. Supporting this conclusion, whole-section immunofluorescence quantification of phospho-histone H3-positive cells revealed a 19% reduction in cellular proliferation in Pkd1^RC*17/−^ kidneys compared to Pkd1^RC/−^ kidneys (Fig. 4D and E). Collectively, these complementary analyses indicate that PC1 restoration simultaneously enhances mitochondrial function and restrains hyperproliferative, cystogenic programs.
Pkd1 RC17/− allele disrupts the c-Myc–miR-17–mitochondrial axis in cystic kidneys. Shotgun label-free quantitative proteomics was performed to assess global proteomic profiles of kidneys from 18-day-old Pkd1+/+, Pkd1RC/−, and Pkd1RC17/− mice (n = 3, each group). (A) Comparative differential expression analysis depicts a global trend where a substantial portion of dysregulated protein expression (adjusted P < .05) in Pkd1RC/− kidneys compared to Pkd1+/+ kidneys was improved in Pkd1RC17/− kidneys. (B) Top pathways (based on z-score ≥6 in at least one comparison group) that underlie the proteomic changes observed in Pkd1RC/− compared to Pkd1+/+ kidneys, and Pkd1RC17/− compared to Pkd1RC/− kidneys. The ingenuity pathway analysis software was used for the predictions. Expression of metabolic, proliferative, and RNA processing pathways were improved in Pkd1RC17/− compared to Pkd1RC/− kidneys. (C) Immunoblot analysis showing reduced pMTOR and pCREB expression, and increased expression of oxidative phosphorylation complex (OXPHOS) components in Pkd1RC17/− compared to Pkd1RC/− kidneys (n = 3). (D, E) Phospho-histone H3 (pHH3, pink) immunofluorescence staining (D) and subsequent quantification (E) demonstrated reduced proliferation in Pkd1RC17/− compared to Pkd1RC/− kidneys (n = 4 each). The slides were counterstained with DAPI (blue). (F–I) qRT-PCR analysis showing expression of primary miR-17 transcript (F), mature miR-17 and miR-20a (G), mature miR-21 (H), and cMyc (I) in kidneys of 18-day-old Pkd1+/+, Pkd1RC/−, and Pkd1RC17/− mice (n = 3). The c-Myc/miR-17 axis remained elevated in Pkd1RC17/− kidneys, whereas expression of miR-21, a cyst-pathogenic miRNA, was improved. (J) Immunoblot analysis showing equivalent expression of cMyc protein in kidneys of 18-day-old Pkd1RC/− and Pkd1RC17/− mice (n = 3). Actin serves as the loading control; Error bars indicate SEM. Statistics: ANOVA with Tukey’s (A, F–I), and Unpaired, two-tailed t-test (E, J).
Finally, we asked whether PC1 restoration influenced the c-Myc–miR-17 axis itself. c-Myc is broadly activated in ADPKD and was one of the first oncogenes implicated in the disease, driving both cellular proliferation and the expression of miR-17 family miRNAs [11, 19]. As expected, pri-miR-17 was transactivated at 33% higher levels in Pkd1^RC/−^ kidneys compared with non-cystic controls (Fig. 4F). Remarkably, pri-miR-17 levels remained unchanged in Pkd1^RC17/−^ kidneys, and mature miR-17 and miR-20a remained similarly elevated (Fig. 4F and G). Correspondingly, c-Myc mRNA and protein levels were unchanged in Pkd1^RC17/−^ kidneys compared with Pkd1^RC/−^ kidneys (Fig. 4I and J). In contrast, the expression of miR-21, another cystogenic miRNA upregulated Pkd1^RC/−^ kidneys, was reduced in Pkd1^RC*17/−^ kidneys (Fig. 4H), suggesting that PC1 restoration selectively modulates certain cystogenic miRNAs while leaving the c-Myc–miR-17 axis largely intact [22]. These findings indicate that the beneficial effects of PC1 restoration on cyst growth, mitochondrial function, and cellular proliferation occur independently of c-Myc and miR-17, highlighting a direct role of PC1 in rewiring downstream pathogenic programs.
Design and validation of PKD1-targeting oligonucleotides
Having established that precise base editing of the miR-17 seed in Pkd1 stabilizes its mRNA and elevates PC1, we next asked whether a transient, pharmacologic approach could recapitulate these effects. To test this, we employed a multifaceted strategy to determine the optimal target site blocker sequence capable of masking the miR-17 binding motif (Supplementary Fig. S7 and Supplementary Tables S2 and S3). Our design process integrated four key criteria: (i) maximization of hybridization, by analyzing the predicted secondary RNA structure of the Pkd1/PKD1 3′UTR to target the motif within an accessible open loop; (ii) minimization of off-targets, achieved by a genome-wide analysis that identified 15–16-bp length as optimal for specificity in both mouse and human; (iii) inter-species conservation, to ensure the oligo sequence was effective in both mice and humans; and (iv) sequence stability, by screening candidates to select for those with the least potential for self-dimerization and hairpin formation. This multi-parameter optimization led us to two lead candidates: 16 bp mouse Pkd1-oligo (P1) and 15-bp human PKD1-oligo (P2). The P2 oligo is fully complementary to the human PKD1 3′-UTR with one base mis-match to the corresponding mouse Pkd1 3′UTR. The complement of the miR-17 motif resides proximal to 5′ end of the P1 and P2 oligos. The sequences are shown in Supplementary Fig. S7. Importantly, these DNA oligos possess a full phosophorothioate backbone with strategically placed locked nucleic acids designed to promote steric hindrance of miRNA binding rather than mRNA cleavage via RNase H.
First, we confirmed target engagement by exploiting the property that RNA-oligo duplexes physically obstruct reverse transcriptase during cDNA synthesis [23]. We transfected mouse collecting duct cells with 40 nM of either P1-oligo or a scrambled control oligonucleotide (Ctl-oligo) and measured Pkd1 mRNA levels via qRT-PCR 48 h post-transfection. The P1-oligo prevented amplification of the 3′UTR region it targets, while adjacent or unrelated regions remained detectable, indicating specific binding to the intended motif (Supplementary Fig. S8). This hindrance was not observed in cells treated with Ctl-oligo. To demonstrate functional engagement, we co-transfected a luciferase reporter fused to the Pkd1 3′UTR with either a control or miR-17 mimic in mouse collecting duct cells. As expected, miR-17 suppressed luciferase activity. Co-transfection with P1-oligo mitigated this suppression, restoring reporter expression, whereas Ctl-oligo had no effect (Supplementary Fig. S9A). Similar results were obtained in Pkd1^RC/−^ cells, confirming that the oligo’s activity is consistent across different cellular contexts (Supplementary Fig. 9B). Collectively, these experiments demonstrate that P1-oligo can specifically inhibit miR-17–Pkd1 interactions at the 3′UTR.
Next, we employed multiple complementary methods to assess whether P1 oligo binding stabilizes the endogenous Pkd1 mRNA. First, we treated normal kidney collecting duct cells with 40 nM of either Ctl-oligo or P1 oligo for 48 h, followed by treatment with actinomycin D to inhibit new RNA synthesis. The actinomycin D chase assay revealed that cells treated with P1 oligo retained ~30% more Pkd1 mRNA after 6 h compared to Ctl-oligo-treated cells, indicating enhanced transcript stabilization (Supplementary Fig. S10A and B). As an orthogonal validation, we used our Pkd1 RNA sensing system [18]. We measured Pkd1 mRNA abundance in live cells treated with 40 nM of P1 oligo or Ctl-oligo. After 48 h, P1-treated cells exhibited a significant increase (~75%) in Pkd1 mRNA compared to Ctl-oligo-treated cells (Supplementary Fig. S10C). Finally, immunoblot analysis revealed that the stabilized Pkd1 mRNA translates into ~40% increased PC1 protein with P1 oligo compared Ctl-oligo treatment (Supplementary Fig. S10D). Together, these findings demonstrate that steric hindrance of the miR-17 motif via oligonucleotide binding stabilizes endogenous Pkd1 mRNA, leading to enhanced translation and increased PC1 protein expression.
Pkd1 oligo restores PC1 expression and reverses cyst-pathogenic events in ADPKD models
While studies in normal cells established that the P1 oligo can stabilize wild-type Pkd1 transcripts, the critical question was whether the same strategy could rescue PC1 expression and cyst-pathogenic events in monoallelic, disease-relevant, mouse and human ADPKD cells. To address this, we first turned to Pkd1^RC/−^ cells. Just as in wild-type cells, the P1 oligo bound the 3′UTR, blocked reverse transcription across the miR-17 motif, and stabilized the Pkd1^RC^ mRNA transcripts following actinomycin D treatment (Fig. 5A–C). Moreover, transcript quantification in live cells using the Csm-GFP system revealed that Pkd1 mRNA was reduced by ~50% in Pkd1^RC/−^ compared to Pkd1^RC/+^ cells. Treating Pkd1^RC/−^ cells with P1 oligo reversed this reduction whereas control oligo had no effect (Fig. 5D). Importantly, immunoblot analysis also revealed restored PC1 protein levels in Pkd1^RC/−^ cells following P1 oligo treatment compared Ctl-Oligo treatment (Fig. 5E). In a head-to-head comparison, the P1 oligo appeared to raise PC1 levels similar to the upregulation seen with anti-miR-17 compound RGLS4326 (Supplementary Fig. S11). We next asked whether these molecular effects could mitigate pathogenic features of PKD. Indeed, P1-oligo reduced proliferation of Pkd1^RC/−^ cells in 2D culture and decreased cyst size in 3D Matrigel assays (Fig. 5F). At the signaling level, P1 oligo treatment suppressed the cyst-promoting effector pCREB, and at the metabolic level, it restored mitochondrial membrane potential (Fig. 5G). Thus, stabilization of the Pkd1^RC^ allele not only restored PC1 expression but also reversed multiple cellular hallmarks of PKD.
Pkd1-oligonucleotide increases PC1 expression and improves cyst parameters in mouse cellular PKD model. Pkd1RC/− cells were treated with 40 nM control oligonucleotide (Ctl oligo) or Pkd1-oligonucleotide (P1) and analyzed 48 h later. (A) qRT-PCR analysis was performed using a primer pair that amplifies the Pkd1 3′UTR. P1 prevented amplification of the Pkd1 3′UTR region it targets, while control oligo had no effect, indicating specific binding of P1 to the intended motif. (B, C) Pkd1RC/− cells were treated with 40 nM Ctl or P1 for 48 h and then co-treated with actinomycin for 4 h to halt de novo transcription. qRT-PCR analysis using a primer pair that amplifies Pkd1 exon-4 showed that 68% more Pkd1 mRNA remained in P1-treated compared to Ctl-oligo-treated Pkd1RC/− cells whereas cMyc transcript degraded equivalently. (D) (Top panel) Pkd1RC/+ or Pkd1RC/− cells were transfected with the CRISPR-based Pkd1 exon-4 mRNA GFP sensor (green). (Lower panel) Pkd1RC/− cells treated with 40 nM Ctl or P1 oligo and co-transfected with the CRISPR-based sensor. Live cell imaging and quantification of percentage of cells exhibiting the GFP signal is shown. Pkd1 mRNA detection was reduced by 44% in Pkd1RC/− cells compared to Pkd1RC/+ cells. Treatment with P1 oligo improved Pkd1 mRNA detection by 50% compared to Ctl-oligo treatment. (E) Immunoblot showing increased PC1 expression in Pkd1RC/− cells 48 h after P1 treatment compared to Ctl treatment. Actin serves as the loading control. (F) Pkd1RC/− cells were transfected with 40 nM Ctl or P1 for 48 h and were then cultured in 3D Matrigel for 5 days to facilitate cyst formation. Quantification showing that cyst size was reduced in P1-oligo compared to Ctl-oligo-treated Pkd1RC/− cells. (G) Immunofluorescence images showing live-cell MitoTracker labeling (MT, red) or pCreb (green) expression in P1-treated compared to Ctl oligo-treated Pkd1RC/− cells. P1 treatment increased Mitotracker signal and reduced pCreb expression, implying improved mitochondrial function and reduced cAMP signaling. N = 3 biological replicates for each condition. Error bars indicate SEM. Statistical analysis: Unpaired, two-tailed, t-test [(A–D) and (F)]. N = 4 biological replicates(A). N = 3 biological replicates (B–D).
Finally, we extended these studies to human disease models, and interchangeably tested both P1 and P2 oligos. We examined independent ADPKD cell lines derived from cystic kidney epithelia isolated from nephrectomy specimens of three individuals with ADPKD, and each carrying a distinct pathogenic monoallelic PKD1 mutation [5]. Immunoblot analysis revealed that both P1 and P2 increased PC1 protein expression across all three patient-derived ADPKD cell lines (PKD1 Q2556X, PKD1 Q2641*, and PKD1 pR3926Afs*34) as well as in the Pkd1^RC/–^ mouse line (Fig. 6A). qRT-PCR using primers that amplify the 3′UTR miR-17 motif demonstrated that P2 selectively interfered with amplification of the human 3′UTR region, while P1 selectively inhibited the mouse 3′UTR (Fig. 6B). Each oligonucleotide showed partial cross-reactivity in the non-cognate species, whereas the control oligo had no effect (Fig. 6B). Moreover, in a 3D Matrigel cystogenesis assay, treatment with both P1 and P2 oligos reduced cyst size in two human ADPKD cell lines (Fig. 6C). These consistent results across mouse and human systems establish that the P1 and P2 oligos can derepress non-inactivated PKD1 alleles, restore PC1 expression, and revert disease-associated phenotypes in cellular models. Collectively, they provide a strong rationale for advancing this approach as a therapeutic strategy in ADPKD.
PKD1-oligonucleotides raise PC1 protein levels in patient-derived ADPKD cyst cells. Three independent patient-derived ADPKD cyst cell lines (PKD1 Q2556X, PKD1 Q2641, and PKD1 pR3926Afs34) were treated with 40 nM control oligonucleotide (Ctl), the mouse-specific Pkd1-targeting oligo (P1), or the human-specific PKD1-targeting oligo (P2). The P1 and P2 oligos were also tested in the mouse Pkd1RC/− cell line. (A) Immunoblot analysis revealed that both P1 and P2 increased PC1 protein expression across all three patient-derived ADPKD cell lines, as well as in the Pkd1RC/– mouse line. (B) qRT-PCR using primers that amplify the PKD1 3′UTR miR-17 motif demonstrated that P2 selectively interfered with amplification of the human 3′UTR region, while P1 selectively inhibited the mouse 3′UTR. Each oligonucleotide showed partial cross-reactivity in the non-cognate species, whereas the control oligo had no effect. (C) Human ADPKD cell lines were treated with 40 nM ctl, P1, or P2 oligos for 48 h and then cultured in 3D Matrigel. Quantification revealed that treatment with either P1 or P2 oligo reduced 3D cyst size compared to Ctl oligo. Error bars indicate SEM. Statistical analysis: ANOVA with Tukey’s (B and C). N = 3 biological replicates for each cell line (B). N = 101–150 cysts were measured for each condition (C).
Discussion
In this study, we define both a mechanistic and therapeutic framework for selectively derepressing PKD1 by targeting a discrete miRNA-binding motif in its 3′UTR. Through systematic motif mapping, we identify a six-nucleotide stretch that is essential for miR-17-mediated repression of PKD1. Although miRNA biology has been studied extensively, fine-mapping of functional *cis-*elements at nucleotide resolution in mammalian disease genes is rare. By achieving this level of mechanistic granularity in a clinically relevant context, our work establishes a paradigm for pinpointing minimal regulatory sites that can be exploited for therapeutic intervention. Disruption of this site—either genetically, through precise base editing, or transiently, with steric-blocking oligonucleotides—stabilizes Pkd1/PKD1 transcripts, elevates PC1 protein, and attenuates cyst growth in mouse and human models. Importantly, our approach narrows the therapeutic target compared with prior studies that removed broader 3′UTR regions potentially containing multiple *cis-*elements [5]. By isolating a minimal motif sufficient for oligonucleotide masking, we both refine the mechanistic understanding of PKD1 regulation and provide a tractable strategy for restoring haploinsufficient genes.
Restoring PC1 expression also gates downstream disease pathways. Although c-Myc and miR-17 remain elevated, mitochondrial function and proliferation normalize once PC1 levels are restored. This indicates that it is the loss of PC1 that opens the gate to pathogenic outputs, whereas re-establishing PC1 closes it and prevents downstream hyperproliferation and metabolic dysfunction despite persistent upstream oncogenic signals. In this way, PC1 functions as a central checkpoint that governs proliferative and metabolic balance, and its restoration is sufficient to re-establish cellular homeostasis.
Beyond PKD1, our findings illustrate a broader therapeutic principle. Precise targeting of a minimal *cis-*regulatory miRNA motif can selectively derepress a disease-critical transcript without globally inhibiting its cognate miRNA. While anti-miR-17 strategies can simultaneously enhance PC1 expression and derepress other disease-attenuating transcripts, this approach also has the potential to suppress the benevolent features of miR-17. Thus, the motif masking preserves the wider physiological functions of miR-17 while still achieving therapeutic benefit. Moreover, this approach is mutation-agnostic. By stabilizing any residual PKD1 transcript, it could restore PC1 dosage across diverse allelic backgrounds, bypassing the challenge of correcting thousands of distinct PKD1 mutations in the patient population. Derepression of PKD1 through a single regulatory site therefore offers a unifying therapeutic entry point for ADPKD.
The robustness of our findings is supported by the breadth of models tested. We engineered three independent founder mouse lines with a targeted Pkd1 3′UTR mutation, each demonstrating PC1 stabilization and cyst suppression. In parallel, steric-blocking oligonucleotides were validated in a normal mouse cell line and in four distinct ADPKD cell models (one mouse and three human), consistently restoring PKD1 expression and attenuating cystic growth. This convergence across species, alleles, and experimental systems underscores the reproducibility and generalizability of the mechanism.
Several limitations warrant consideration. First, although we demonstrate strong effects on transcript stability, protein restoration, and cyst growth in cultured cells, testing of the Pkd1-targeting oligonucleotide in mouse models of ADPKD remains to be performed. Translation toward therapy will require optimization of oligonucleotide chemistry, dosing, and kidney-targeted delivery to ensure stability, bio-distribution, and sustained engagement. However, this limitation is mitigated by precedence involving our work on anti-miR-17 oligonucleotides RGLS4326 and RGLS8429 [10]. These oligos achieve efficient renal delivery and robust target engagement in mice, supporting the feasibility of applying steric-blocking oligonucleotides to the kidney. Second, this strategy requires at least one functional PKD1 allele. Many cysts, particularly larger, late-stage ones, have undergone somatic loss of the second allele and would therefore remain refractory to PKD1-restoring interventions [24, 25]. However, a recent study showed that up to 50% of cysts in end-stage ADPKD specimens retain residual PKD1 expression, suggesting that a substantial fraction of cysts could still be responsive to PKD1-restoring interventions [26].
In summary, our work delivers three key insights. First, nucleotide-level motif mapping in a mammalian disease context can reveal minimal *cis-*regulatory sites whose masking is sufficient to restore haploinsufficient gene expression. This remains a rare but powerful strategy for both mechanistic dissection and therapeutic intervention. Second, PC1 dosage gates downstream pathogenic programs. Low PC1 opens the gate to mitochondrial dysfunction and hyperproliferation, whereas restored PC1 closes it and normalizes cell state despite persistent oncogenic signals. Third, steric-blocking oligonucleotides targeting discrete miRNA motifs provide a feasible, mutation-agnostic, and potentially generalizable therapeutic approach for haploinsufficient disorders. Collectively, these results advance both the mechanistic understanding of PKD1 regulation and the broader concept of targeted transcript derepression as a therapeutic modality.
Supplementary Material
gkaf1538_Supplemental_Files
The reference list from the paper itself. Each links out to its DOI / PubMed record.
- 1Bartel DP . Micro RN As: genomics, biogenesis, mechanism, and function. Cell. 2004;116:281–97. 10.1016/S 0092-8674(04)00045-5.14744438 · doi ↗ · pubmed ↗
- 2Bartel DP, Chen CZ. Micromanagers of gene expression: the potentially widespread influence of metazoan micro RN As. Nat Rev Genet. 2004;5:396–400. 10.1038/nrg 1328 nrg 1328 [pii].15143321 · doi ↗ · pubmed ↗
- 3Huang E, Fu T, Zhang L et al. Genetic variants affecting RNA stability influence complex traits and disease risk. Nat Genet. 2025;57:2578–88. 10.1038/s 41588-025-02326-8.40913182 · doi ↗ · pubmed ↗
- 4Croce CM, Calin GA. mi RN As, cancer, and stem cell division. Cell. 2005;122:6–7. S 0092-8674(05)00655-0 [pii]10.1016/j.cell.2005.06.036.16009126 10.1016/j.cell.2005.06.036 · doi ↗ · pubmed ↗
- 5Lakhia R, Ramalingam H, Chang CM et al. PKD 1 and PKD 2 m RNA cis-inhibition drives polycystic kidney disease progression. Nat Commun. 2022;13:4765. 10.1038/s 41467-022-32543-2.35965273 PMC 9376183 · doi ↗ · pubmed ↗
- 6Igarashi P, Somlo S. Genetics and pathogenesis of polycystic kidney disease. J Am Soc Nephrol. 2002;13:2384–98. 10.1097/01.ASN.0000028643.17901.42.12191984 · doi ↗ · pubmed ↗
- 7Torres VE, Chapman AB, Devuyst O et al. Tolvaptan in patients with autosomal dominant polycystic kidney disease. N Engl J Med. 2012;367:2407–18. 10.1056/NEJ Moa 1205511.23121377 PMC 3760207 · doi ↗ · pubmed ↗
- 8Torres VE, Chapman AB, Devuyst O et al. Tolvaptan in later-stage autosomal dominant polycystic kidney disease. N Engl J Med. 2017;377:1930–42. 10.1056/NEJ Moa 1710030.29105594 · doi ↗ · pubmed ↗