Multiomics analyses reveal that PRMT5 regulates membrane transport and cholesterol synthesis in white adipocytes
Xiyue Chen, Zhihao Jia, Xiashiyao Zhang, Feng Yue, James F. Markworth, Christina R. Ferreira, Jun Wan, Shihuan Kuang

TL;DR
PRMT5 regulates fat cell metabolism by controlling membrane transport and cholesterol synthesis, impacting energy balance and lipid composition.
Contribution
This study reveals novel roles of PRMT5 in adipocyte metabolism through multiomics analyses.
Findings
PRMT5 knockout alters gene expression related to glucose transport and fatty acid metabolism.
PRMT5 regulates cholesterol biosynthesis, leading to hyperlipidemia and liver fat accumulation.
Lipid composition changes include reduced triacylglycerols and increased glycerophospholipids.
Abstract
The adipose tissue (AT) is a main regulator of systemic energy homeostasis, and AT dysfunction leads to insulin resistance and other metabolic complications. Protein arginine methyltransferase 5 (PRMT5) catalyzes symmetrical dimethylation of arginine residues to modulate protein stability and function. Besides its well‐studied oncogenic functions, PRMT5 has recently been shown to play a physiological role in AT through poorly understood mechanisms. Here, we explore the function of PRMT5 in AT through unbiased RNA sequencing and lipidomic analyses of AT in wild‐type and adipocyte‐specific Prmt5 knockout (Prmt5 AKO ) mice. Transcriptomic profiling revealed that Prmt5 AKO alters the expression of genes related to metabolism and membrane transport. Specifically, Prmt5 AKO induces genes enriched in glucose transport and glycolysis pathways, while suppressing genes encoding fatty acid…
Genes, proteins, chemicals, diseases, species, mutations and cell lines named across the full text — each resolved to its canonical identifier and authoritative record.
Click any figure to enlarge with its caption.
 Figure 1
 Figure 2
 Figure 3
 Figure 4
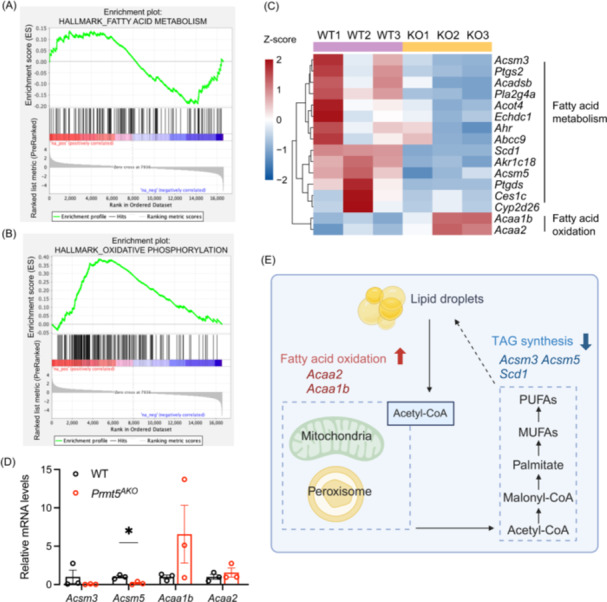 Figure 5
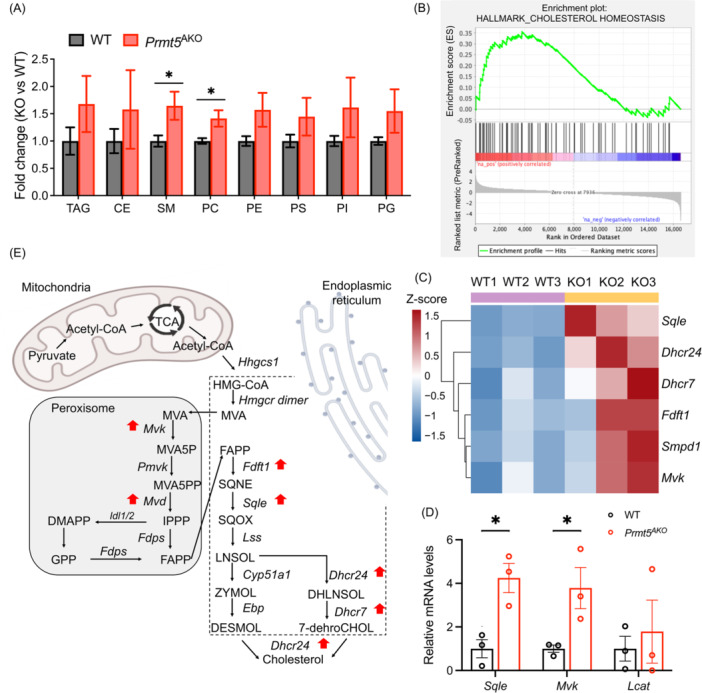 Figure 6
- —National Institutes of Health (R01AR078695, R01AR079235, R01DK132819)
Peer Reviews
No public reviews on file for this paper yet. If you reviewed it on a platform where reviews are public (OpenReview, ICLR, NeurIPS, ICML), you can paste yours below so the community can read it here.
Videos
No videos yet. Explain this paper in a talk, walkthrough, or lecture? Add one.
Taxonomy
TopicsCancer-related gene regulation
INTRODUCTION
1
In recent decades, the global incidence of obesity has increased dramatically due to overnutrition and sedentary lifestyles, increasing risks of metabolic disorders such as cardiovascular disease and type 2 diabetes (T2D) [1]. Adipose tissue (AT) plays a critical role in systemic energy homeostasis by dynamically remodeling in response to metabolic cues to regulate lipid storage, mobilization, and signaling transduction [2]. In humans and rodents, there are three types of ATs: white adipose tissue (WAT), brown adipose tissue (BAT), and beige adipose tissue (BeAT). WAT primarily functions as an energy reservoir, storing excess nutrients in the form of triacylglycerols (TAGs) within lipid droplets (LDs) and releasing free fatty acids (FFAs) through lipolysis during energy deficit [3]. In contrast, BAT is specialized for energy expenditure through non‐shivering thermogenesis. It is rich in mitochondria and expresses uncoupling protein 1 (UCP1), which dissipates energy as heat [4]. BeAT arises from WAT upon cold stimulation and shares thermogenic features with BAT. While BAT and BeAT contribute to adaptive thermogenesis and metabolic flexibility, WAT comprises the majority of AT mass in adult humans [5]. Importantly, WAT also functions as an endocrine organ by secreting hormones and cytokines, including leptin, adiponectin, and lipid‐derived signaling molecules, to regulate systemic energy metabolism and inter‐organ communication.
Adipocytes dynamically regulate cellular lipid dynamics through coordinated lipid uptake, synthesis, breakdown, and release. Circulating FFAs are taken by adipocytes to esterify into TAGs and stored in LDs. These LDs are comprised of a core of neutral lipids, primarily TAGs, but also ceramides, cholesteryl esters (CEs) and other lipid species. LDs are surrounded by a glycerophospholipid monolayer that differs from other bilayer membranes, such as those of endoplasmic reticulum (ER) membrane [6]. When energy demand increases, TAGs are hydrolyzed into fatty acids (FAs) and glycerol, which are released into the bloodstream and utilized by peripheral tissues. Thus, LD‐mediated lipid dynamics are essential for cellular homeostasis and worth investigation.
Cellular FA transport is mediated by passive diffusion or protein‐mediated mechanisms [7]. Upon stimulation, FA transporters, such as CD36 and fatty acid transport protein (FATPs), translocate to the plasma membrane to enhance FA uptake, a mechanism essential for postprandial lipid clearance and rapid energy supply to peripheral tissues [7, 8, 9]. CD36 is highly expressed in AT and is genetically linked to hyperlipidemia and hypertension [8]. FATP1 and FATP4 also facilitate FA uptake by coupling it with acyl‐CoA synthesis [9]. Dysregulation of these transporters contributes to metabolic diseases like T2D, highlighting them as potential therapeutic targets [7].
In addition to TAGs, adipocytes also synthesize and release other bioactive lipids, including glycerophospholipids and cholesterols derivatives. These molecules contribute to membrane architecture, intracellular signaling, and lipid trafficking. Among the glycerophospholipids, phosphatidylcholine (PC) is the most abundant component of the LD membrane [10, 11], followed by phosphatidylethanolamine (PE), phosphatidylinositol (PI), and phosphatidylserine (PS) [12]. The biosynthesis, interconversion, and compartmentalization of these phospholipids are closely linked to organelle function and LD dynamics [13, 14]. As such, understanding the regulation of lipid composition and membrane transport is critical to uncover the molecular bases of AT function in health and disease.
Protein arginine methyltransferases (PRMTs) catalyze protein arginine methylation, as key enzymes of posttranslational modifications (PTMs). PRMTs regulate many cellular activities, including RNA processing, DNA repair, and protein–protein interactions [15]. Based on their methylation preferences, PRMTs are classified into three types: type I enzymes produce asymmetric dimethylarginine, type II enzymes like PRMT5 generate symmetric dimethylarginine, and type III enzymes catalyze monomethyl arginine [16]. PRMT5, as the major type II enzyme, modifies both histone and non‐histone proteins, thereby playing critical roles in epigenetic regulation and signal transduction [17]. PRMT5 is best known for its oncogenic functions, with high expression in multiple tumor types. Accordingly, several PRMT5 inhibitors are currently in clinical trials as anticancer therapeutics [18]. More recently, PRMT5 has emerged as a critical regulator of metabolic homeostasis. In cardiomyocytes, PRMT5 maintains cardiac function by repressing protein O‐GlcNacylation [19]. And in hepatocytes, it promotes gluconeogenesis through CREB methylation [20]. Moreover, recent studies suggest that PRMT5 is associated with metabolic diseases like T2D, where it modulates insulin signaling and pancreatic β‐cell function [21].
In adipose tissue, PRMT5 has been shown to regulate adipogenic and lipogenic gene expression via PPARγ‐dependent mechanisms in vitro [22]. Our lab previously reported that adipocyte‐specific Prmt5 knockout (Prmt5 ^AKO^) impairs LD formation and TAG synthesis in WAT [23]. However, the mechanisms by which PRMT5 regulates lipid composition and membrane transport in vivo remain poorly understood.
In this study, we aim to investigate the physiological role of PRMT5 in white adipocytes (WAs) by integrating transcriptomic and lipidomic profiling in Prmt5 ^AKO^ mice. We specifically hypothesize that PRMT5 modulates key membrane transport pathways and lipid homeostasis. Our findings reveal that PRMT5 acts as a critical epigenetic regulator of membrane transport and lipid handling, thereby linking protein methylation to systemic metabolic homeostasis.
RESULTS
2
Transcriptional changes in response to Prmt5 KO in WAs
To investigate the role of PRMT5 in mature AT, we generated an adipocyte‐specific Prmt5 knockout (Prmt5 ^ AKO ^) mouse model. As summarized in Figure 1A, Prmt5 ^ AKO ^ leads to progressive lipodystrophy, reduced energy expenditure, hyperlipidemia, hepatic steatosis, glucose intolerance, and insulin resistance [23]. Although both male and female Prmt5 ^ AKO ^ mice showed reduced fat mass, the phenotype was more prominent in females, with a specific and pronounced reduction in epididymal WAT, a depot known to be more abundant in females [24]. Based on this stronger phenotype, we selected female mice for further studies.
*Summary of the major phenotypes of the Prmt5
AKO mice and transcriptional profiling of white adipose tissue (WAT). (A) Phenotype of Prmt5
AKO mice and experimental design. Epididymal WAT (eWAT) from WT and Prmt5
AKO mice were used for RNA extraction and Illumina HiSeq sequencing. (B) Relative Prmt5 mRNA levels in eWAT from WT and Prmt5
AKO mice. ***p < 0.001. (C) Volcano plot of differentially expressed genes (DEGs) in eWAT from WT and Prmt5
AKO mice. Log2 fold change (FC) in gene expression level in Prmt5
AKO versus WT mice and the corresponding significance values displayed as −log10 false discovery rate (FDR). The dashed line indicates the cutoff value for differential expression (FDR < 0.05 and |Log2FC| > 0.5). In total, 324 genes were downregulated (blue) and 347 genes were upregulated (red) by Prmt5 AKO. (D) Selected pathways significantly enriched by DEGs between Prmt5
AKO and WT mice, based on annotation of Kyoto Encyclopedia of Genes and Genomes (KEGG) database and Gene Ontology (GO) term. Numbers labeled next to each bar represent the number of genes enriched in each term. Red lines represent the scaled −Log10 FDR value. (E) Heatmap of selected DEGs enriched in metabolic pathway, with specific metabolic pathway clustered into two groups (Cluster 1, C1, Cluster 2, C2). (F‐G) Top 5 GO terms enriched by each cluster from (E).*
To understand how Prmt5 KO affects transcriptional pathways related to lipid metabolism, we performed RNA‐sequencing (RNA‐seq) using eWAT from 6‐month‐old WT and Prmt5 ^ AKO ^ females via Illumina high‐throughput sequencing platform (Figure 1A). We confirmed the specific reduction of Prmt5 mRNA in the samples before library construction (Figure 1B).
In total, the RNA‐seq generated 27,081,232, 33,997,614, 34,890,502, 24,238,385, 30,244,956, 29,445,634 raw reads from the six (3 WT and 3 Prmt5 ^ AKO ^) samples, which yielded 24,889,626, 30,159,890, 30,906,453, 21,983,924, 27,406,843, 26,615,776 high‐quality reads, respectively, with mapping rates ranging from 85.40% to 90.04% (Table S1). FastQC analysis demonstrated that over 20,000,000 raw reads from each sample had a mean sequence quality of 35 (Figure S1A), indicating good overall sequencing quality. We performed batch correction analysis to eliminate any artificial effects during the sample processing and sequencing. We applied false discovery rate (FDR) < 0.05 and |Log_2_ (fold change)| > 0.5 as cutoffs to identify differentially expressed genes (DEGs), resulting in a total of 671 DEGs (Table S2). These DEGs consisted of 347 upregulated genes and 324 downregulated genes, including Prmt5, in Prmt5 ^ AKO ^ eWAT (Figure 1C). Genomic visualization also clearly showed the lack of target exon 7 in Prmt5 ^ AKO ^ eWAT (Figure S1B).
Loss of Prmt5 alters the expression of genes related to metabolic and membrane transport pathways
To investigate the transcriptional changes in eWAT due to the deletion of Prmt5, we conducted functional enrichment analysis on DEGs and found that metabolic pathways and transport‐related pathways were significantly enriched in both Gene Ontology (GO) terms and Kyoto Encyclopedia of Genes and Genomes (KEGG) database (Figure 1D, Figure S1C,D, Tables S3–4). To gain more detailed insights into the dynamic changes, we performed the clustering trend analysis based on 84 DEGs enriched in KEGG metabolic pathway, and found these genes were clearly grouped into two clusters with varied response patterns towards Prmt5 ^ AKO ^ (Figure 1E, Table S5). Cluster 1 contained 38 genes whose expression was decreased in the Prmt5 ^ AKO ^ group, functionally enriched in FA and acyl‐CoA metabolic processes (Figure 1F, Table S5). Cluster 2 with 46 genes exhibited increased expression in the Prmt5 ^ AKO ^ group, with functional enrichment of cholesterol and sterol metabolic process (Figure 1G, Table S5). Consistently, GO enrichment analysis demonstrated that DEGs were significantly enriched in several metabolic process pathways (Table S4), including FA metabolism (Abcd2, Akr1cl, Acaa2, Acsm3, Akr1c18), organic acid metabolism (Errfl1, Abcd2, Acaa2, Acsm3, Gldc), small molecule biosynthetic process (Prps1, Errfl1, Akr1CL, Mvk, Acsm3), and cholesterol homeostasis (Errfl1, Dgat2, Abca5, Apoa2, Apoc3).
We next examined whether the observed gene expression changes led to metabolic functional alterations. Using indirect calorimetry, we measured rates of oxygen (O_2_) consumption rate (OCR), carbon dioxide production (CO_2_), and heat production of 6‐month‐old WT and Prmt5 ^ AKO ^ females. Prmt5 ^ AKO ^ mice exhibited a lower OCR than WT mice during both day and night (Figure 2A,B). However, the two groups showed no significant difference in CO_2_ production (Figure 2C,D) and energy expenditure (Figure 2E,F).
*Prmt5
AKO predominantly alters gene programs involved in metabolic pathways. (A) O2 consumption measured by indirect calorimetry and normalized to lean mass during a 48‐h cycle of 6‐month‐old WT and Prmt5
AKO mice. (B) Average day and night O2 consumption of 6‐month‐old WT and Prmt5
AKO mice, n = 5. *p < 0.05. (C) CO2 production measured by indirect calorimetry and normalized to lean mass during a 48‐h cycle of 6‐month‐old WT and Prmt5
AKO mice. (D) Average day and night CO2 production of 6‐month‐old WT and Prmt5
AKO mice, n = 5. (E) Heat production measured by indirect calorimetry and normalized to lean mass during a 48‐h cycle of 6‐month‐old WT and Prmt5
AKO mice. (F) Average heat production of 6‐month‐old WT and Prmt5
AKO mice, n = 5. (G) RER, a positive indicator of glucose utilization, measured by indirect calorimetry during a 48‐h cycle of 6‐month‐old WT and Prmt5
AKO mice. (H) Average day and night RER of 6‐month‐old WT and Prmt5
AKO mice, n = 5. *p < 0.05, **p < 0.001.
We then calculated the respiratory exchange ratio (RER), which is defined as the ratio of CO_2_ produced to O_2_ consumed. RER level correlates with the predominant fuel sources used during metabolism, as an RER close to 0.7 suggests lipid oxidation, whereas an RER near 1.0 indicates carbohydrate oxidation. Prmt5 ^ AKO ^ mice showed a significantly elevated RER compared to WT mice (Figure 2G,H), suggesting a metabolic shift from lipid oxidation to carbohydrate utilization.
Prmt5 deletion alters the expression profiles of membrane transporter genes
Among the significantly enriched pathways by DEGs, we found several of them were related to transport functions (Figure 1D). According to the GO enrichment, the top biological process (BP) enriched by DEGs were transport‐related pathways, including ATPase‐coupled transmembrane transporter activity, primary active transmembrane transporter activity, transporter activity (Figure S1E, Table S4). These results suggest a previously unrecognized role of PRMT5 in regulating membrane transport processes, which may have implications for AT metabolism and systemic metabolic homeostasis.
To gain further insight into how PRMT5 influences membrane transport pathways, we examined the gene profiles of 134 DEGs enriched in GO transport pathways and grouped them into two clusters (Figure 3A, Table S6). Cluster 1 with 68 genes showed reduced expression in Prmt5 ^ AKO ^ group, with functional enrichment of monoatomic ion, iron ion, lipid, and sodium ion transport pathways. Cluster 2 with 66 genes exhibited increased expression in Prmt5 ^ AKO ^ group, with functional enrichment of protein, monoatomic ion, peptide, proton, and carbohydrate transport pathways. These genes can be further classified based on their substrate specificity and mode of diffusion, including ATPase transporters, ABC transporters, and solute carrier family (SLC) transporters [25]. ATPase transporters, which use ATP hydrolysis to actively transport specific molecules, consist of four subtypes. Our analysis revealed that the expression levels of certain V‐type ATPases (encoded by Atp6v0d2, Atp6v0e2, Atp6v1c2), which are located in vacuoles such as acidic vesicles and lysosomes [26], were increased in Prmt5 ^ AKO ^ eWAT (Figure 3B), consistent with our previous finding of the elevated autophagic flux in Prmt5 ^ AKO ^ muscles [27]. In contrast, the expression of P‐type ATPases, which are localized in the plasma membrane, was either upregulated (Atp1a4, Atp7b) or downregulated (Atp11c and Atp1b1) (Figure 3B). ABC transporters contain an ATP‐binding domain and use ATP hydrolysis to transport various molecules across cell membranes [25]. We found the expression levels of Abcg4, Abcb9, and Abcc3, which function as cholesterol transporter, amino acid transporter, and multidrug transporter, respectively, were increased with Prmt5 ^ AKO ^, while levels of Abcd2, Abcb1b, Abca5, and Abca6, involved in FA transport, were decreased (Figure 3C). Expression of genes from the SLC family exhibited a chaotic, random pattern of changes (Figure 3D). Specifically, upregulated genes were involved in glucose transport (Slc2a12, Slc37a2), membrane amino acid transport (Slc15a3, Slc38a3, Slc6a13) and mitochondrial substrate transport (Slc25a19), while downregulated genes were related to ion transport (Slc40a1, Slc5a3, Slc39a8), small peptide transport (Slc15a5, Slc6a2) and amino acid transport (Slc1a3, Slc7a10) (Figure 4A). The increase in Slc37a2, Slc2a12, and the decrease in Abca5, Abca6 were validated by qPCR (Figure 4B). The upregulation of glucose transporters is consistent with the earlier observation of the increased carbohydrate diet utilization (RER) in the Prmt5 ^ AKO ^ mice (Figure 2H). In addition to the three categories, downregulated genes, including Apoa2, Apoa3, Gulp1, Pla2g4a, Ptgs2, and Ptgds were associated with lipid and FA transport, while upregulated genes, such as Mfsd12, Rtn2, Nup210, Timm13, Tap1, Ap3b2, and Arfgap1, were related to protein, peptide, carbohydrate transport (Table S6). These results collectively suggest that loss of Prmt5 leads to a general trend of decrease in lipid transport and increase in cholesterol and glucose transport (Figure 4C).
*Prmt5
AKO affects gene programs related to membrane transporters. (A) Heatmap of selected DEGs enriched in transport pathway, with specific metabolic pathway clustered into two groups (Cluster 1, C1, Cluster 2, C2). (B). Heatmap of DEGs involved in the ATPase family of transporters. (C) Heatmap of DEGs involved in the ABC family of transporters. (D) Heatmap of DEGs involved in the solute carrier family (SLC) family of transporters.*
*Prmt5
AKO suppresses fatty acid transport, while promoting glucose transport and glycolysis. (A) Heatmap of selected DEGs involved in glucose and lipid transport. (B) Relative mRNA levels of selected genes involved in glucose and lipid transport in eWAT of WT and Prmt5
AKO mice. *p < 0.05, **p < 0.01, ***p < 0.001. (C) Diagram showing the altered expression of genes involved in glucose and lipid transport in Prmt5
AKO mice compared to WT mice. (D) Gene Set Enrichment Assay (GSEA) showing enrichment of genes related to “glycolysis” in the Prmt5
AKO and WT mice. A positive value indicates correlation with Prmt5
AKO phenotype, and negative value indicates correlation with WT phenotype. (E) Diagram showing the simplified glycolysis and the sites of action of the selected components. 2‐DG competes with glucose and inhibits glycolysis. Oligomycin inhibits ATP synthase in the mitochondria, resulting in increased glycolysis. (F) Seahorse measurement of extracellular acidification rate (ECAR) of adipocytes differentiated from Prmt5
AKO and WT preadipocytes. (G) Quantification of glycolysis and glycolytic capacity based on ECAR, n = 3. p < 0.05.
Prmt5
AKO causes fuel switch from lipid to glucose metabolism
We next analyzed how Prmt5 ^ AKO ^ affects other pathways linked to glucose transport. Using Gene Set Enrichment Assay (GSEA) with Hallmark data set, we identified “glycolysis” in the upregulated pathways in Prmt5 ^ AKO ^ WAs (Figure 4D, Table S7). We further investigated whether the upregulated glycolysis pathway genes lead to elevated anaerobic glycolysis in WAs. To this end, we used Seahorse bioanalyzer to measure the extracellular acidification rate (ECAR) of adipocytes differentiated from Prmt5 ^ AKO ^ and WT preadipocytes isolated from eWATs (Figure 4E). Our results indicate that the ECAR associated with glycolysis after glucose challenge was significantly higher in Prmt5 ^ AKO ^ than in WT adipocytes (Figure 4F,G). Our findings suggest that the improved glycolysis of Prmt5‐null WAs may have contributed to systemic diet switch towards glucose utilization in Prmt5 ^ AKO ^ mice.
We also analyzed downstream pathways of the lipid transport pathway downregulated in the Prmt5 ^ AKO ^ WAs. The GSEA analysis showed that the “fatty acid metabolism” pathway was significantly downregulated in Prmt5 ^ AKO ^ WAs (Figure 5A, Table S7). In contrast, DEGs enriched in the "oxidative phosphorylation"321 pathway showed a trend of being mostly upregulated in Prmt5 ^ AKO ^, including Cox8b and Cox7a1 (Figure 5B, Table S7). Specifically, Prmt5 deletion significantly reduced the expression of TAG synthesis‐related genes, including Acsm3, Acsm5, and Scd1 (Figure 5C,D). However, Prmt5 deletion promoted the expression of Acaa2 and Acaa1b (Figure 5C), which encoded proteins that catalyze mitochondrial and peroxisomal FA beta‐oxidation, respectively. Therefore, our findings suggest that the loss of Prmt5 inhibits lipid transport and biosynthesis while promoting lipid oxidation (Figure 5E).
*Prmt5
AKO reduces fatty acid metabolism in WAT. (A) GSEA showing enrichment of genes related to fatty acid metabolic process in the Prmt5
AKO and WT mice. A positive value indicates correlation with Prmt5
AKO phenotype, and negative value indicates correlation with WT phenotype. (B) GSEA showing relative enrichment of oxidative phosphorylation in the Prmt5
AKO and WT mice. A positive value indicates correlation with Prmt5
AKO phenotype, and negative value indicates correlation with WT phenotype. (C) Heatmap of selected DEGs involved in FA metabolic process. (D) Relative mRNA levels of selected genes involved in FA metabolic process in eWAT of WT and Prmt5
AKO mice, n = 3. *p < 0.05. (E) Diagram showing the FA metabolic process with genes significantly upregulated or downregulated in Prmt5
AKO mice marked in red and blue, respectively.*
Knockout of Prmt5 leads to glycerophospholipid remodeling in WAs
To understand how alterations in lipid metabolic gene expression affect lipid composition, we conducted a MS‐based lipidomics analysis on eWAT from 6‐month‐old Prmt5 ^ AKO ^ and WT females. We identified more than 1084 differentially expressed lipid species belonging to 10 classes, including 190 TAGs, 56 CEs, 21 FFAs, 710 glycerophospholipids (PC, PE, PS, PI, phosphatidylglycerol (PG)), and 107 sphingolipids (Ceramide (Cer) and sphingomyelin (SM)) (Table S8). The principal component analysis (PCA) plot indicated fundamental differences between WT and Prmt5 ^ AKO ^ groups manifested by two distinct clusters (Figure S2A). Further analysis revealed significant increases in the contents of PC and SM in the Prmt5 ^ AKO ^ WAs (Figure 6A), suggestive of increased membrane curvature due to reduced size of Prmt5‐null WAs. However, there were no significant differences in other lipid classes. To further investigate the specific lipid species regulated by Prmt5 ^ AKO ^, we visualized all significant changes in individual lipid species from all lipid classes using a bubble map (Figure S2B). With a cutoff of p < 0.05, we identified 106 significantly changed lipid species in eWAT from Prmt5 ^ AKO ^ groups. Among these, several TAGs were found to be substantially reduced (Figure S2B). Interestingly, the most significantly increased lipid species mainly comprised of glycerophospholipids (PC, PE, and PI) and SM (Figure S2B). These findings suggest that Prmt5 deletion induces considerable alternation in the composition and content of lipid species in eWAT, resulting in decreased amounts of TAGs and increased glycerophospholipids and SM.
*Prmt5
AKO induces glycerophospholipid remodeling in WAT. (A) Fold change of the lipid species in eWAT from Prmt5
AKO and WT mice. Lipid species include triacylglycerol (TAG), cholesteryl ester (CE), phosphatidylcholine (PC), phosphatidylethanolamine (PE), phosphatidylserine (PS), phosphatidylinositol (PI), phosphatidylglycerol (PG), and sphingomyelin (SM). *p < 0.05. (B) GSEA showing significant enrichment of genes involved in the “cholesterol homeostasis” pathway in the Prmt5
AKO mice compared to WT mice. A positive value indicates correlation with Prmt5
AKO phenotype, and negative value indicates correlation with WT phenotype. (C) Heatmap of DEGs involved in cholesterol metabolism. (D) Relative mRNA levels of selected genes involved in cholesterol metabolism in eWAT of WT and Prmt5
AKO mice. *p < 0.05. (E) Peroxisome and cholesterol biogenesis processes with genes significantly upregulated in Prmt5
AKO mice are marked by red arrows.*
We further analyzed the impact of Prmt5 deletion on glycerophospholipids. We observed a significant increase in total PC levels in Prmt5 ^ AKO ^ eWAT, with PCs containing C34:2 and C36:2 being the most upregulated (Figure S2C). Notably, most of the significantly upregulated glycerophospholipids, including PC, PE, and PI, contained at least one unsaturated carbon chain. Consistently, upregulated DEGs in Prmt5 ^ AKO ^ eWAT were involved in glycerophospholipids biosynthesis (Table S4). Similarly, Pla2g2e, which regulates the internal conversion among different species of PL, was among the upregulated DEGs. Interestingly, DEGs involved in ether lipid metabolism, such as Pla2g4e, were significantly decreased in Prmt5 ^ AKO ^ eWAT. These results suggest that PRMT5 is involved in the ether lipid metabolism pathways, and its deletion leads to glycerophospholipid remodeling, particularly an increase in PC levels.
Since glycerophospholipids are key components of membrane structure, we performed transmission electron microscopy (TEM) on eWAT from 6‐month‐old Prmt5 ^ AKO ^ and WT females (Figure S3A). TEM analysis revealed ruffling of LD membrane and the presence of small vesicles in Prmt5 ^ AKO ^ eWAT, which correlate with the observed PC increase. To further investigate whether elevated PC levels affect membrane structure, we performed NR12S staining to assess membrane fluidity in adipocytes. This dye can reflect the status of lipid packing via general polarization (GP) values, with higher GP values indicating more rigid membranes. Our results revealed that Prmt5‐deficient adipocytes exhibited significantly reduced membrane fluidity compared to WT adipocytes, as indicated by a higher GP value (Figure S3B). These results indicate Prmt5 deletion leads to glycerophospholipid dynamics and membrane rigidification.
Loss of Prmt5 promotes cholesterol biosynthesis
Given the upregulation of cholesterol transport pathway in the Prmt5 ^ AKO ^ WAs, we sought to investigate the impact of Prmt5 loss on cholesterol biosynthesis pathways. GSEA using the Hallmark database indicated a significant upregulation of genes enriched in cholesterol homeostasis pathways such as Sqle, Dhcr7, and Mvd (Figure 6B, Table S7). Functional enrichment of cholesterol metabolism pathways also revealed the expression levels of Dhcr24, Dhcr7, Fdft1, and Sqle, which encode key proteins involved in the cholesterol biosynthesis pathways in ER, were upregulated after Prmt5 knockout (Figure 6C,D). Moreover, the expression level of Mvk and Smpd1, which play critical roles in peroxisomal cholesterol biosynthesis pathways, was upregulated after Prmt5 deletion (Figure 6C,D). Additionally, GSEA using the Hallmark database demonstrated that upregulated genes in Prmt5 ^ AKO ^ were specifically enriched in peroxisome pathways (Table S7). However, Lcat gene, responsible for the formation of CE from free cholesterol, shows no difference from RNA‐seq data (Figure 6D, Figure S2D). Consistently, the total concentrations of CE were similar in WT and Prmt5 ^ AKO ^ WAs (Figure 6A). Together, these results indicate that Prmt5 ^ AKO ^ mice promote cholesterol biosynthesis in WAs and free cholesterol accumulation in the circulation (Figure 6E).
DISCUSSION
3
We have previously reported that the absence of Prmt5 in adipocytes leads to age‐ and sex‐dependent lipodystrophy, accompanied by insulin resistance, hepatic steatosis, and systemic metabolic dysfunction [23]. These findings establish PRMT5 as a critical regulator of adipocyte biology. Nevertheless, the precise mechanism of PRMT5 in governing lipid dynamics remains unclear. In this study, we utilized unbiased RNA‐seq and MS‐based lipidomics to investigate the transcriptomic and lipidomic changes associated with the loss of Prmt5 in WAs. Our aim was to provide an in‐depth molecular signature underlying PRMT5 function in WAs. This information may have potential implications for developing therapeutic interventions for metabolic disorders.
Our transcriptional analysis revealed significant gene reprogramming in Prmt5 knockout mice, resulting in profound metabolic alterations and a systemic energy shift, along with the lipodystrophy and insulin‐resistant phenotype of Prmt5 ^ AKO ^ mice. One of our key findings was a metabolic shift in substrate utilization from FAs to glucose in Prmt5 ^ AKO ^ mice, as demonstrated by both transcriptional profiling and indirect calorimetry. The RER reflects the primary fuel source for metabolism, with carbohydrate oxidation (RER = 1) yielding more CO_2_ per O_2_ consumed than fat oxidation (RER = 0.7) [28]. Our results indicated that the average RER of Prmt5 ^ AKO ^ mice was 0.82, whereas that of WT mice was 0.76. The higher RER level in Prmt5 ^ AKO ^ mice suggests a shift towards more carbohydrate utilization. This was further supported by upregulation of glucose transport genes, Slc2a12, and Slc37a2, in AT of Prmt5 ^ AKO ^ mice. Notably, while Slc2a4 (GLUT4) did not show significant changes at mRNA levels, likely due to regulation through subcellular localization, as GLUT4 translocation from cytosolic vesicles to the cell membrane leads to elevated glucose uptake [29]. Conversely, the glucose transporter Slc2a3 showed reduced expression due to its high glucose affinity. It has been reported that glucose transferred by GLUTs with lower glucose affinity would be more dependent on the circulating glucose concentration [30]. Since GLUT12 coded by Slc2a12 has lower glucose affinity than GLUT3 coded by Slc2a3, GLUT12 might respond to the high blood glucose level more efficiently than GLUT3 in Prmt5 ^ AKO ^ mice at 6 months old, suggesting it might be responsible for the increased glucose transport. Thus, changes in the genetic variation of transport pathway reinforced a possible switch from FA to glucose transport, which subsequently caused the fuel utilization change in Prmt5 ^ AKO ^ eWAT. With higher level of Slc2a12, more glucose would enter the cytosol, while increased Slc37a2, known as glucose‐6‐phosphate transporter [31], led to the translocation of glucose into the lumen of the ER for hydrolysis. Importantly, these metabolic characteristics are commonly observed in human metabolic diseases such as T2D and obesity. Clinical studies have demonstrated that individuals with insulin resistance often exhibit impaired lipid oxidation and a compensatory reliance on glucose metabolism, with higher RER levels and impaired GLUTs [32, 33, 34]. Our study may therefore provide insights into how epigenetic regulator like PRMT5 contribute to metabolic diseases.
In parallel, we observed a downregulation of genes involved in FA metabolism and a corresponding reduction in TAGs and FFAs levels in Prmt5 ^ AKO ^ eWAT. Specifically, Acsm3 and Acsm5 initiate cellular FA metabolism by converting FAs into their corresponding acyl‐CoA. Our findings are consistent with previous reports that PRMT5 methylated and stabilized SREBP1a, a key transcription factor in the regulation of lipid synthesis [23, 35]. Indeed, we observed a reduction in the expression levels of SREBP1 target genes, such as Scd1, in Prmt5 ^ AKO ^ eWAT. Additionally, although PRMT5 has been reported to be essential for mitochondrial biogenesis and dynamics in hepatocytes and cancer cells [36, 37], the physiological role of PRMT5 in adipocyte mitochondria remains unknown. Interestingly, despite the increased expression of mitochondrial‐related genes, such as Cox8b and Cox7a1, and an elevated number of mitochondria observed by TEM in Prmt5 ^ AKO ^ eWAT, these mice exhibited reduced energy expenditure. This seemingly paradoxical finding can be explained by impaired mitochondrial function. Our previous study demonstrated that WAs from Prmt5 ^ AKO ^ mice exhibit significantly reduced OCR, as measured by Seahorse assay [23]. The upregulation of mitochondrial genes in the Prmt5 ^AKO^ may be triggered by a feedback mechanism in response to reduced mitochondrial function. A similar phenotype has been reported in BSCL2‐deficient patients, where increased mitochondria with abnormal morphology coexist with impaired respiration [38]. In line with this, we previously showed that PRMT5 regulates Bscl2 expression by methylating its transcription elongation factor SPT5 [23]. Therefore, loss of PRMT5 disrupts this regulation of Bscl2, potentially leading to mitochondrial abnormalities that similar with BSCL2‐deficient patients.
Serum analysis revealed that Prmt5 knockout mice exhibited significantly higher levels of cholesterol, HDL, and LDL, which led to an overburdened liver developing into fatty liver [23]. In accordance, we observed increased expression of genes involved in cholesterol biogenesis in Prmt5 ^ AKO ^ eWAT. Interestingly, lipidomics results showed no difference of CE content in eWAT. Consistent with this, transcriptome analysis showed no change in Lcat gene expression, which encodes the enzyme lecithin‐cholesterol acyltransferase, responsible for the formation of cholesteryl ester. These results suggest that Prmt5 deletion promotes free cholesterol accumulation without affecting its esterification. Free cholesterol is essential for systemic metabolism, as it maintains cell membrane integrity and serves as a precursor for steroid hormones and vitamin D synthesis. Recent evidence suggests that AT participates in several metabolic activities, such as hormone secretion and cholesterol efflux, in addition to its energy storage function [39]. Therefore, it would be interesting to further investigate the proteomic analysis of the secretome and exosomes from Prmt5 ^ AKO ^ eWAT to determine if free cholesterol or other potential adipokines and small molecules are involved in systemic regulation.
Lipidomics also revealed a highly dynamic remodeling process in glycerophospholipid species in Prmt5 ^ AKO ^ eWAT. Gpam, which catalyzes an essential step in glycerophospholipid biosynthesis, was downregulated, and several genes involved in glycerophospholipids interconversion and turnover also showed differential expression. Although no uniform shift in all glycerophospholipid classes was observed, specific changes in individual subspecies suggested selective remodeling in response to Prmt5 deficiency. Among these, PC, the predominant glycerophospholipid in mammalian cells and a key component of cellular and organelle membrane [40], was significantly increased, indicating remarkable organelle reprogramming. This is particularly relevant to defects in LD biogenesis as previously reported in Prmt5 ^ AKO ^ adipocytes [23]. The functional consequences of increased PC levels revealed that Prmt5‐deficient adipocytes displayed reduced membrane fluidity. These findings suggest that increased PC accumulation is associated with membrane rigidification, which may impair key processes such as LD expansion, vesicle budding, and organelle communication. Notably, reduced membrane fluidity has been associated with metabolic disorders, like insulin resistance [41], which is consistent with the metabolic dysfunction observed in Prmt5 ^ AKO ^ mice.
Glycerophospholipids are known to be transported through both vesicular and non‐vesicular trafficking pathways [42]. As ABC transporters are known to be involved [42], dynamic gene expression profiling of ABC‐related genes could be related to the inter‐organellar transport of glycerophospholipids. The interfacial behavior of oxidized glycerophospholipids differs depending on the unsaturated bond distribution [43]. As unsaturation levels increase in glycerophospholipids, oxidation causes the formation of smaller‐sized oxidation products cleaved from larger lipid molecules with truncated hydrocarbon residues, further facilitating vesicle formation by allowing for the necessary curvature and flexibility during the budding process [44]. Additionally, glycerophospholipid biosynthesis occurs primarily in the ER, where enzymes such as phosphatidylcholine synthase and phosphatidylethanolamine methyltransferase catalyze the stepwise assembly of phospholipid molecules from precursor molecules. The newly synthesized phospholipids are then transported to other organelles, including the Golgi apparatus, via vesicular trafficking pathways. Consistently, unsaturated glycerophospholipids are predominant among the increased glycerophospholipid species in Prmt5 ^ AKO ^ eWAT, and TEM results showed a bundle of small vesicles in Prmt5 ^ AKO ^ eWAT, suggesting active vesicular trafficking activities. However, to further study this phenomenon, experiments such as isolating different organelles for RNA and lipid profiling and Immunofluorescent staining of selected transporters need to be applied.
While our study provides an in‐depth analysis of transcriptomic and lipidomic changes in Prmt5‐deficient WAs, we realize that mRNA levels do not always correlate with protein abundance or activity. As proteins are the ultimate effectors of cellular function, incorporating proteomic analysis in the future would greatly enhance the understanding of PRMT5‐mediated regulation in adipocytes. Performing quantitative proteomics with a focus on isolated organelles, as well as on the extracellular vesicles and the secretome, is important to validate key modulators identified from our RNA‐seq results.
The mechanism by which PRMT5 regulates these genes remains to be fully elucidated. PRMT5 is distinct from well‐characterized transcriptional regulators of adipogenesis and lipid metabolism, such as PPARγ and SREBP1. While PPARγ and SREBP1 function as transcription factors that directly bind DNA to activate downstream gene expression, PRMT5 primarily exerts its effects through PTM. Specifically, PRMT5 methylates histone proteins like H4R3 and H3R2, and non‐histone protein SREBP1a to regulate lipogenesis [35, 45]. The dual function in both chromatin remodeling and protein stabilization underscores PRMT5's unique and multifaceted role in adipocyte metabolism. In the context of enhanced cholesterol biogenesis, we identified several binding peaks in the promoter regions of both Dhcr7 and Sqle, by analyzing PRMT5 CHIP‐seq data from 3T3‐L1 adipocytes [46]. Thus, PRMT5 may directly regulate these loci, while future validation of the interaction is needed.
Another notable limitation of our study is that the analysis was conducted exclusively in females. The stronger phenotype in females allowed for enhanced sensitivity in detecting transcriptomic and lipidomic changes. However, given the known sex differences in adipose distribution, hormone signaling, and metabolic regulation, future studies are needed to assess whether the regulation of PRMT5 is conserved in male mice or exhibits sex‐specific differences.
Finally, our findings raise important considerations for the therapeutic use of PRMT5 inhibitors, which are currently in clinical trials for cancer. While PRMT5 inhibition is a promising therapy in oncology, our adipocyte‐specific knockout model revealed potential metabolic side effects, including elevated cholesterol biosynthesis, insulin resistance, and dyslipidemia. It is important to note that our results demonstrate the physiological consequences of PRMT5 deficiency at endogenous levels in adipocytes, which differ from the pathological overexpression often observed in cancer cells. Nevertheless, these findings highlight the need for caution in clinical application, as systemic PRMT5 inhibition may disrupt normal metabolic homeostasis. Therefore, therapeutic strategies must aim to target PRMT5 selectively in tumors but not completely abolish its expression in noncancerous tissues. To mitigate unintended metabolic effects, targeted delivery systems that restrict PRMT5 inhibition to tumor sites may be essential. Alternatively, co‐treatment approaches that preserve metabolic health could be explored.
CONCLUSION
4
Our study identifies PRMT5 as a key epigenetic regulator of adipocyte metabolism by modulating fuel preference and lipid homeostasis. Loss of PRMT5 disrupts multiple transcriptional processes, leading to systemic metabolic dysfunction, including insulin resistance and dyslipidemia. These findings broaden our understanding of adipose regulation and raise important considerations for the safe therapeutic targeting of PRMT5.
METHODS
5
Animals
The Adipoq‐Cre (stock #010803) mice were obtained from Jackson Laboratory. The frozen sperms from mice harboring Prmt5 ^ tm2c ^(EUCOMM)^wtsi^ were purchased from Wellcome Trust Sanger Institute. The in vitro fertilization, embryo development, and implantation in female C57BL/6 were performed in the Purdue University Transgenic and Genomic Editing Facility. PCR‐based genotyping was performed to screen for Prmt5 ^ f/f ^ mice. The Adipoq‐Cre and Prmt5 ^ flox/flox ^ mice were intercrossed for several generations to generate the Prmt5 ^ AKO ^ mice as previously described [23]. Prmt5 ^flox/flox^ mice were crossed with Ucp1‐Cre mice from Jackson Laboratory (stock#024670) to generate BA‐specific Prmt5 KO mice (Prmt5 ^UKO^ mice). The genotypes of experimental KO and associated control animals are as follows: Prmt5 ^ AKO ^ (Adipoq‐Cre, Prmt5 ^ flox/flox ^), Prmt5 ^ UKO ^ (Ucp1‐Cre, Prmt5 ^ flox/flox ^), and WT (Prmt5 ^ flox/flox ^). Mice were housed in the animal facility with free access to water and standard rodent chow food (control diet) or HFD (TD.06414 Harlan). Mouse maintenance and experimental use were performed according to protocols approved by the Purdue Animal Care and Use Committee.
Indirect calorimetry study
Oxygen consumption (VO_2_), carbon dioxide production (VCO_2_), RER, and heat production were measured by using an indirect calorimetry system (Oxymax, Columbus Instruments) installed under a constant environmental temperature (22°C) and a 12‐h light (06:00–18:00 h), 12‐h dark cycle (18:00–06:00 h). Mice in each chamber had free access to food (chow diet or HFD) and water. The raw data were normalized by body muscle mass, and the histograms of day (06:00–18:00 h) and night (18:00–06:00 h) values were the mean value of all points measured during the 12‐h period.
Total RNA extraction and real‐time PCR
Total RNA was extracted from cells or tissues using Trizol Reagent according to the manufacturer's instructions. The purity and concentration of total RNA were measured by a spectrophotometer (Nanodrop 3000, Thermo Fisher) at 260 and 280 nm. All samples' absorption ratios (260/280 nm) were ~2.0. Then, 3 μg of total RNA were reversed transcribed using random primers and MMLV reverse transcriptase. Real‐time PCR was carried out with a Roche Lightcycler 480 PCR System using SYBR Green Master Mix and gene‐specific primers. Primer sequences were listed in Table S9. The 2^−ΔΔCT^ method was used to analyze the relative changes in gene expression normalized against mouse β‐Actin as an internal control.
RNA‐seq analysis
Total RNA was extracted from eWAT of 6‐month‐old WT and Prmt5 ^ AKO ^ female mice and subjected to RNA‐seq performed by Novo Bioinformatics Co., Ltd. Briefly, RNA quality analysis was checked by Agarose Gel Electrophoresis and Agilent 2100. A complementary DNA library was then constructed using mRNA enriched by anti‐polyA beads, and sequencing was performed according to the Illumina HiSeq standard protocol. Quality control for raw mRNA‐seq data was conducted using FastQC v0.11.9 [47]. Illumina adapter sequences and low‐quality bases were trimmed with Trim Galore v0.6.0 [48]. High‐quality paired‐end reads were then mapped to the mouse genome (GRCm38 vM25) using the STAR aligner v2.7.10a [49]. We utilized bam‐filter in ngsutilsj v0.5.9 to retain only properly and uniquely mapped paired reads (MAPQ ≥ 10) for downstream analysis [50]. Gene expression levels were summarized using FeatureCounts from the subread package v2.0.1 [51]. A differential expression analysis was performed using the EdgeR v4.0.16 [52]. The KEGG and GO pathway analyses were performed using the DAVID online software (https://davidbioinformatics.nih.gov/).
Lipid extraction and targeted lipid profiling
Lipids were extracted from 4 to 6‐month‐old WT and Prmt5 ^ AKO ^ mice using the Bligh & Dyer extraction method as described [53]. Briefly, 50 mg eWAT samples per mouse were transferred to a 2 mL vial with inert 1.4 mm ceramic (zirconium oxide) beads (Precellys CK 14, Bertin Corp, part # P000912‐LYSK0A), and 500 μL of ultrapure water was added to homogenize the sample using the Precellys tissue homogenizer (Bertin Corp) at three cycles of 6200 rpm for 20 s. Next, 200 μL of homogenized tissue was transferred to a new microtube and mixed with 250 μL chloroform and 450 μL of methanol. This solution was incubated at room temperature for 15 min. After that, 250 μL of chloroform and 250 μL of water were added, and the sample was centrifuged for 10 min at 16,000 × g, forming a 2‐phase solution where the bottom phase contained the lipids (organic phase). The organic phase was transferred to a new tube and dried using a speed vac centrifuge (Savant Speedvac, Thermo Scientific Inc.), and samples were stored at −80°C until mass spectrometry analysis.
Targeted lipid profiling was performed using discovery multiple reaction monitoring (MRM) profiling methods and instrumentation in the Metabolite Profiling Facility at Purdue University for MRM profiling as described [53, 54, 55]. Dried lipid extracts were diluted in 500 μL of methanol/chloroform 3:1 (v/v) (stock solution). The stock solution was further diluted 50× in injection solvent (acetonitrile/methanol/ammonium acetate 300 mM 3:6.65:0.35 (v/v)), and 8 μL of this solution was used for the profiling analysis of each lipid class using a micro‐autosampler (G1377A) to the ESI source of an Agilent 6410 triple quadrupole mass spectrometer (Agilent Technologies). A capillary pump was connected to the autosampler and operated at a flow rate of 7 μL/min and a pressure of 150 bar. The capillary voltage on the instrument was 3.5–5 kV, and the gas flow was 5.1 L/min at 300°C.
For the MS analysis, relative amounts of ion abundances were used for statistics. For the relative expression level, values of ion intensities for each MRM monitored were normalized by the total ion intensity of all MRMs in the method for a given sample. For absolute quantification, each injection was normalized to 16 μg of tissue used for the analysis based on the ion intensities of internal standards. Further statistical analysis was then performed using Metaboanalyst 4.0 software (https://www.metaboanalyst.ca). Uploaded data was auto‐scaled and analyzed with Student's t‐test with a two‐tailed distribution. Volcano plots (Fold change threshold 2, p‐value threshold 0.05), PCAs, and heatmaps were plotted. Fold change was calculated by dividing values of ion intensities for each of the MRMs measured in each sample by the ion intensity of the corresponding MRM in the blank.
Seahorse XF cell glycolysis stress analysis
The glycolytic capacity was determined using the Agilent Seahorse XF Glycolysis Stress Test Kit (Agilent Technologies, 103020‐100). The cells were seeded in an XFe24 cell culture microplate at a density of 4 × 10^4^ cells/well. The Seahorse XFe24 Flux sensor cartridge was hydrated overnight in a utility plate filled with 800 μL of Seahorse Calibrant in a non‐CO_2_ incubator at 37°C. The next day, cells were exposed to Seahorse XF base medium supplemented with 1 mM l‐glutamine in a non‐CO_2_ incubator for 30 min before the assay. The ECAR was measured by the sequential injection of 100 μM glucose, 30 μM oligomycin, and 500 μM 2‐DG. After the experiment, cells were fixed in 20% (w/v) TCA overnight at 4°C. The fixed cells were washed four times with ddH_2_O and air‐dried at room temperature. Cells were stained with 0.04% sulforhodamine B (SRB) solution at room temperature for 1 h and quickly rinsed with 1% (v/v) acetic acid, followed by air drying. Cell lysates were resolved in 10 mM Tris‐base solution (pH 10.5), and the absorbance was measured at 510 nm to determine cell number. ECAR values were normalized to the number of cells in each well.
Transmission electron microscopy
The eWAT from 6‐month‐old WT and Prmt5 ^ AKO ^ female mice were cut into 1 × 2 mm blocks in a 6‐cm culture dish immediately after euthanizing the mice, and then fixed in 2.5% glutaraldehyde for 30 min. The blocks were continued to be fixed in 2.5% glutaraldehyde for 1 h, followed by fixation in 2% osmium tetroxide for 1 h. All the fixatives were made with 0.1 M cacodylate buffer. After washing, the blocks were dehydrated in a graded ethanol series and then embedded in Epon Generic Resin. The sections with a thickness of about 90 nm were prepared with uranyl acetate and lead citrate stain and examined with a transmission electron microscope (Gatan Digital Microscopy).
Membrane fluidity measurement
Membrane fluidity was measured using the fluorescent lipids probe NR12S (Tocris, 7509). Mature adipocytes were isolated from adipose tissues and stained with 100 nM of NR12S for 30 min. After washing with PBS for three times, cells were analyzed using a spectral meter, with excitation wavelength at 554 nm and emission wavelengths set at 560 and 630 nm. Generalized polarization (GP) values were calculated using the formula: GP = (I 560 − I 630)/(I 560 + I 630).
Statistical analysis
Trial experiments or experiments done previously were used to determine sample size with adequate statistical power. The researchers involved in the in vivo treatments were not completely blinded, but all insulin tolerance test and glucose tolerance test were conducted blindly. All images were randomly captured from the sample and analyzed in a blinded manner. No data were excluded from the following statistical analysis. All analyses were conducted with Student's t‐test with a two‐tailed distribution, and the graphs were made using GraphPad Prism software. All experimental data are represented as mean ± s.e.m (n ≥ 3). Comparisons with p values < 0.05 were considered statistically significant. Due to small sample size, normality could not be formally tested; data were assumed to be approximately normally distributed as commonly accepted in similar studies.
AUTHOR CONTRIBUTIONS
Shihuan Kuang and Zhihao Jia: Conceptualization; methodology. Xiyue Chen, Xiashiyao Zhang, Zhihao Jia, and Christina R. Ferreira: Investigation. Xiyue Chen, Xiashiyao Zhang, Zhihao Jia, Feng Yue, Jun Wan, James F. Markworth, and Christina R. Ferreira: Data curation; formal analysis. Xiyue Chen, Zhihao Jia, Xiashiyao Zhang, Jun Wan, and Shihuan Kuang: Writing—original draft. Shihuan Kuang, Zhihao Jia, Xiyue Chen, Xiashiyao Zhang, Christina R. Ferreira, Feng Yue, Jun Wan, and James F. Markworth: Writing – review & editing; final manuscript approval. All authors have read the final manuscript and approved it for publication.
CONFLICT OF INTEREST STATEMENT
The authors declare no conflicts of interest.
ETHICS STATEMENT
Mouse maintenance and experimental use were performed according to protocols approved by the Purdue Animal Care and Use Committee (IPROTO1112000440).
Supporting information
Figure S1. Prmt5 ^ AKO ^ induces gene programs involved in metabolic and transport pathways. Figure S2. Prmt5 ^ AKO ^ induces changes in lipid dynamics. Figure S3. Prmt5 ^ AKO ^ alters membrane morphology in eWAT.
Table S1. Summary of RNA‐seq Reads and Mapping Statistics. Table S2. Counts per million (CPM) values of all genes analyzed with edgeR. Table S3. Pathway analysis of differentially expressed genes (DEGs) based on the KEGG database. Table S4. Pathway analysis of differentially expressed genes (DEGs) based on the GO terms. Table S5. Clustering and pathway analysis of metabolism‐related DEGs. Table S6. Clustering and pathway analysis of transport‐related DEGs. Table S7. Gene Set Enrichment Assay (GSEA) with Hallmark dataset. Table S8. Lipidomics results. Table S9. Primers for real‐time PCR.
The reference list from the paper itself. Each links out to its DOI / PubMed record.
- 1Huh, Jin Young , Yoon Jeong Park , Mira Ham , and Jae Bum Kim . 2014. “Crosstalk Between Adipocytes and Immune Cells in Adipose Tissue Inflammation and Metabolic Dysregulation in Obesity.” Molecules and Cells 37: 365–371. 10.14348/molcells.2014.0074 24781408 PMC 4044307 · doi ↗ · pubmed ↗
- 2Luo, Liping , and Meilian Liu . 2016. “Adipose Tissue in Control of Metabolism.” Journal of Endocrinology 231: R 77–R 99. 10.1530/JOE-16-0211 27935822 PMC 7928204 · doi ↗ · pubmed ↗
- 3Birsoy, Kıvanç , William T. Festuccia , and Mathieu Laplante . 2013. “A Comparative Perspective on Lipid Storage in Animals.” Journal of Cell Science 126: 1541–1552. 10.1242/jcs.104992 23658371 · doi ↗ · pubmed ↗
- 4Townsend, Kristy L. , and Yu‐Hua Tseng . 2014. “Brown Fat Fuel Utilization and Thermogenesis.” Trends in Endocrinology & Metabolism 25: 168–177. 10.1016/j.tem.2013.12.004 24389130 PMC 3972344 · doi ↗ · pubmed ↗
- 5Hausman, D. B. , M. Di Girolamo , T. J. Bartness , G. J. Hausman , and R. J. Martin . 2001. “The Biology of White Adipocyte Proliferation.” Obesity Reviews 2: 239–254. 10.1046/j.1467-789X.2001.00042.x 12119995 · doi ↗ · pubmed ↗
- 6Arisawa, K. , I. Ichi , Y. Yasukawa , Y. Sone , and Y. Fujiwara . 2013. “Changes in the Phospholipid Fatty Acid Composition of the Lipid Droplet during the Differentiation of 3T 3‐L 1 Adipocytes.” Journal of Biochemistry 154: 281–289. 10.1093/jb/mvt 051 23760554 · doi ↗ · pubmed ↗
- 7Glatz, Jan F. C. , Joost J. F. P. Luiken , and Arend Bonen . 2010. “Membrane Fatty Acid Transporters as Regulators of Lipid Metabolism: Implications for Metabolic Disease.” Physiological Reviews 90: 367–417. 10.1152/physrev.00003.2009 20086080 · doi ↗ · pubmed ↗
- 8Epps, Caleb T. , Robin D. Clugston , Amit Saha , William S. Blaner , and Li‐Shin Huang . 2016. “Chapter 6 ‐ The Role of CD 36 in the Pathogenesis of Alcohol‐Related Disease.” In Molecular Aspects of Alcohol and Nutrition (pp. 71–84). Academic Press. 10.1016/B 978-0-12-800773-0.00006-9 · doi ↗