Productivity-driven decoupling of microbial carbon use efficiency and respiration across global soils
Yongxing Cui, Shushi Peng, Manuel Delgado-Baquerizo, Daryl L. Moorhead, Robert L. Sinsabaugh, César Terrer, Thomas P. Smith, Yakov Kuzyakov, Josep Peñuelas, Biao Zhu, Feng Tao, Songbai Hong, Ji Chen, Matthias C. Rillig

TL;DR
Microbial efficiency in using carbon in soils varies with ecosystem productivity, limiting carbon storage in productive regions.
Contribution
A stoichiometry-based approach reveals a nonlinear relationship between microbial C use efficiency and respiration across ecosystems.
Findings
In low-productivity regions, microbial C use efficiency declines with increasing respiration.
In productive regions, C use efficiency stabilizes at low levels despite higher respiration.
Microbial trade-offs between assimilation and homeostasis limit soil carbon storage in productive ecosystems.
Abstract
Despite extensive research on soil microbial carbon (C) use efficiency (CUE), its linkage to actual soil C storage remains ambiguous. A key uncertainty is that CUE estimates from short-term labeling incubations assume a linear negative relationship with respiration rates, overlooking nonlinear interactions and long-term microbial acclimation. Here, we use a stoichiometry-based approach to estimate CUE (CUEST), which links soil resource availability to microbial demand and captures microbial adaptability under resource constraints. We synthesized 1094 paired observations of CUEST and heterotrophic respiration rate (Rh) across natural ecosystems and found a nonlinear relationship between them governed by ecosystem productivity. In low-productivity arid and cold regions, CUEST declined with increasing Rh, whereas in productive tropical and temperate regions, CUEST stabilized at a low level…
Genes, proteins, chemicals, diseases, species, mutations and cell lines named across the full text — each resolved to its canonical identifier and authoritative record.
Click any figure to enlarge with its caption.
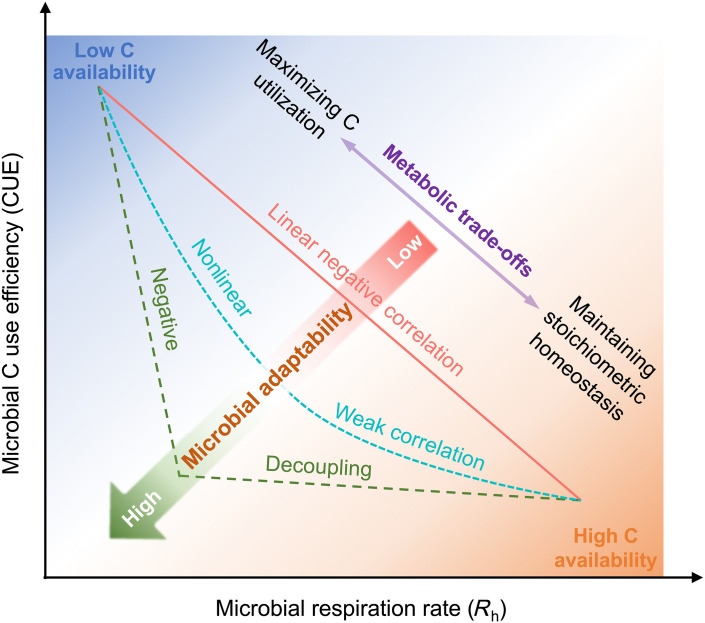 Fig. 1
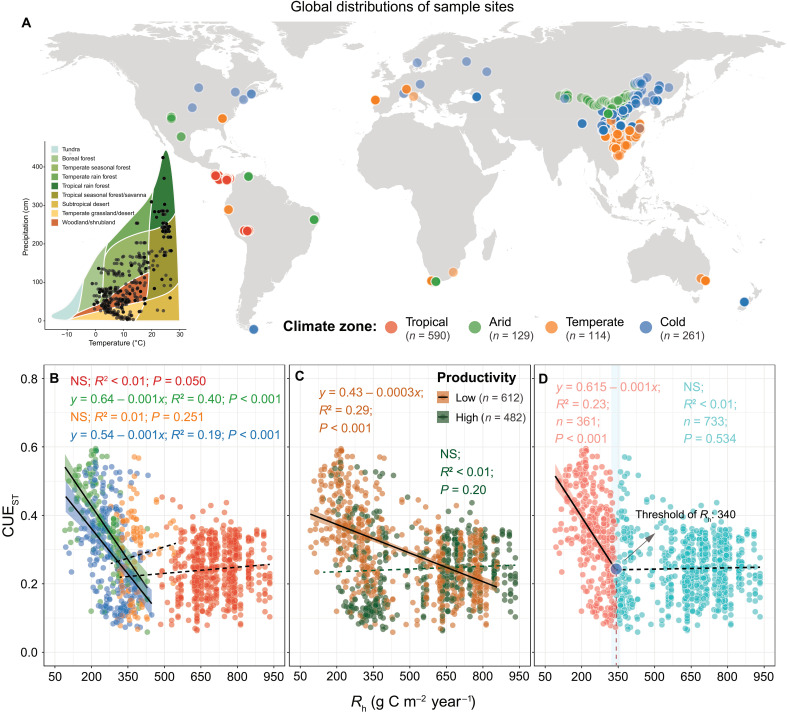 Fig. 2
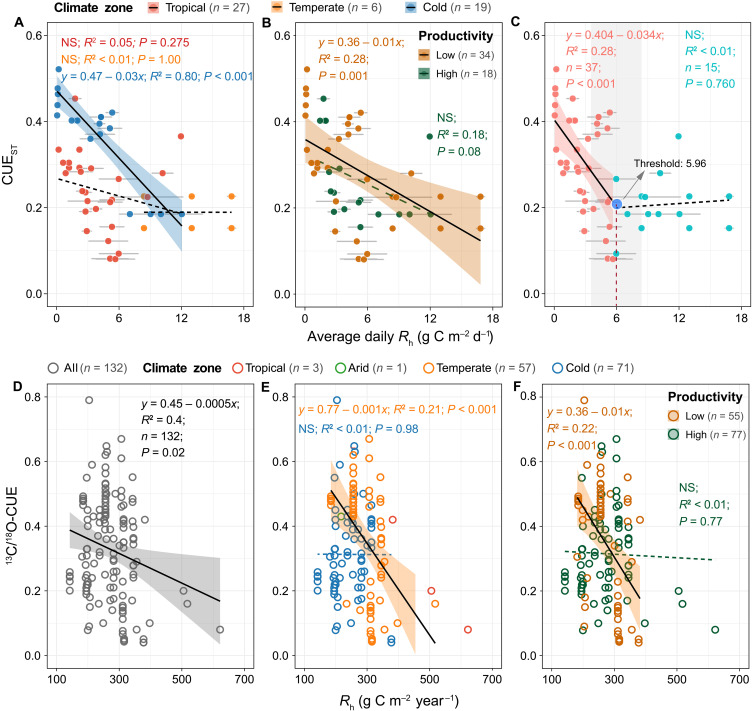 Fig. 3
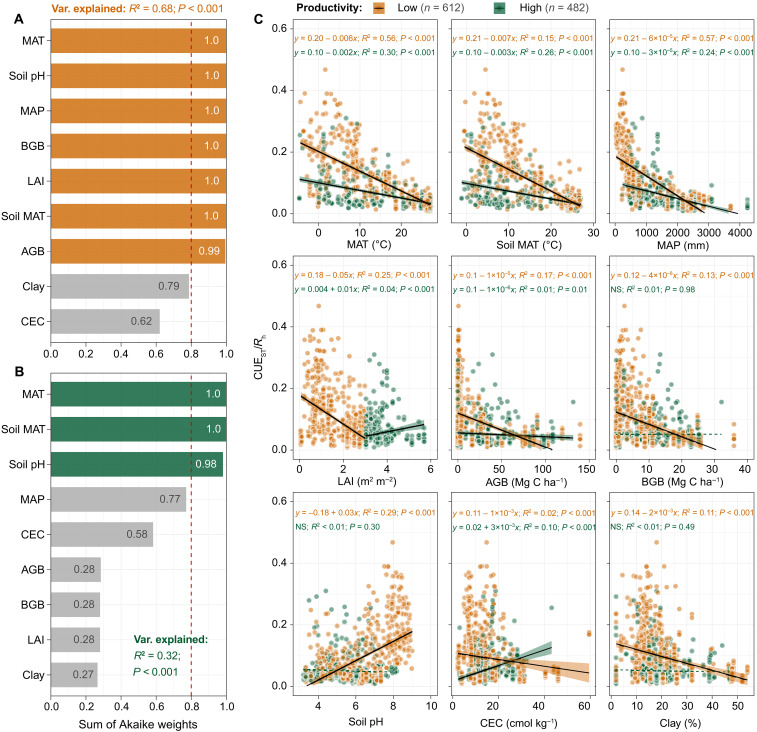 Fig. 4
- —http://dx.doi.org/10.13039/501100001809National Natural Science Foundation of China
- —http://dx.doi.org/10.13039/501100002739Aarhus Universitets Forskningsfond
- —Spanish Government
- —Research Fellowship of the Alexander von Humboldt Foundation
- —MCIN, AEI/10.13039/ 501100011033 European Union Next Generation EU/PRTR
- —European Union grant CONCERTO
- —Danish Independent Research Foundation
- —Open Access funds of Freie Universität Berlin
Peer Reviews
No public reviews on file for this paper yet. If you reviewed it on a platform where reviews are public (OpenReview, ICLR, NeurIPS, ICML), you can paste yours below so the community can read it here.
Videos
No videos yet. Explain this paper in a talk, walkthrough, or lecture? Add one.
Taxonomy
TopicsSoil Carbon and Nitrogen Dynamics · Microbial Community Ecology and Physiology · Soil Geostatistics and Mapping
INTRODUCTION
Soil microbial carbon (C) assimilation and heterotrophic respiration (Rh) are two basic microbial metabolic processes that collectively control organic C retention in soils (1–3). When the total microbial C uptake remains constant, higher assimilation for growth combined with lower Rh indicates more efficient biomass production, which enhances soil organic C retention (4–6). Culture-based studies, from strains to community levels, have shown that microbial growth efficiency is more stable than Rh under changing environmental conditions (7, 8). Recent global assessments further suggest that warming accelerates Rh but does not have a clear or consistent effect on microbial growth (9, 10).
These differential responses imply a decoupling between microbial C assimilation efficiency, commonly described as microbial C use efficiency (CUE), and Rh under specific environmental constraints. This decoupling challenges the long-held assumption that CUE uniformly declines with increasing Rh, even though CUE definitions vary among measurement approaches (2). It may also represent a key source of uncertainty in linking CUE to soil C storage and dynamics (6, 11, 12). Under nutrient-limited conditions, particularly low nitrogen (N) and phosphorus (P) availability, microorganisms may sustain growth by investing in energetically expensive enzyme production and efficient nutrient recycling, which increases C efflux while maintaining biomass production, thereby decoupling CUE from Rh (13, 14). Nevertheless, this potential decoupling has been neither empirically tested across natural ecosystems nor understood in terms of the potential mechanisms involved.
This knowledge gap is likely attributable to three main reasons. First, most existing studies assume a linear negative relationship between CUE and Rh because widely used approaches, such as those based on ^13^C/^14^C-labeled substrates and ^18^O-labeled water, calculate CUE from pulse Rh and thus inherently generate a negative correlation between the two (15–17). However, this approach overlooks mounting evidence for widespread nonlinear relationships in soil C cycling across ecosystems (7, 18). Second, Rh measurements used for estimating CUE are generally conducted on disturbed soils under short-term laboratory incubations, which reflect immediate metabolic responses to added substrates, rather than long-term microbial adaptability (3, 17, 19). Moreover, changes in the availability of one resource (e.g., C) can trigger cascading metabolic responses to other resources through priming effects and nutrient mining (20–22). These processes could obscure trade-offs between microbial C assimilation and the maintenance of stoichiometric homeostasis in natural ecosystems (23). Third, there is a lack of simultaneous, independent measurements of CUE and Rh across a range of natural ecosystems, limiting our ability to assess their relationship across environmental gradients.
To explore the potential decoupling between CUE and Rh, we compiled a global dataset of 1094 paired, independently derived observations of CUE and Rh across natural ecosystems. Specifically, we estimated CUE using a culture-independent stoichiometric model (24), which accounts for microbial enzyme allocation strategies to minimize elemental imbalances between soil resource supply and microbial growth demand. The estimated CUE (“CUE_ST_” hereafter) reflects in situ microbial traits, with higher values indicating more efficient C utilization relative to nutrient acquisition. To obtain corresponding Rh values, we matched the geographic coordinates (latitude and longitude) of each CUE_ST_ observation with average annual Rh (“Rh” hereafter) from the latest global Soil Respiration Database (25), which characterizes long-term patterns of microbial respiration. We hypothesize that CUE_ST_ is negatively correlated with Rh under low C availability (e.g., low plant-derived C inputs), as microorganisms encounter a trade-off between C assimilation and respiratory loss. However, CUE_ST_ and Rh could decouple under low nutrient conditions because of increased C expenditure to acquire and recycle limiting nutrients, particularly N and P, to maintain stoichiometric homeostasis (Fig. 1). To test this hypothesis, we examined the relationship between CUE_ST_ and Rh across global ecosystems (Fig. 2A) and evaluated the environmental drivers with nine variables representing temperature, water, C, and nutrient availability.
Conceptual framework illustrating the possible relationships between microbial CUE and Rh on the basis of stoichiometric theory and microbial community theory.The stoichiometric theory suggests a linear negative relationship between CUE and Rh, as microorganisms respire excess C, e.g., via overflow respiration to maintain their elemental stoichiometric homeostasis, thereby reducing CUE as Rh increases (4, 69). However, the relationship between CUE and Rh may become nonlinear or even decoupled (i.e., no correlation) with increasing resource availability and microbial physiological adaptation. Microbial adaptation tends to stabilize CUE, whereas increasing resource availability, particularly C, can disproportionately elevate Rh (33, 70–72). Note that the specific meaning of CUE depends on the approaches used for its determination; here, it generally refers to the C assimilation efficiency of the microbial community.
Geographic distributions of sample sites and relationships between CUEST and average annual Rh.(A) A total of 1094 observations at 447 sites from 160 studies were collected for estimating CUEST using a stoichiometric-based method and are distributed across nearly all Whittaker biomes and major climatic zones. (B and C) Relationships between CUEST and Rh among climate zones (B) as well as in low-productivity (LAI < 3) and high-productivity (LAI > 3) ecosystems (C) were identified using generalized linear models. The shaded area is the 97.5% confidence interval of the linear regressions. All continuous lines are significant at P < 0.05, whereas dashed lines are not significant (NS; P > 0.05). (D) CUEST decoupled from Rh when Rh > 340 ± 10.8 g C m−2 year−1. The threshold of Rh was estimated using piecewise regression analyses (see table S5 for detailed results), and the relationships between CUEST and Rh before and after this threshold were identified using generalized linear models. The blue circle indicates the threshold of Rh, and the shaded area is the 97.5% confidence interval of the threshold. The solid black lines indicate model fits between CUEST and Rh (P < 0.05).
RESULTS
Relationships between CUE and Rh at a global scale
We found that the relationship between CUE_ST_ and Rh varied across climatic zones and productivity levels. In arid and cold zones, CUE_ST_ declined significantly with increasing Rh (P < 0.001; Fig. 2B), whereas in tropical and temperate zones, it remained stable at a relatively low level (0.27 ± 0.11; P > 0.05). Because the shift in CUE_ST_-Rh relationships across climate zones appeared to be strongly linked to ecosystem productivity, we categorized sites into low-productivity [leaf area index (LAI) < 3] and high-productivity (LAI > 3) ecosystems on the basis of the observed LAI range of 0.06 to 5.69 across sites. In low-productivity ecosystems, CUE_ST_ was negatively correlated with Rh (n = 612, R^2^ = 0.29, P < 0.001; Fig. 2C), whereas this relationship was absent in high-productivity ecosystems (n = 482, R^2^ < 0.01, P = 0.20). We further identified a global threshold of Rh at 340 ± 10.8 g C m^−2^ year^−1^ (Fig. 3D and table S5). Below this threshold, CUE_ST_ declined significantly with increasing Rh (n = 361, R^2^ = 0.23, P < 0.001); above it, no significant correlation was detected (n = 733, R^2^ < 0.01, P = 0.53).
Relationships between CUEST and average daily Rh or between 13C/18O-CUE and average annual Rh across global soils.(A and B) Relationships between CUEST and average daily Rh among climatic zones (or in low- and high-productivity ecosystems) were identified using generalized linear models. The shaded area is the 97.5% confidence interval of the linear regressions. All continuous lines are significant at P < 0.05, whereas dashed lines are not significant (P > 0.05). (C) CUEST decoupled with average daily Rh when the average daily Rh was larger than the threshold of 5.96 ± 1.44 g C m−2 day−1. The threshold of average daily Rh was estimated using piecewise regression analyses (see table S6 for detailed results), and the relationships between CUEST and average daily Rh before and after this threshold of average daily Rh were identified using generalized linear models. The blue circle indicates the threshold of average daily Rh, and the shaded area is the 97.5% confidence interval of the threshold. The solid black lines indicate model fits between CUEST and average daily Rh (P < 0.05). In (A) to (C), the gray line through each data point represents the standard deviation of the mean of average daily Rh. (D to F) Relationships between 13C/18O-CUE and Rh among climatic zones (or in low- and high-productivity ecosystems) were identified using generalized linear models. Note that (i) no matching data of CUEST with average daily Rh were collected in the arid zone; (ii) we also did not fit the relationships between 13C/18O-CUE and Rh for the tropical and arid zones in (E) because of the small number of observations, (iii) no threshold of Rh was identified in the relationship between 13C/18O-CUE and Rh using piecewise regression analyses.
Further support for decoupling between CUE and Rh was provided by two additional independent datasets: average daily Rh (n = 52) and ^13^C/^18^O-measured CUE (n = 132) (Fig. 3 and fig. S7). First, CUE_ST_ was uncorrelated with average daily Rh in tropical and temperate zones (P > 0.05; Fig. 3A) but decreased significantly with average daily Rh in the cold zone (R^2^ = 0.80, P < 0.001). Along a productivity gradient, a negative relationship was observed in low-productivity ecosystems (R^2^ = 0.28, P = 0.001; Fig. 3B), whereas no significant correlation was found in high-productivity ones (P = 0.08). Across all sites, we identified a threshold of average daily Rh at 6.0 ± 1.4 g C m^−2^ day^−1^ (Fig. 3C and table S7): Below this threshold, CUE_ST_ declined significantly with average daily Rh (R^2^ = 0.28, P < 0.001); above it, the relationship was not significant (P = 0.76). Note that this daily Rh threshold (equivalent to ~2190 g C m^−2^ year^−1^ when multiplied by 365 days) is about 6.4 times higher than the annual Rh threshold described above (340 g C m^−2^ year^−1^). This discrepancy is expected given that daily rates are usually measured during the growing season, whereas average annual values integrate fluxes across the entire year. Second, using the ^13^C/^18^O-CUE dataset, we found a weak but significant negative correlation of ^13^C/^18^O-CUE with Rh across all sites (P = 0.02; Fig. 3D). Regionally, ^13^C/^18^O-CUE declined with Rh in the temperate zone (R^2^ = 0.21, P < 0.001; Fig. 3E) but was decoupled in the cold zone (P = 0.98). A negative relationship was also observed in low-productivity ecosystems (R^2^ = 0.22, P < 0.001; Fig. 3F), whereas no significant relationship was found in high-productivity ecosystems (P = 0.77).
Environmental drivers of the relationships between CUE and Rh
We used nine variables that represent the four fundamental controls (i.e., temperature, water, C, and nutrients) for microbial metabolism to further explore the environmental drivers underlying the relationship between CUE and Rh (Fig. 4). We expressed this relationship as the ratio of CUE_ST_ to Rh (hereafter “CUE_ST_/Rh”), which reflects their relative changes across environmental gradients. A mixed-effects model selection analysis identified that these nine variables explain 68% of the variation in CUE_ST_/Rh in low-productivity ecosystems, with seven of the nine variables, spanning all four basic controls, exerting significant effects (P < 0.001; Fig. 4A). In contrast, the nine variables explained only 32% of the variation in high-productivity ecosystems, with only three (related to temperature and nutrients) showing significant effects (P < 0.001; Fig. 4B). Generalized linear models further confirmed that nearly all nine variables had stronger effects (i.e., higher R^2^ values) on CUE_ST_/Rh in low-productivity ecosystems compared to high-productivity ones (Fig. 4C). These results suggest that in low-productivity ecosystems, CUE_ST_-Rh relationships are shaped by a broad suite of environmental factors, whereas in high-productivity ecosystems, they are primarily governed by temperature and nutrient availability.
Effects of environmental factors on the relative change of CUEST versus average annual Rh in low- and high-productivity ecosystems.(A and B) The analysis of mixed-effects model selection was used to evaluate the relative importance of these variables affecting CUEST/Rh. Values of the sum of Akaike weights were estimated on the basis of corrected Akaike’s information criteria. A threshold value of 0.8 (red dashed line) was set to identify the most important variables. (C) The effects of these environmental variables on CUEST/Rh in low- and high-productivity ecosystems were also evaluated using generalized linear models. The shaded area is the 97.5% confidence interval of the linear regressions. All continuous lines are significant at P < 0.05, whereas dashed lines are not significant (P > 0.05). The relative change of CUEST versus Rh is expressed by the CUEST:Rh ratio (CUEST/Rh). Clay, soil clay content.
To better understand these patterns across climate zones, we focused on four key indicators [i.e., mean annual soil temperature (soil MAT), mean annual precipitation (MAP), LAI, and soil pH], each representing one of the four basic controls. These factors varied significantly across climatic zones (P < 0.001; fig. S11). Among them, soil pH exerted the strongest influence on CUE_ST_/Rh in tropical and temperate zones, while MAP and LAI were the most influential in arid and cold zones, respectively (fig. S12). Furthermore, multiple statistical analyses consistently showed that LAI, soil MAT, and MAP were the lowest in arid and cold zones, where they had strong negative effects on CUE_ST_ but strong positive effects on Rh (figs. S13 to S15). These contrasting influences likely contributed to the negative CUE_ST_-Rh relationships observed in these zones (fig. S16). In contrast, in tropical and temperate zones, soil pH had the greatest positive effect on CUE_ST_, while soil MAT and MAP continued to enhance Rh (figs. S13 to S15). This divergence in environmental drivers likely underpins the decoupling of CUE_ST_ and Rh in tropical and temperate regions (fig. S16).
DISCUSSION
As expected from traditional viewpoints, we found a negative relationship between CUE and Rh, a pattern that primarily occurred in low-productivity arid and cold regions (Fig. 2). This pattern likely arises from a microbial trade-off between C assimilation and respiratory loss under limited plant-derived C inputs. In an environment with limited bioavailable C, microorganisms prioritize C allocation to anabolic processes over respiration (20, 26), resulting in higher CUE relative to Rh. In addition, low temperatures and/or limited water availability in less productive ecosystems (fig. S11) suppress microbial metabolic rates, leading to a low Rh (27). These environmental constraints on water, temperature, and C tightly couple CUE with Rh in low-productivity ecosystems, likely contributing to the observed negative relationship.
Conversely, in high-productivity ecosystems, the decoupling between CUE and Rh (Fig. 3) supported our hypothesis that CUE does not continuously decline with increasing Rh under relatively high C inputs with low nutrient availability (i.e., generally high C:N:P ratios in substrates) (Fig. 1). High-productivity ecosystems, particularly in tropical regions, often experience strong P limitation (28–30) because of intense weathering, nutrient leaching, and high biotic demand (31, 32). Despite these limitations, microbial communities appear capable of maintaining stoichiometric homeostasis for survival and growth. Long-term environmental filtering and adaptation may allow microorganisms to physiologically acclimate to nutrient scarcity (33–35). Two key mechanisms likely underpin the observed stability of CUE in high-production environments. First, microorganisms invest C and energy producing extracellular enzymes to acquire limiting nutrients (24), a process especially prevalent in tropical soils with high phosphatase activity (29, 36, 37). Second, microorganisms can exhibit high efficiency in recycling nutrients relative to C (14), preserving nutrients for growth while incurring losses of C and energy. These mechanisms help stabilize CUE at a relatively low level, even as Rh increases under sufficient temperature, water, and C conditions.
This shift in the CUE-Rh relationship along a productivity gradient carries important implications for soil C retention. In low-productivity ecosystems, high CUE coupled with low Rh (Fig. 2) suggests a strategy of maximizing C assimilation under limited C inputs, thereby enhancing microbial retention of plant-derived C despite low primary productivity. This finding aligns with decomposition model simulations indicating greater plant-to-soil C transfer efficiency in less productive ecosystems (38). In contrast, in high-productivity ecosystems, the decoupling of CUE from Rh (Fig. 2) implies that microorganisms invest excess C to acquire limiting nutrients, consistent with the frameworks of microbial stoichiometric homeostasis and nutrient mineralization (39, 40). This strategy lowers the retention efficiency of plant-derived C in microbial biomass, leading to higher CO_2_ release through Rh given high C inputs coupled with limiting nutrient availability.
Our results also suggest divergent trajectories of microbial C retention under various environmental changes. In low-productivity ecosystems (e.g., arid and cold regions), increased primary productivity due to CO_2_ fertilization, warming, or enhanced precipitation (41–43) could disrupt the current CUE-Rh coupling. Increased plant C inputs may simultaneously raise Rh and reduce CUE, amplifying soil C efflux. Thus, vegetation greening in these regions (41, 44) could paradoxically accelerate soil C losses. In contrast, high-productivity ecosystems (e.g., tropical and temperate regions) may show more stable soil C retention because of decoupling between CUE and Rh, regardless of changes in productivity. However, exogenous nutrient inputs such as atmospheric N and P deposition may alter this pattern. The historically low and stable CUE in high-productivity ecosystems could increase if nutrient limitations are alleviated, independent of changes in Rh (45, 46). Rising atmospheric N and P deposition is enhancing soil nutrient availability, particularly in low-latitude regions (47, 48), potentially boosting soil C sequestration in tropical and temperate ecosystems.
While our findings advance the understanding of microbial controls on soil C cycling, several uncertainties remain. First, we used Rh observations on the basis of geographic coordinates corresponding to our estimated CUE_ST_ to explore their relationships without accounting for fine-scale spatial and temporal mismatches. Such mismatches could obscure the relationships between microbial C use and respiration, although our sensitivity test still supports the results (figs. S2 and S3). We also acknowledge a potential mismatch in units between the parameters of CUE_ST_ (mass-based) and Rh (area-based), which could affect the relationship between CUE_ST_ and Rh. However, when Rh was converted from g C m^−2^ year^−1^ to g C kg^−1^ year^−1^ using soil bulk density, the observed patterns remained consistent (figs. S5 and S6 and table S5). Second, the uneven distribution of paired observations in our study may have also biased the relationships between CUE_ST_ and Rh. CUE_ST_ observations were mainly from China, Europe, and the Americas, with fewer observations from Africa and Russia (Fig. 2A). Further expanding the dataset would therefore be valuable for enhancing the robustness and applicability of the findings. Third, the use of soil pH, cation-exchange capacity (CEC), and clay content as proxies for nutrient availability introduces uncertainty. For example, soil pH differentially influences N and P availability (49) and can also affect microbial physiology (50–52). Last, although N and P are expected to be primarily limiting in temperate and tropical ecosystems, respectively (28–30), our analysis did not distinguish between their roles. Future research should aim at simultaneously and independently measuring microbial growth and Rh across temporal and spatial gradients, incorporating direct measures of particular nutrient status. Manipulative isotope-based experiments may also help clarify the trade-off between microbial C assimilation and efflux under resource constraints.
In summary, our study reveals unexpected and contrasting relationships between CUE and Rh across productivity gradients, supported by multiple lines of evidence, including independent datasets of average daily Rh and ^13^C/^18^O-derived CUE. In low-productivity ecosystems, the coupling between CUE and Rh reflects a microbial strategy of prioritizing C assimilation. In contrast, the decoupling observed in high-productivity ecosystems indicates a shift toward nutrient acquisition and the maintenance of stoichiometric homeostasis. These findings imply a limited potential for natural ecosystems to serve as effective soil C sinks under global change (e.g., vegetation greening) and underscore the importance of incorporating microbial metabolic adaptability into future mechanistic assessments of soil C dynamics.
METHODS
Data collection
Global data of model parameters for estimating CUEST
We compiled a global database of ecoenzymatic activities, microbial biomass, and soil nutrient concentrations in surface soils (mean depth of 11 cm) from a survey of the literature using the Web of Science (http://isiknowledge.com) and the Google Scholar Resource Integrated Database (https://scholar.google.com). Combinations of keywords including “extracellular enzyme,” “exoenzyme,” “ecoenzyme,” “threshold element ratio,” “microbial C use efficiency,” and “enzyme stoichiometry models” were used to search studies published from 1980 to 2022. The criteria for inclusion were as follows: (i) The studies included the activities of C-, N-, and P-acquiring enzymes [β-1, 4-glucosidase (BG), β-1, 4-N-acetylglucosaminidase (NAG), l-leucine aminopeptidase (LAP), and acid or alkaline phosphatase (AP)] (table S1); the concentrations of microbial biomass C, N, and P; and the concentrations of soil C [soil organic C (SOC)], N [total N (TN)], and P [total P (TP)], because these indicators are necessary parameters in the stoichiometric model of CUE_ST_ (24); (ii) the activities of extracellular enzymes were measured fluorometrically using a 200 μM solution of substrates labeled with 4-methylumbelliferone or 7-amino-4-methylcoumarin; (iii) microbial biomass was determined using chloroform fumigation-extraction; and (iv) data from intensively managed ecosystems (e.g., agroforests, fertilized plantations, sown pastures, croplands, and urban forests) were excluded to avoid influences from anthropogenic disturbances.
On the basis of these criteria, we selected 1094 paired observations across global terrestrial soils at 477 geographic locations from 160 articles (Fig. 2A). The data were extracted from tables or figures of the selected studies using GetData Graph Digitizer software version 2.25. We also recorded corresponding information on site location (longitude and latitude) from the literature. A PRISMA (Preferred Reporting Items for Systematic Reviews and Meta-Analyses) flow diagram (fig. S1) shows the procedure we used for selecting the studies. The dataset was also used by Cui et al. (53); the present study extends it by pairing each CUE_ST_ with Rh and conducts new analyses.
Global dataset of Rh
We extracted Rh values from the Soil Respiration Database (version 5.0; https://daac.ornl.gov/cgi-bin/dsviewer.pl?ds_id=1827) contributed by Jian et al. (25). A total of 1094 predictions of Rh were exactly matched to the sampling site coordinates of CUE_ST_ via raster data of Rh. In spite of exact matches in spatial coordinates of sampling sites between CUE_ST_ and Rh, we did not consider the differences in sampling time. However, given that all the sampling sites were from natural ecosystems without anthropogenic nutrient inputs or other major disturbance, the CUE_ST_ and Rh represent long-term adaptions of microbial communities to the environments in specific ecosystems. These facts should substantially reduce uncertainties in our results caused by mismatches in sampling or measurement times. We also considered that differences in the units of Rh may alter the relationship between CUE_ST_ and Rh, so we converted the units from g C m^−2^ year^−1^ to g C kg^−1^ year^−1^ via soil bulk density
where BD is the soil bulk density (table S10; g cm^−3^), and h is the soil depth (m). We defaulted h to 0.1 m because the mean soil depth was 0.114 m for the 1094 observations (53).
We found that values of mass-based Rh (g C kg^−1^ year^−1^) were highly correlated with values of area-based Rh (g C m^−2^ year^−1^) (P < 0.001, R^2^ = 0.89; fig. S5), generating consistent patterns between CUE_ST_ and Rh under both Rh units (Fig. 3 and fig. S6). To minimize the errors caused by uncertainties in soil bulk density and sampling depth during unit conversions, we used the original unit of Rh (g C m^−2^ year^−1^) instead of converting it to g C kg^−1^ year^−1^ in subsequent analysis.
In addition, we collected 52 observations of average daily Rh from the 160 selected articles (fig. S7). This means that these studies included all parameters for estimating CUE_ST_ and measured average daily Rh simultaneously, thus ensuring an exact match between observations of average daily Rh and CUE_ST_ on both temporal and spatial scales.
Environmental variables
To identify the environmental drivers underlying the relationships between CUE_ST_ and Rh, we examined nine variables representing the four basic factors essential to microbial metabolism: temperature, water, C, and nutrients (27, 54, 55). Specifically, we used mean annual air temperature (MAT) and soil MAT for temperature; MAP for water; LAI, aboveground biomass (AGB), and belowground biomass (BGB) for C; and soil pH, CEC, and clay content as proxies for nutrient availability. In particular, we chose these nutrient-related variables instead of direct soil N and P indicators to avoid collinearity, as soil C, N, and P concentrations are already embedded in the stoichiometric model used to estimate CUE_ST_ (see the “Theoretical basis of the stoichiometric model” section). We retrieved MAT, soil MAT, MAP, LAI, AGB, BGB, CEC, and clay content from multiple sources at a relatively fine spatial resolution (see table S10 for details). In particular, soil pH observations were compiled primarily from the 160 screened studies, which almost always reported soil pH. Only 16 studies did not include soil pH, and we extracted these missing values (n = 82) from other recently published studies with the same sample site information and similar geographic coordinates.
Among the nine variables, we further chose four of them (soil temperature, MAP, LAI, and soil pH) as the key indicators representing temperature, water, C, and nutrients, respectively, to explore the specific effects of the four kinds of basic controls on CUE_ST_ and Rh. We choose soil MAT rather than MAT because soil temperatures are generally less variable than atmospheric temperatures (56). We used LAI as the key index of C availability for two reasons. First, almost all C sources in surface soil originally come from plant production, especially plant litter inputs. Second, plant litter rather than soil organic matter that has been processed by microorganisms is the dominant C source for microbial acquisition (57). Among three proxies of nutrient availability (soil pH, CEC, and clay content), soil pH is a basic regulator of the availabilities of N and P and indirectly represents their supplies (58, 59). We thus adopted it as an indicator of the availabilities of soil N and P.
Estimating CUEST using the stoichiometric model
Theoretical basis of the stoichiometric model
Sinsabaugh and Follstad Shah (24) proposed a biogeochemical-equilibrium model that incorporated ecoenzymatic activities, microbial biomass, and soil resources to estimate CUE_ST_ at the community level. The basis of this stoichiometric approach is using selected ecoenzymatic activities to represent the requirements of microbial resources. Specifically, soil microorganisms synthesize and excrete a series of ecoenzymes (table S1) that degrade organic macromolecules into available substrates (e.g., oligo- and monomers) for microbial assimilation. The profile of ecoenzymatic activity therefore represents the relative microbial acquisition of C, N, and P resources from polymers that balance microbial stoichiometry, given the efficiencies of assimilating elements and resource availability (24). Many ecoenzymes contribute to the catabolism of complex polymers (e.g., cellulose), but only a few (i.e., BG, NAG and/or LAP, and AP) catalyze the terminal reactions of the most common substrates and produce soluble products for microbial assimilation. These ecoenzymes thus define the functional interface between product release and acquisition (60). They usually have the highest activities per unit microbial biomass and are strongly associated with litter decay and microbial metabolism (61). As a result, they are commonly selected as the proximate agents for the acquisition of microbial nutrients during metabolism (13, 24).
Estimating CUEST
In detail, we estimated CUE_ST_ using the following equations (24)
where and are scalars that represent the extent to which the allocation of extracellular enzyme activity (EEA) offsets the disparity between the elemental composition of available resources and the composition of microbial biomass. In this case, and were calculated as BG/(NAG + LAP) and BG/AP, respectively. Furthermore, LC:N and LC:P were estimated as molar ratios of SOC:TN and SOC:TP, respectively, and BC:N and BC:P were calculated as molar ratios of MBC (microbial biomass C):MBN (microbial biomass N) and MBC:MBP (microbial biomass P), respectively. Both and are half-saturation constants for CUE_ST_ based on the availabilities of C, N, and P, assumed to be 0.5 (24). (maximum CUE) is about 0.6 based on metabolic kinetics and energetics (19, 39).
It is worth noting that the enzymatic activities we selected were generally proxies of microbial metabolism using polymeric organic matter (24, 61). Soluble resources not requiring enzymatic catalysis for acquisition could potentially skew our estimates (3, 62). We thus only retained observations of surface soils from natural ecosystems, where the original dominant nutrient pools should be polymer-rich organic matter from plant litter (63). This filtering could minimize uncertainties introduced by soluble resources such as rhizodeposition and fertilizers.
Dataset of 13C/18O-based CUE for global natural ecosystems
For verifying the results relevant to CUE_ST_, we also considered the results of CUE independently measured by the isotope-based approaches. We obtained a dataset of ^13^C/^18^O-CUE at a global scale (fig. S7) from a recent study based on the meta-analysis (6). This study collected 132 observations of ^13^C/^18^O-CUE measured at 46 locations from 16 publications. In cases of manipulation experiments (for example, fertilization experiments), only data from control plots was included. Therefore, the dataset only represents an investigation of CUE in natural ecosystems.
Statistical analyses
The locations of these sample sites for CUE_ST_, Rh, and ^13^C/^18^O-CUE were divided into four climatic zones (tropical, temperate, arid, and cold zones) on the basis of the global Köppen-Geiger grid map of climatic classification (64). We identified the relationships between CUE_ST_ (or ^13^C/^18^O-CUE) and Rh (or average daily Rh) among climate zones and between low-productivity (LAI < 3) and high-productivity (LAI > 3) ecosystems using generalized linear models (Figs. 2 to 4). We also determined the patterns of decoupling between CUE_ST_ and Rh (or average daily Rh) at the global scale by first identifying their decoupling thresholds from a piecewise linear-regression analysis (Figs. 2C and 3C, fig. S6, and tables S4 to S6). The regression relationships between CUE_ST_ and Rh (or average daily Rh) were fitted with linear models using the “segmented” (version 2.1-3) R package (65). The confidence intervals of the thresholds were calculated using 1000 bootstrap samples and the “SiZer” (version 0.1-8) R package (66). In addition, we tested three nonlinear functions (exponential, logarithmic, and quadratic) for the relationships of CUE_ST_ versus Rh (fig. S4) and CUE_ST_ versus average daily Rh (fig. S8), fitted separately within low- and high-productivity ecosystems. These analyses corroborate the productivity-dependent relationships between CUE_ST_ and Rh: robust negative associations in low-productivity ecosystems and weak or near-zero relationships in high-productivity ecosystems.
To gauge bias from coordinate-based pairing, we ran a stratified random-removal sensitivity test using the “tidyverse” (version 2.0.0) and “broom” (version 1.0.7) R packages: We repeatedly removed 20% of CUE_ST_-Rh pairs within climatic zones and separately within productivity classes and reidentified slopes of regressions between CUE_ST_ and Rh. The negative relationship persisted in arid and cold zones or in low-productivity ecosystems and remained weak or indistinguishable from zero in temperate and tropical zones or in high-productivity ecosystems (figs. S2 and S3 and tables S2 and S3), indicating that our conclusions are robust to plausible mismatching.
We further investigated the effects of resource availabilities on the relationships between CUE_ST_ and Rh for low- and high-productivity ecosystems. First, we examined the distribution of the newly defined variable (CUE_ST_/Rh) with productivity groups by kernel density plots and formal normality tests. Both the plots and test results indicated that CUE_ST_/Rh deviate from normality (Shapiro-Wilk, Lilliefors, and Anderson-Darling, all P < 0.001; fig. S9 and table S7). We therefore further verified robustness with (i) ordinary least squares on log-transformed CUE_ST_/Rh with HC3 robust standard errors and (ii) gamma generalized linear models (log link) using the “lmtest” and “sandwich” (version 3.1-1) R packages (fig. S10 and tables S8 and S9). Second, an analysis of mixed-effects model selection was adopted to identify the most important predictors among the nine environmental variables affecting CUE_ST_/Rh using the “glmulti” (version 1.0.8) R package (67). The model selection was based on maximum-likelihood estimation. The importance of each predictor was calculated as the sum of Akaike weights for models that included this predictor (Fig. 4, A and B, and fig. S12). A cutoff of 0.8 was set to differentiate between essential and nonessential predictors (67). The signs and relative importance patterns of nine environmental variables identified by robustness analysis were consistent with the results of mixed-effects models, which suggests that the analysis of mixed-effects model selection is reasonable and robust. Third, we separately identified the relationships between CUE_ST_/Rh and nine environmental variables for low- and high-productivity ecosystems and for four climate zones using generalized linear models (Fig. 4C and fig. S12).
We also explored possible mechanisms affecting the relationships between CUE_ST_ and Rh by identifying the effects of the four key variables of the nine environmental variables on CUE_ST_ and Rh using multiple statistical analyses. First, a linear mixed-effects model was used to analyze the differences of the four variables among climatic zones (fig. S11). The model was constructed using the “lme” function from the “nlme” (version 3.1-164) R package, with “climatic zone” as the fixed factor and “sampling site” as the random factor. Tukey’s tests were further used to identify the significance of differences in variables among the climatic zones using the “multcompView” (version 0.1-10) R package. Second, the analysis of mixed-effects model selection was adopted to identify the most important predictors among the four key variables affecting CUE_ST_/Rh, CUE_ST_, and Rh separately (figs. S12 and S15). Third, the partial correlation analysis further identified specific relationships between each variable and CUE_ST_ (or Rh) by controlling the other three variables using the “pcor.test” function in the “ppcor” (version 1.1) R package (fig. S13). Fourth, we also used a variation-partitioning analysis to quantify the independent and joint influences of the four key variables on CUE_ST_ with Rh using the “varpart” function in the “vegan” (version 2.6-8) R package (fig. S12). We calculated the relative independent and joint influences of the four variables on CUE_ST_ and Rh to facilitate interpretation
All statistical analyses were performed using R software (version 4.4.2 for the original analyses and version 4.5.1 for the revision) (68).
The reference list from the paper itself. Each links out to its DOI / PubMed record.
- 1Y. Kuzyakov, Sources of CO 2 efflux from soil and review of partitioning methods. Soil Biol. Biochem. 38, 425–448 (2006).
- 2B. Bond-Lamberty, V. L. Bailey, M. Chen, C. M. Gough, R. Vargas, Globally rising soil heterotrophic respiration over recent decades. Nature 560, 80–83 (2018).30068952 10.1038/s 41586-018-0358-x · doi ↗ · pubmed ↗
- 3J. Schimel, M. N. Weintraub, D. L. Moorhead, Estimating microbial carbon use efficiency in soil: Isotope-based and enzyme-based methods measure fundamentally different aspects of microbial resource use. Soil Biol. Biochem. 169, 108677 (2022).
- 4S. Manzoni, P. Taylor, A. Richter, A. Porporato, G. I. Ågren, Environmental and stoichiometric controls on microbial carbon-use efficiency in soils. New Phytol. 196, 79–91 (2012).22924405 10.1111/j.1469-8137.2012.04225.x · doi ↗ · pubmed ↗
- 5M. F. Cotrufo, J. L. Soong, A. J. Horton, E. E. Campbell, M. L. Haddix, D. H. Wall, W. J. Parton, Formation of soil organic matter via biochemical and physical pathways of litter mass loss. Nat. Geosci. 8, 776–779 (2015).
- 6F. Tao, Y. Huang, B. A. Hungate, S. Manzoni, S. D. Frey, M. W. Schmidt, M. Reichstein, N. Carvalhais, P. Ciais, L. Jiang, J. Lehmann, Y. Wang, B. Z. Houlton, B. Ahrens, U. Mishra, G. Hugelius, T. D. Hocking, X. Lu, Z. Shi, K. Viatkin, R. Vargas, Y. Yigini, C. Omuto, A. A. Malik, G. Peralta, R. Cuevas-Corona, L. E. Di Paolo, I. Luotto, C. Liao, Y. Liang, V. S. Saynes, X. Huang, Y. Luo, Microbial carbon use efficiency promotes global soil carbon storage. Nature 618, 981–985 (2023).37225998 10.10 · doi ↗ · pubmed ↗
- 7S. B. Hagerty, K. J. Van Groenigen, S. D. Allison, B. A. Hungate, E. Schwartz, G. W. Koch, R. K. Kolka, P. Dijkstra, Accelerated microbial turnover but constant growth efficiency with warming in soil. Nat. Clim. Change 4, 903–906 (2014).
- 8T. P. Smith, T. Clegg, T. Bell, S. Pawar, Systematic variation in the temperature dependence of bacterial carbon use efficiency. Ecol. Lett. 24, 2123–2133 (2021).34240797 10.1111/ele.13840 · doi ↗ · pubmed ↗