The impact of heat inactivation on RT-per detection of severe acute respiratory syndrome corona virus 2 (SARS-CoV-2): an experience from the University Clinical Centre of Vojvodina, Serbia
Jelena Stojčević Maletić, Iva Barjaktarović, Ljiljana Andrijević, Katarina Bačulov, Slobodanka Bogdanović Vasić, Diandra Pintać Šarac

TL;DR
This study shows that heat inactivation at 56°C for 30 minutes does not significantly affect SARS-CoV-2 detection in most samples but may reduce sensitivity in low viral load cases.
Contribution
The study provides empirical evidence on the impact of heat inactivation on RT-qPCR detection of SARS-CoV-2 in clinical samples.
Findings
Heat inactivation did not significantly affect the overall SARS-CoV-2 detection rate (55.5% vs. 55.0%).
Discrepancies occurred in 15.3% of samples, particularly those with Cq values >31.
Heat inactivation slightly altered Cq values for RdRp, E, and N genes, with significant changes in strongly positive samples.
Abstract
Handling clinical samples from patients suspected of SARS-CoV-2 infection puts healthcare workers at risk of exposure to infectious particles. To reduce this risk, samples are often heat-inactivated before nucleic acid isolation, but this procedure may affect the analytical sensitivity of the test. The aim of this study was therefore to evaluate the effects of heat inactivation (56 °C for 30 min) on RT-qPCR results of samples taken from nasopharyngeal and oropharyngeal (NP/OP) swabs collected from 200 symptomatic patients. Each sample was split into two aliquots – one subjected to heat inactivation and the other stored at 4 °C – followed by nucleic acid isolation and RT-qPCR analysis using the GeneFinder COVID-19 nucleic acid test. Heat inactivation did not significantly affect the overall SARS-CoV-2 detection rate (55.5 % vs. 55.0 % in untreated and heat-treated groups; χ2=0.01;…
Genes, proteins, chemicals, diseases, species, mutations and cell lines named across the full text — each resolved to its canonical identifier and authoritative record.
Click any figure to enlarge with its caption.
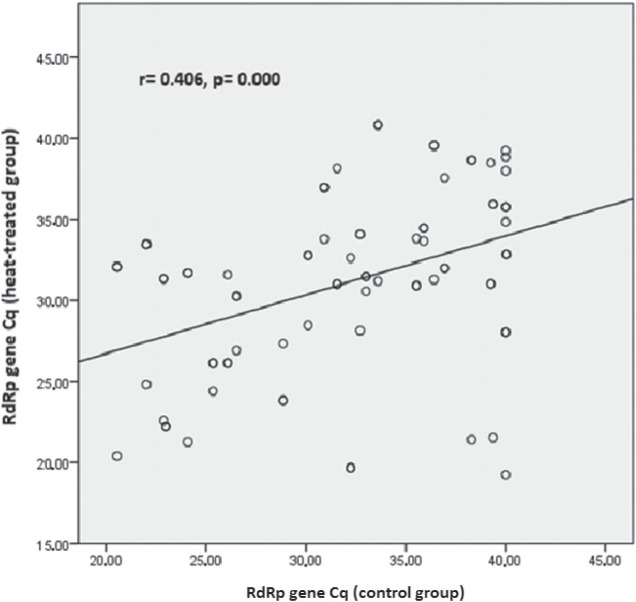 Figure 1
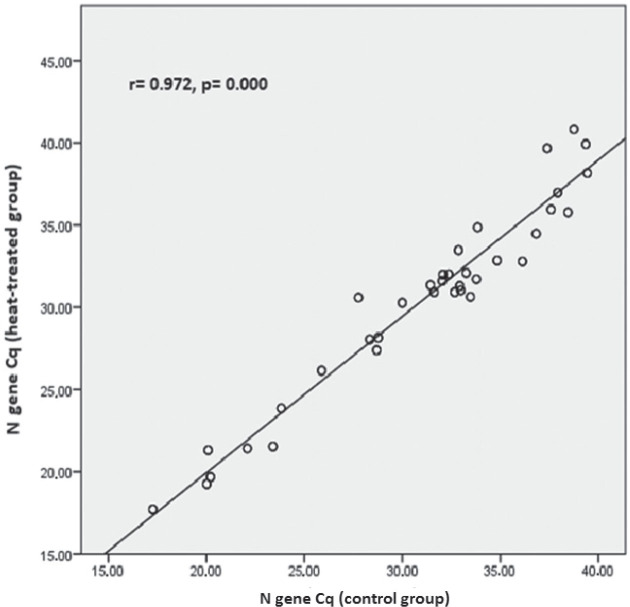 Figure 2
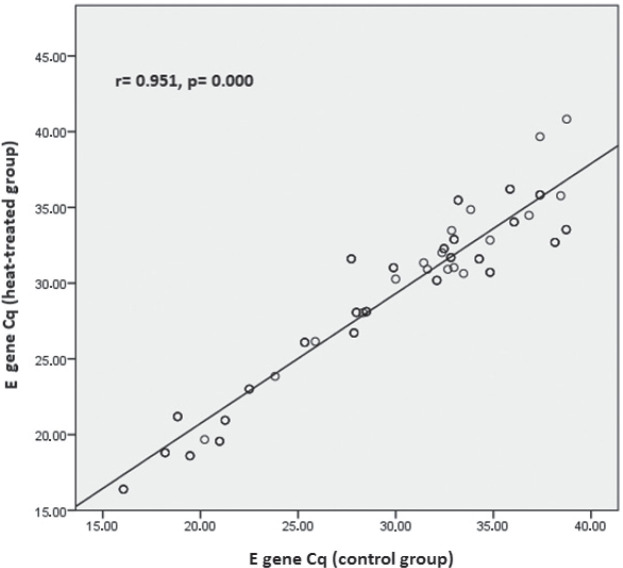 Figure 3
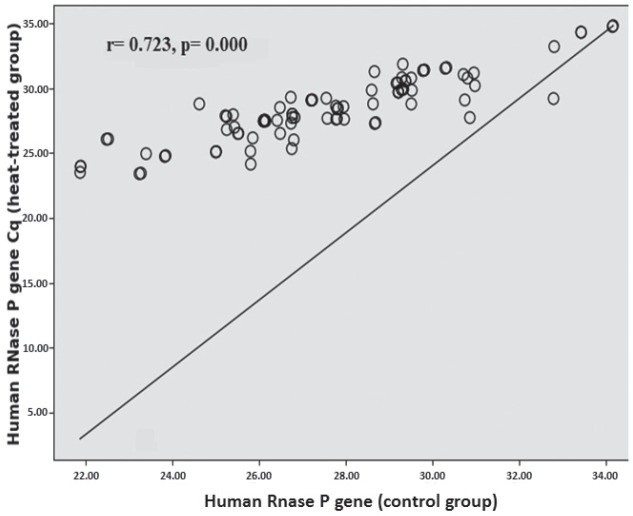 Figure 4
|
|
|
|
|
|
|---|---|---|---|---|
| Control | 66 (59.46) | 18 (16.22) | 12 (10.81) | 15 (13.51) |
| Heat-treated | 63 (57.27) | 25 (22.73) | 4 (3.64) | 18 (16.36) |
|
|
|
| ||||
|---|---|---|---|---|---|---|
|
|
|
|
|
|
| |
| S 018 | Positive (39.37) | Positive (32.86) | Positive (35.50) | Negative | Positive (33.47) | Negative |
| S 023 | Positive (38.29) | Positive (33.25) | Positive (38.73) | Negative | Positive (32.09) | Positive (33.53) |
| S 024 | Negative | Positive (36.13) | Negative | Negative | Positive (32.78) | Positive (34.97) |
| S 028 | Positive (39.76) | Positive (34.92) | Negative | Negative | Negative | Negative |
| S 033 | Negative | Positive (32.93) | Positive (38.15) | Positive (38.00) | Positive (31.29) | Positive (32.69) |
| S 055 | Positive (39.28) | Positive (32.96) | Positive (35.05) | Negative | Positive (33.74) | Negative |
| S 056 | Positive (39.44) | Positive (33.78) | Positive (36.06) | Negative | Positive (31.71) | Positive (34.04) |
| S 060 | Positive (39.56) | Positive (33.54) | Positive (38.39) | Negative | Positive (32.35) | Positive (33.90) |
| S 061 | Positive (39.87) | Positive (34.29) | Negative | Negative | Positive (32.17) | Positive (34.65) |
| S 065 | Negative | Positive (40.0) | Positive (36.29) | Negative | Positive (40.0) | Negative |
| S 068 | Positive (38.71) | Positive (39.44) | Negative | Negative | Positive (38.16) | Negative |
| S 070 | Negative | Positive (32.26) | Positive (38.52) | Positive (37.96) | Positive (31.93) | Positive (32.91) |
| S 092 | Positive (39.63) | Positive (32.63) | Positive (35.96) | Negative | Positive (33.43) | Negative |
| S 096 | Positive (38.59) | Positive (33.73) | Positive (38.54) | Negative | Positive (32.35) | Positive (33.90) |
| S 098 | Negative | Positive (36.29) | Negative | Negative | Positive (32.65) | Positive (34.77) |
| S 102 | Positive (39.92) | Positive (34.18) | Negative | Negative | Positive (40.0) | Negative |
| S 107 | Negative | Positive (32.52) | Positive (38.26) | Positive (37.15) | Positive (31.96) | Positive (32.70) |
|
|
| ||
|---|---|---|---|
|
|
| ||
| human | 27.50 (27.12–27.88) | 0.653 (0.31–0.99) |
|
| human | 28.16 (27.66–28.65) | ||
| 31.19 (29.88–32.50) | –1.04 (−2.17–0.27) |
| |
| 30.15 (28.76–31.54) | |||
| 31.02 (29.90–32.14) | 0.61 (0.33–0.88) |
| |
| 31.22 (30.24–32.19) | |||
| 28.93 (27.57–30.29) | –0.65 (−0.15–1.14) |
| |
| 28.29 (27.16–29.42) | |||
| Weakly positive samples (Cq>33) (n=252) | |||
| 34.70 (34.09–35.31) | 0.11 (−0.60–0.83) | 0.751 | |
| 34.82 (33.91–35.73) | |||
| 34.44 (34.00–34.88) | 0.15 (−0.44–0.75) | 0.612 | |
| 34.59 (33.93–35.25) | |||
| 34.95 (34.32–35.58) | –0.93 (−1.73–0.14) |
| |
| 34.02 (33.39–34.65) | |||
Peer Reviews
No public reviews on file for this paper yet. If you reviewed it on a platform where reviews are public (OpenReview, ICLR, NeurIPS, ICML), you can paste yours below so the community can read it here.
Videos
No videos yet. Explain this paper in a talk, walkthrough, or lecture? Add one.
Taxonomy
TopicsSARS-CoV-2 detection and testing · Infection Control and Ventilation · Biosensors and Analytical Detection
On 11 March 2020, the World Health Organization (WHO) declared the coronavirus disease 2019 (COVID-19) a global pandemic (1, 2). By June 2024, about 776 million cases of SARSCoV-2 infection and seven million deaths had been documented worldwide (3). Laboratory COVID-19 testing was crucial for establishing the incidence of infection as precisely as possible, but due to the limited time window, the WHO forewent serological assays or the nucleic acid amplification tests and instead recommended the use of amplification of viral ribonucleic acid (RNA) by reverse transcription-quantitative real-time polymerase chain reaction (RT-qPCR) as the gold standard for diagnosis (4,5,6,7,8,9). RT-qPCR can identify several genes encoding viral structural proteins, such as the spike (S), envelope (E), membrane (M), and nucleocapsid (N) (10), along with eight accessory proteins. It can also detect the open reading frame-1 (ORF1ab) gene, which encodes non-structural polyproteins which are cleaved to encode 16 non-structural proteins (NSP1–16) responsible for viral transcription and replication, including the RNA-dependent RNA polymerase (RdRp, NSP12) (11, 12).
Guidelines regarding which genes to target for SARS-CoV-2 detection vary worldwide. During the pandemic, the WHO recommended protocols targeting the E gene for initial screening and the RdRp gene for verification (6). The US Centers for Disease Control and Prevention (CDC) reported that the newly developed 2019-nCoV RT-qPCR test targeted multiple regions of the N gene (13). In the developed SARS-CoV-2 RT-qPCR assays, the N gene is the most commonly chosen target alongside ORF1ab, while the S gene is the least frequent target. Given the potential genetic variability of SARS-CoV-2, RT-qPCR assays targeting multiple genomic regions are recommended to improve diagnostic reliability and reduce the likelihood of false-negative results (14).
Considering the risks of infection, molecular testing of clinical specimens must be carried out in a laboratory that meets the minimum biosafety level 2 (BSL-2) requirements (15), and all specimens should undergo their first sample processing in a proper biosafety cabinet, but since such cabinets may not be available in specific situations, the alternative to go forward with RNA isolation is to inactivate the SARS-CoV-2 virus beforehand to prevent COVID-19 transmission among medical staff. There are several and physical (16, 17) and chemical (18, 19) ways to inactivate SARSCoV-2, and heat is the most common choice at varying temperatures and timings, such as 56 °C for 30 min, 60 °C for 60 min, 92 °C for 15 min, 80 °C for 5 min, or 100 °C for 1 min (20,21,22).
However, heat treatment may degrade viral RNA and result in false-negative findings (23). The aim of this study was to look further into this issue by assessing how exactly heat inactivation affects the detection of SARS-CoV-2 in the hope that our findings could inform future research and inactivation approaches prior to nucleic acid isolation for COVID-19 testing.
MATERIALS AND METHODS
For this purpose we collected 200 clinical specimens from 200 randomly selected adult patients suspected of COVID-19 who were hospitalised at the University Clinical Centre of Vojvodina (UCCV) in Novi Sad, Serbia between 11 and 19 November 2023. The study was approved beforehand by the hospital’s Ethics Committee on 24 February 2023 (approval No. 00-51).
We took one nasopharyngeal (NP) and one oropharyngeal (OP) swab from each patient and placed them in the same tube with 3 mL of viral transport medium treated with antibiotics and antifungal agents (Cat. No. SL901B, Lot No. 200405, SANLI Medical Technology Development Co., Liuyang, Hunan, China). In other words, each patient gave one combined NP/OP sample. Samples were then transported to the UCCV Virology Laboratory, and the tertiary containers in which they were transported opened under the BSL-2 conditions, in accordance with the WHO standards (24).
A 1000 µL NP/OP sample was divided into two sterilised cryogenic tubes. One 500 µL aliquot was heat-treated at 56 °C for 30 min in a thermoblock (ThermoMixer^™^ F1.5, Eppendorf, Hamburg, Germany) and then stored at 4 °C until analysis, while the second, control aliquot was not heated but only stored at 4 °C. Every further step, including isolation and master mixing, was identical and followed the standard operating procedure to minimise variables that could affect the results. Within 12 h of collection, all 200 NP/OP samples (200 in the heat-treated batch and 200 in the matching control batch) were tested in duplicate (two technical replicates) as described below.
RNA isolation and RT-qPCR analysis
Viral RNA was isolated using the GeneRotex 96 Nucleic Acid Extractor (Xi’an Tianlong Science and Technology Co., Ltd., Xi’an City, China) in combination with the Viral DNA and RNA Extraction Kit (Cat. No. T014H, Lot No. 23081710T014H, Xi’an Tianlong Science and Technology) following the manufacturer’s instructions (25). The isolation procedure is based on magnetic bead technology, which enables adsorption, transfer, and release of nucleic acids, combined with a proprietary buffer system for lysis, binding, washing, and elution. A 200-μL aliquot of viral transport medium was processed per sample, and nucleic acids were eluted in 80 μL of elution buffer. The isolated RNA showed sufficient purity and yield for downstream RT-qPCR analysis, as confirmed by successful amplification of the internal control (IC) gene. According to the manufacturer’s specifications, this extraction kit allows recovery of viral DNA from samples containing more than 10 IU/mL and viral RNA from samples containing more than 30 IU/mL (25).
Preparation of reaction mixtures, amplification, and detection were performed on a Gentier 96E RT-qPCR system (Xi’an Tianlong Science and Technology) using the GeneFinder^™^ COVID-19 Plus RealAmp kit (Cat. No. IFMR-45, Lot No. 2006-R, OSANG Healthcare Co., Ltd., Anyang, Korea) and following the manufacturer’s instructions (26). Each 20 µL reaction mixture contained 10 µL of COVID-19 Plus Reaction Mixture (including Taq DNA polymerase, reverse transcriptase, dNTPs, Tris-HCl, and MgCl_2_), 5 µL of COVID-19 Plus Probe Mixture (specific primer pairs and probes for amplification and detection of each target), and 5 µL of isolated RNA. Thermal cycling conditions included reverse transcription at 50 °C for 20 min, followed by pre-denaturation at 95 °C for 5 min, 45 cycles of denaturation at 95 °C for 15 s, and another 45 cycles of annealing/extension at 58 °C for 60 s.
Real-time detection targeted three SARS-CoV-2 genes, namely RdRp, E, and N, while human RNase P gene served as IC for sample adequacy and isolation efficiency. Carboxylfluorescein (FAM) signals were recorded for the RdRp gene, 4,5-dichloro-dimethoxyfluorescein/2′-chloro-7′-phenyl-1,4-dichloro-6-carboxyfluorescein (JOE/VIC) signals for the N gene, sulforhodamine 101 acid chloride (Texas Red) signals for the E gene, and cyanine 5 (Cy5) signals for the human RNase P gene, and their quantification cycle (Cq) values automatically recorded by the instrument’s software.
A sample was considered positive for SARS-CoV-2 if at least one of the viral target channels (FAM, JOE/VIC, or Texas Red) yielded a sigmoidal amplification curve with Cq≤40, regardless of whether IC amplification confirmed it (Cq≤40) or not (IC Cq>40). A sample was regarded negative if no amplification of the target gene was detected, even though IC was successfully amplified. The results were deemed invalid if neither the targets nor IC were amplified, indicating possible isolation failure, PCR inhibition, or poor sample quality. Such samples were re-isolated and retested.
The GeneFinder kit includes three controls – positive (PC), negative (NC), and IC – to verify the performance of reagents and assay procedures. Positive and negative controls are included in each RT-qPCR run to confirm amplification efficiency and to monitor potential contamination. The positive control contains four non-infectious DNA plasmids encoding the RdRp, E, N, and RNase P genes and must produce a sigmoidal amplification curve in the FAM, Texas Red, JOE/VIC, and Cy5 channels at Cq values ≤22 for the RdRp, E, and N genes, and Cq≤21 for RNase P (IC). The negative control, which is diethyl pyrocarbonate (DEPC)-treated water, should show no amplification curve in any of the channels (no Cq or Cq>40).
Statistical analysis
All data were analysed using the IBM^®^ SPSS Statistics version 23.0 (IBM SPSS Inc., Armonk, NY, USA). Cq values were compared between the heat-treated and control batches of samples with the McNemar’s chi-squared test and Pearson correlation coefficient. Considering that the data were distributed normally, we used the paired t-test to determine mean differences in Cq values between the two batches. A p-value <0.05 was considered statistically significant.
RESULTS
Overall, 111 (55.50 %) control and 110 (55.00 %) heat-treated samples tested positive. Table 1 shows the distribution of SARSCoV-2 gene positivity patterns. Positive tests to all three genes dominated in both control and the heated batches, but 17 (15.30 %) samples showed different test results for target genes, all with Cq values >31 (Table 2). These included seven samples (6.30 %) that lost one or more positive target genes after heat treatment, one sample (S 028; 0.90 %) that became completely negative after heat treatment, and three (2.70 %) samples that gained a positive target gene after heat treatment.
The McNemar chi-squared test showed no significant difference in the proportion of positive and negative results between the matching heated and control batches (χ^2^=0.01, p=0.91).
However, heat inactivation did affect Cq values of the target genes (Table 3). In the strongly positive subgroup (Cq≤33), heat treatment slightly lowered the mean Cq of the RdRp and E genes, while the mean Cq of the N gene was significantly higher than in the control samples.
In addition, heat treatment in positive samples (Cq≤40) affected the Cq values for the human RNase P gene, which were significantly higher than in the control batch.
In the weakly positive subgroup (Cq>33), only the E gene had significantly lower Cq values (p=0.020) than control. In addition, in the strongly positive subgroup correlation analysis revealed moderate correlation between heat-treated and control samples for RdRp (r=0.406; p=0.000) (Figure 1) and a very strong correlation for the N and E genes (r=0.972; p=0.000 and r=0.951; p=0.000, respectively) (Figures 2 and 3). In positive samples (Cq≤40), correlation analysis revealed a strong correlation between heat-treated and control batches for the human RNase P gene (r=0.723; p=0.000) (Figure 4). In the weakly positive subgroup, RdRp gene Cq values showed a strong correlation between heat-treated and control samples (r=0.749, p=0.000), whereas N and E gene Cq values showed moderate correlations (r=0.400, p=0.000 and r=0.535, p=0.001, respectively).
Correlation between the RdRp gene Cq values in the control and heat-treated strongly positive (Cq≤33) sample batch
Correlation between the N gene Cq values in the control and heat-treated strongly positive (Cq≤33) sample batch
Correlation between the E gene Cq values in the control and heat-treated strongly positive (Cq≤33) sample batch
Correlation between the human RNase P gene Cq values in the control and heat-treated positive sample batch
DISCUSSION
The main finding of our study is that heat inactivation at 56 °C for 30 min did not significantly affect SARS-CoV-2 detection with the multi-target GeneFinder assay. Among the 200 samples, only one weakly positive became negative after heating, and the overall positive-to-negative ratio was not significantly altered (χ^2^=0.01, p=0.91). Detection of individual targets (RdRp, N, E) was not significantly affected, with very strong correlations observed between heat-treated and control samples, particularly for the N and E genes in the strongly positive subgroup. These findings align with those from the Wuhan University Renmin Hospital (27) and with an Ethiopian cohort study of 188 patients (28), both reporting no significant effect of heat inactivation on detection rates. Notably, the Ethiopian study reported significant variation in the N gene amplification (p=0.010, even more pronounced in weakly positive samples, p=0.001), while in our study, heat-treated strongly positive samples showed significantly higher Cq values for the N gene. Moreover, in positive samples (Cq≤40), heat treatment led to significantly higher Cq values for the human RNase P gene compared to control samples, whereas in the weakly positive samples, only the E gene showed significantly lower Cq values than control samples. This may point to gene-specific susceptibility to heat pre-treatment. In the strongly positive subgroup, correlation analysis corroborated these subtleties: the strongest effects concerned the N and E genes (r=0.972; r=0.951), whereas the Ethiopian study reported the highest correlation for ORF1ab (r=0.978).
While many studies report negligible effects like ours does (21, 27, 29), some reports indicate that elevated temperatures may degrade viral RNA and thus increase Cq, rendering weak positive or even false negative findings, particularly in low viral load samples (Cq>35) (22, 30, 31, 32). As noted above, these discrepancies likely reflect different susceptibility to heat between viral strains, but the differences may also be owed to different specimen types, reagents, and cohort size.
In general, however, the current body of evidence suggests that heat inactivation at 56 °C for 30 min does not impair SARS-CoV-2 detection by RT-qPCR, although gene-specific sensitivity variations and the risk of false negatives in low viral load samples must be taken into account.
Our study has several limitations. We analysed only NP and OP swabs, excluding other specimen types such as blood, saliva, sputum, or stool, which limits the generalisability of our findings. We also evaluated a single heat inactivation protocol (56 °C for 30 min) and a single commercial RT-qPCR assay, which limits extrapolation to alternative protocols or platforms. Moreover, our analysis was limited to the qualitative detection of viral RNA. We did not quantify the number of RNA copies to establish these differences between heat-treated and control samples, did not assess RNA degradation, nor did we compare heat treatment with chemical inactivation methods. Finally, the observed effect of heat inactivation was most pronounced in samples with low viral load (evidenced by high Cq), which increases the risk of false negatives.
CONCLUSION
Regardless of these limitations, our findings show that heat inactivation at 56 °C for 30 min does not significantly affect the overall detection rate of SARS-CoV-2 with RT-qPCR. However, it led to changes in the Cq values of targeted viral genes, including target loss, gain, and, in some cases, complete signal disappearance, most notably in weakly positive samples (Cq>33). Even so, heat inactivation at 56 °C for 30 min offers a reasonable compromise between laboratory biosafety and diagnostic integrity when using the multi-target GeneFinder assay.
To minimise diagnostic error, we believe that rigorous pre-analytical control and validated multi-target RT-qPCR protocols remain essential. Further validation across a broader range of specimen types, alternative inactivation protocols, and quantitative methodologies is warranted to establish standardised guidelines to optimise both protocol safety and sensitivity.
The reference list from the paper itself. Each links out to its DOI / PubMed record.
- 1She J Jiang J Ye L Hu L Bai C Song Y 2019 novel coronavirus of pneumonia in Wuhan, China: emerging attack and management strategies Clin Transl Med 2020911910.1186/s 40169-020-00271-z 32078069 PMC 7033263 · doi ↗ · pubmed ↗
- 2Zanke AA Thenge RR Adhao VSCOVID-19: A pandemic declare by world health organization IP Int J Compr Adv Pharmacol 20205495710.18231/j.ijcaap.2020.012 · doi ↗
- 3World Health Organization (WHO)Coronavirus disease (COVID-19) dashboards [displayed 24 December 2024]Available at https://data.who.int/dashboards/covid 19/cases
- 4Esbin MN Whitney ON Chong S Maurer A Darzacq X Tjian R Overcoming the bottleneck to widespread testing: a rapid review of nucleic acid testing approaches for COVID-19 detection RNA 2020267718310.1261/rna.076232.12032358057 PMC 7297120 · doi ↗ · pubmed ↗
- 5World Health Organization (WHO)Advice on the use of point-of-care immunodiagnostic tests for COVID-19 [displayed 24 December 2024]Available at https://www.who.int/news-room/commentaries/detail/advice-on-the-use-of-point-of-care-immunodiagnostic-tests-for-covid-19
- 6Corman VM Landt O Kaiser M Molenkamp R Meijer A Chu DK Bleicker T Brünink S Schneider J Schmidt ML Mulders DG Haagmans B Lvan der Veer Bvan den Brink S Wijsman L Goderski G Romette JL Ellis J Zambon M Peiris M Goossens H Reusken C Koopmans MP Drosten C Detection of 2019 novel coronavirus (2019-n Co V) by real-time RT-PCR Euro Surveill 2020253200004510.2807/1560-7917.ES.2020.25.3.200004531992387 PMC 6988269 · doi ↗ · pubmed ↗
- 7Kumar R Nagpal S Kaushik S Mendiratta SCOVID-19 diagnostic approaches: different roads to the same destination Virus Dis 2020319710510.1007/s 13337-020-00599-7PMC 729317032656306 · doi ↗ · pubmed ↗
- 8Bustin SA Benes V Garson JA Hellemans J Huggett J Kubista M Mueller R Nolan T Pfaffl MW Shipley GL Vandesompele J Wittwer CT The MIQE guidelines: minimum information for publication of quantitative real-time PCR experiments Clin Chem 2009556112210.1373/clinchem.2008.11279719246619 · doi ↗ · pubmed ↗