Significance of Serum Tumor Markers in Esophageal and Gastric Cancers: A Systematic Literature Review
Yasunori Matsumoto, Takeshi Toyozumi, Hideaki Shimada

TL;DR
This paper reviews serum tumor markers for esophageal and gastric cancers, identifying which markers are most useful for diagnosis and prognosis.
Contribution
The study provides a systematic evaluation of serum tumor markers for ESCC and GC, highlighting their diagnostic and prognostic significance.
Findings
SCC-Ag is the most sensitive and prognostic marker for ESCC.
CEA and CA125 are the most valuable markers for GC prognosis.
CA125 and CA72-4 are associated with peritoneal dissemination in GC.
Abstract
Serum tumor markers are helpful for diagnosis, monitoring treatment outcomes, and prognosis. However, their clinical utility for esophageal squamous cell carcinoma (ESCC) and gastric cancer (GC) remains unclear. This study aimed to comprehensively evaluate recent studies on serum tumor markers in ESCC and GC. We conducted a systematic review and meta‐analysis of studies published between January 2010 and March 2025 using PubMed. Overall, 84 and 468 articles on ESCC and GC were extracted, respectively. The sensitivity, specificity, positive predictive value, and summary receiver operating characteristic curves were calculated and evaluated using a systematic review and meta‐analysis. Prognostic values were assessed using the hazard ratio based on univariate and multivariate analyses. In ESCC, squamous cell carcinoma antigen (SCC‐Ag) exhibited the highest sensitivity (38.7%) and…
Genes, proteins, chemicals, diseases, species, mutations and cell lines named across the full text — each resolved to its canonical identifier and authoritative record.
Click any figure to enlarge with its caption.
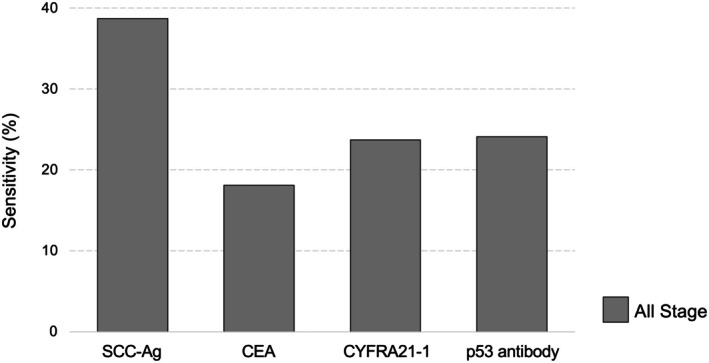 FIGURE 1
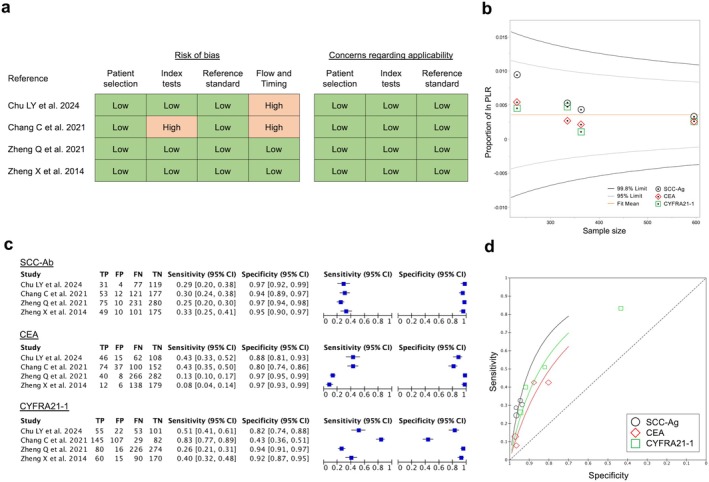 FIGURE 2
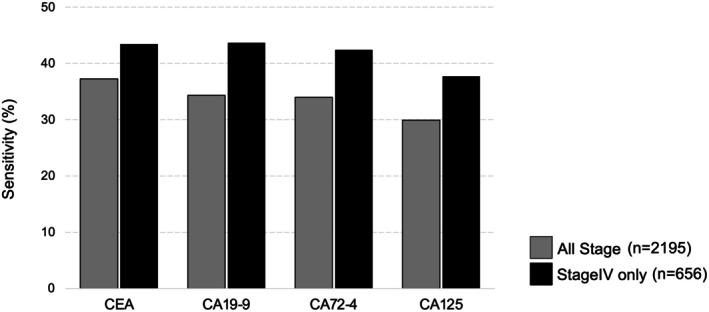 FIGURE 3
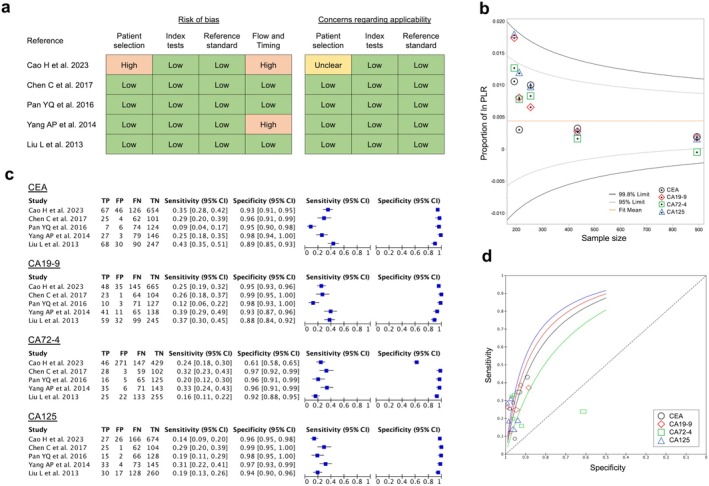 FIGURE 4
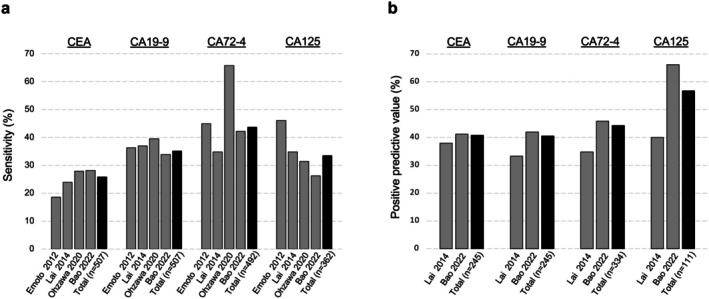 FIGURE 5
| Ref. | Author | Year | Number | Stage | SCC‐Ag | |||||
|---|---|---|---|---|---|---|---|---|---|---|
| I | II | III | IV | N/A | Sensitivity | Cut off (ng/mL) | ||||
| [ | Suzuki T | 2024 | 566 | 245 | 138 | 162 | 21 | − | 26.7% | 1.5 |
| [ | Shinozuka T | 2022 | 449 | 150 | 119 | 132 | 48 | − | 29.8% | 1.5 |
| [ | Kanda M | 2020 | 427 | 149 | 121 | 138 | 19 | − | 50.8% | 1.1 |
| [ | Qiao Y | 2019 | 315 | 147 | 168 | − | − | 15.6% | 1.5 | |
| [ | Cao X | 2012 | 379 | − | 427 | − | − | − | 72.8% | 1.5 |
| Total | 2136 | 38.7% | ||||||||
| Ref. | Author | Year | Number | Population | Univariate | Multivariate | ||||||||||||||
|---|---|---|---|---|---|---|---|---|---|---|---|---|---|---|---|---|---|---|---|---|
| SCC‐Ag | CEA | CYFRA21‐1 | p53 antibody | SCC‐Ag | CEA | CYFRA21‐1 | p53 antibody | |||||||||||||
| HR | 95% CI | HR | 95% CI | HR | 95% CI | HR | 95% CI | HR | 95% CI | HR | 95% CI | HR | 95% CI | HR | 95% CI | |||||
| [ | Suzuki T | 2024 | 566 | UFS | N/A | N/A | N/A | N/A | 1.05 | 0.73–1.53 | N/A | N/A | N/A | |||||||
| [ | Shinozuka T | 2022 | 449 | UFS, NAC | 2.2 | 1.44–3.35 | N/A | 1.12 | 0.54–2.32 | N/A | 1.82 | 1.19–2.79 | N/A | — | N/A | |||||
| [ | Ishioka N | 2022 | 1047 | UFS | N/A | N/A | N/A | N/A | N/A | 1.22 | 0.70–2.14 | N/A | N/A | |||||||
| [ | Kanie Y | 2021 | 208 | Recurrence | 1.05 | 1.02–1.07 | N/A | N/A | N/A | 1.03 | 1.00–1.06 | N/A | N/A | N/A | ||||||
| [ | Suzuki T | 2021 | 1487 | UFS | N/A | N/A | N/A | N/A | N/A | N/A | N/A | 1.3 | 0.87–1.94 | |||||||
| [ | Okamura A | 2021 | 453 | NAC | N/A | N/A | N/A | N/A | 1.79 | 1.25–2.56 | N/A | N/A | N/A | |||||||
| [ | Kanda M | 2020 | 427 | UFS, NAC | 2.26 | 1.51–3.38 | N/A | 0.82 | 0.40–1.69 | N/A | 2.04 | 1.36–3.07 | N/A | — | N/A | |||||
| [ | Qiao Y | 2019 | 315 | UFS | 1.59 | 1.11–2.230 | 1.49 | 1.11–2.023 | N/A | N/A | 1.19 | 0.82–1.75 | 1.26 | 0.93–1.72 | N/A | N/A | ||||
| [ | Ma Q | 2016 | 725 | UFS | 1.17 | 0.82–1.68 | N/A | 1.12 | 0.99–1.28 | N/A | — | N/A | — | N/A | ||||||
| [ | Zhao H | 2014 | 314 | All treatment | N/A | N/A | 1.08 | 0.530–2.23 | N/A | N/A | — | N/A | N/A | |||||||
| [ | Cao X | 2012 | 379 | UFS (Stage II) | 3.94 | 2.23–6.96 | 7.43 | 5.18–10.69 | N/A | N/A | 2.92 | 1.66–5.18 | 7.14 | 4.96–10.30 | N/A | N/A | ||||
| Ref. | Author | Year | Number | Stage | CEA | CA19‐9 | CA72‐4 | CA125 | ||||||||
|---|---|---|---|---|---|---|---|---|---|---|---|---|---|---|---|---|
| I | II | III | IV | N/A | Sensitivity | Cut off (ng/mL) | Sensitivity | Cut off (U/mL) | Sensitivity | Cut off (U/mL) | Sensitivity | Cut off (U/mL) | ||||
| [ | Zhang D | 2024 | 215 | 88 | 123 | 4 | 57.2% | N/A | 55.3% | N/A | 65.6% | N/A | 63.7% | N/A | ||
| [ | Chen X | 2024 | 128 | 58 | 28 | 42 | 0 | — | 10.2% | N/A | 10.2% | N/A | 13.3% | N/A | 1.6% | N/A |
| [ | Tong Y | 2021 | 290 | 52 | 71 | 167 | 0 | — | 53.3% | 1.6 | 25.2% | 24.9 | 37.1% | 4.6 | 27.7% | 16 |
| [ | Abbas M | 2019 | 216 | 0 | 0 | 0 | 216 | — | 58.8% | 3.5 | 52.3% | 39 | 30.1% | 6.9 | 25.0% | 35 |
| [ | Zhang K | 2017 | 162 | 21 | 59 | 79 | 3 | — | 15.4% | 5 | 22.8% | 37 | 10.5% | 10 | 25.9% | 35 |
| [ | Sun Z | 2014 | 184 | 53 | 126 | 5 | 34.8% | 5 | 25.5% | 37 | 29.9% | 6.7 | 12.5% | 20 | ||
| [ | Wang Q | 2014 | 439 | 0 | 0 | 0 | 439 | — | 41.1% | 10 | 40.0% | 39 | 51.3% | 6.9 | 45.9% | 30.2 |
| [ | Yang AP | 2014 | 106 | — | — | — | — | 106 | 25.5% | 10 | 38.7% | 37 | 33.0% | 19.3 | 31.1% | 35 |
| [ | Lai H | 2014 | 215 | — | — | — | — | 215 | 13.5% | 5 | 23.7% | 37 | 21.4% | 5 | 18.6% | 35 |
| [ | Liu L | 2013 | 138 | 22 | 28 | 63 | 25 | — | 44.9% | 5 | 38.4% | 39 | 15.9% | 9.8 | 20.3% | 40 |
| [ | Emoto S | 2012 | 102 | 0 | 0 | 0 | 102 | — | 18.6% | 5 | 36.3% | 37 | 44.9% | 4 | 46.1% | 30 |
| Total | 2195 | 37.2% | 34.3% | 33.9% | 29.9% | |||||||||||
| Ref. | Author | Year | Number | Population | Univariate | Multivariate | ||||||||||||||
|---|---|---|---|---|---|---|---|---|---|---|---|---|---|---|---|---|---|---|---|---|
| CEA | CA19‐9 | CA72‐4 | CA125 | CEA | CA19‐9 | CA72‐4 | CA125 | |||||||||||||
| HR | 95% CI | HR | 95% CI | HR | 95% CI | HR | 95% CI | HR | 95% CI | HR | 95% CI | HR | 95% CI | HR | 95% CI | |||||
| [ | Chen X | 2024 | 128 | UFS | 2.75 | 1.01–7.48 | 0.80 | 0.19–3.42 | 1.93 | 0.64–5.76 | 4.17 | 0.97–19.01 | − | − | − | − | ||||
| [ | Tong Y | 2021 | 290 | NAC | 1.19 | 0.84–2.07 | 1.73 | 1.19–2.52 | 2.03 | 1.39–2.97 | 2.34 | 1.52–3.61 | 1.27 | 0.71–2.25 | 0.98 | 0.53–1.83 | 2.18 | 1.17–4.06 | 1.50 | 0.82–2.75 |
| [ | Feng Y | 2020 | 249 | UFS | 1.35 | 1.14–1.61 | 1.28 | 1.61–1.53 | 1.16 | 0.96–1.40 | 1.65 | 1.16–1.65 | 1.30 | 1.06–1.61 | 1.01 | 0.81–1.28 | − | 1.35 | 0.90–2.04 | |
| [ | Wang Q | 2014 | 439 | MRGC | N/A | N/A | N/A | N/A | 1.39 | 1.01–1.92 | 1.25 | 0.89–1.76 | 0.76 | 0.53–1.08 | 1.55 | 1.05–2.28 | ||||
| [ | Emoto S | 2012 | 102 | PD | 1.54 | 0.69–3.08 | 1.51 | 0.83–2.74 | 1.24 | 0.67–2.29 | 2.99 | 1.61–5.74 | − | − | − | 2.24 | 1.14–4.56 | |||
Peer Reviews
No public reviews on file for this paper yet. If you reviewed it on a platform where reviews are public (OpenReview, ICLR, NeurIPS, ICML), you can paste yours below so the community can read it here.
Videos
No videos yet. Explain this paper in a talk, walkthrough, or lecture? Add one.
Taxonomy
TopicsGastric Cancer Management and Outcomes · Esophageal Cancer Research and Treatment · Pancreatic and Hepatic Oncology Research
Introduction
1
Esophageal and gastric cancers are among the most prevalent gastrointestinal malignancies, characterized by high global morbidity and mortality, and rank among the leading causes of cancer‐related deaths. According to GLOBOCAN 2022 [1], roughly 970 000 gastric cancer cases are diagnosed annually, resulting in about 660 000 deaths, whereas esophageal cancer accounts for approximately 510 000 new cases and 450 000 deaths each year. The prognosis for esophageal and gastric cancers remains poor [2, 3], and their incidence rates are high in Asia, especially in China, Japan, and Korea. Dietary habits, living environment, infectious diseases such as Helicobacter pylori and Epstein–Barr virus, and genetic predisposition are believed to be intricately involved in these diseases [4].
Consequently, early diagnosis and straightforward monitoring of therapeutic response constitute critical clinical challenges to improving outcomes [5]. As a contribution to this, serum tumor markers that can be tested repeatedly with minimal invasiveness are considered inexpensive and useful in clinical practice [6, 7, 8].
Traditionally, serum tumor markers, such as carcinoembryonic antigen (CEA), squamous cell carcinoma antigen (SCC‐Ag), cytokeratin 19 fragment 21‐1 (CYFRA21‐1), and serum p53 antibody, have been widely used in the diagnosis of esophageal cancer [9, 10, 11]. Conversely, blood‐based tumor markers, such as CEA, carbohydrate antigen 19‐9 (CA19‐9), carbohydrate antigen 72‐4 (CA72‐4), and carbohydrate antigen 125 (CA125) have been widely used in gastric cancer [12, 13, 14]. Due to the limitations in sensitivity and specificity, the independent use of these markers is insufficient; therefore, efforts are underway to combine multiple markers and search for new ones [15, 16, 17]. Furthermore, most prior investigations of blood‐based tumor markers for esophageal cancer have combined esophageal adenocarcinoma with junctional cancer, and only a few studies have focused exclusively on esophageal squamous cell carcinoma (ESCC). Moreover, over the past decade, particularly in East Asia, there has been a significant increase in reports on blood‐based tumor markers for esophageal and gastric cancers [18, 19]; nonetheless, few systematic reviews have comprehensively analyzed these studies.
Therefore, this review aimed to comprehensively collate the latest evidence on serum tumor markers in ESCC and gastric cancer. Specifically, we conducted a systematic review of the standard serum markers reimbursed by public insurance in Japan and assessed their sensitivity, specificity, and prognostic value.
Methods
2
A search was conducted using PubMed from January 1, 2010, to March 31, 2025.
For ESCC, we searched the terms “esophageal cancer” in combination with various blood‐based tumor markers (search strategy and flow chart provided in the Figure S1 and Table S1) and identified 400 articles. Only studies on squamous cell carcinoma were considered; however, studies including other histologies, such as adenocarcinoma, were excluded. After omitting case reports and nonclinical studies, 84 articles were reviewed in full. The number of articles extracted was as follows: SCC‐Ag, 43; CEA, 42; CYFRA21‐1, 31; serum p53 antibody, 26; CA19‐9, 5; and a few on CA125, CA72‐4, and related markers. We conducted a meta‐analysis for four markers, SCC‐Ag, CEA, CYFRA21‐1, and serum p53 antibody, and undertook a systematic review of the clinical significance of each.
A search for “gastric cancer” and various tumor markers (see search formula and flow chart in the Figure S1 and Table S1) yielded 1108 articles. Case reports and nonclinical studies were excluded, and the abstracts or full texts of 468 articles were examined. The number of articles extracted was as follows: CEA, 368; CA19‐9, 115; CA72‐4, 115; CA125, 72; alpha‐fetoprotein (AFP), 77; carbohydrate antigen 242, 24; carbohydrate antigen 15‐3, 14; carbohydrate antigen 50, nine; CYFRA21‐1, six; and neuron‐specific enolase, three. Notably, AFP is often examined separately in studies on AFP‐producing gastric cancer and hepatoid adenocarcinoma of the stomach. Here, a meta‐analysis of four tumor markers, namely CEA, CA19‐9, CA72‐4, and CA125, along with a systematic review, was conducted to describe the clinical significance of each tumor marker.
Articles comparing cancer patients with healthy individuals or patients with benign diseases were included in the evaluation of diagnostic accuracy, and articles comparing cancer patients with and without metastasis were included in the evaluation of metastasis diagnosis. Articles evaluating sensitivity and prognosis in cancer patients were included regardless of the population.
A meta‐analysis was performed using RevMan Ver. 5.4 to calculate sensitivity, specificity, and summary receiver operating characteristics (SROC) curves. The quality of the included studies in the meta‐analysis was assessed using QUADAS‐2, and publication bias was assessed using a funnel plot. Hazard ratios (HRs) and 95% confidence intervals (CIs) were calculated in both univariate and multivariate analyses to examine prognoses.
Results
3
Sensitivity and Diagnostic Accuracy of Tumor Markers in ESCC
3.1
Few studies have simultaneously measured four blood‐based tumor markers for ESCC; therefore, we examined articles with a large number of cases analyzed for each marker [9, 20, 21, 22, 23, 24, 25, 26, 27, 28, 29, 30, 31, 32, 33, 34]. Table 1 presents the sensitivity, cutoff value, and patient stage distribution of the top five articles for each blood‐based tumor marker. Except for two articles [20, 25] that did not provide a clear explanation prior to treatment, the markers are pre‐treatment measurements. The cutoff values used in all articles are either consistent with previous reports or based on the manufacturer's recommended thresholds. The overall sensitivity for SCC‐Ag, CEA, CYFRA21‐1, and serum p53 antibodies was 38.7% (827/2136), 18.1% (276/1528), 23.7% (531/2239) CYFRA21‐1, and 24.1% (521/2164), respectively, when we simply add them together without considering their heterogeneity or bias (Figure 1).
Sensitivity of serum tumor markers in all stages of ESCC. The overall sensitivity of each serum marker was 38.7%, 18.1%, 23.7%, and 24.1% for SCC‐Ag, CEA, CYFRA21‐1, and serum p53 antibody, respectively.
Regarding diagnostic accuracy, the review question was set as “Which serum marker has the highest diagnostic ability for ESCC?” and we performed a meta‐analysis of four studies [25, 35, 36, 37] in which three markers, namely SCC‐Ag, CEA, and CYFRA21‐1, were measured concurrently, and true‐positive (TP), false‐positive (FP), and false‐negative (FN) rates were extracted. To date, no reports have simultaneously examined all four markers, including the p53 antibody, and computed TP, FP, and FN values. The quality of the literature was assessed using QUADAS‐2 (Figure 2a), and publication bias was assessed using a funnel plot based on the sample size and positive likelihood ratio in each article (Figure 2b). Details of the cases included in the articles (e.g., details of the control group, cutoff values used, etc.) are listed in the Table S2. The specificity of CYFRA21‐1was significantly below 0.7 in one article with own cutoff value; however, in the other studies, values were 0.8 or higher for all three markers. Moreover, sensitivity was 0.25–0.33, 0.08–0.43, and 0.26–0.83 for SCC‐Ag, CEA, and CYFRA21‐1, respectively, indicating that none of the markers was sufficiently sensitive (Figure 2c). The positive predictive values (PPVs) obtained by combining the four studies were 85.2%, 72.3%, and 68.0% for SCC‐Ag, CEA, and CYFRA21‐1, respectively. Although the PPV of SCC‐Ag was high, the PPVs of CYFRA21‐1 and CEA were approximately 70%, which cannot be considered high or meaningful. The SROC curves for each marker are illustrated in Figure 2d. Due to the limited number of articles included in this meta‐analysis, it is not possible to definitively state which method is superior in diagnostic ability. However, the area under the curve (AUC) values were highest for SCC‐Ag, followed by CYFRA21‐1 and CEA.
Diagnostic accuracies of serum tumor markers in ESCC. (a) Quality assessment of the four included articles using QUADAS‐2. (b) Funnel plots with sample size and positive likelihood ratios (PLR) were used to evaluate publication bias in the four articles. (c) The number of true positives (TN), false positives (FP), false negatives (FN), and true negatives (TN) was calculated from each of the four articles, and sensitivity and specificity were computed and plotted. (d) Summary ROC curve of each serum marker. SCC‐Ag had the highest AUC value, followed by CYFRA21‐1 and CEA.
Prognostic Significance of Tumor Markers in ESCC
3.2
Overall, in 19 articles, univariate and multivariate analyses were conducted using overall survival as the endpoint and tumor markers as parameters. Table 2 presents articles with 200 or more cases analyzed [9, 21, 23, 24, 26, 27, 30, 33, 38, 39, 40], and in all articles, markers are pre‐treatment measurements. In univariate analysis, only one article reported an HR < 1.00 for CYFRA21‐1 (0.82). In other studies, positivity for all four markers was associated with an HR of 1.00 or higher, indicating a poor prognosis. Conversely, in multivariate analysis, with the exception of one report on CEA [33], the only tumor marker reported to be a significantly poor prognostic factor was SCC‐Ag; moreover, five articles [9, 23, 33, 38, 39] found that SCC‐Ag was an independent predictor of poor prognosis.
Sensitivity and Diagnostic Accuracy of Tumor Markers in Gastric Cancer
3.3
Table 3 presents the sensitivity, cutoff value, and patient stage distribution in 11 studies [17, 41, 42, 43, 44, 45, 46, 47, 48, 49, 50] that analyzed groups of 100–1000 patients with gastric cancer, simultaneously measuring four blood‐based tumor markers (CEA, CA19‐9, CA72‐4, and CA125). Except for two articles [17, 47] that did not provide a clear explanation prior to treatment, the markers are pre‐treatment measurements. The cutoff values used in all articles are either consistent with previous reports or based on the manufacturer's recommended thresholds. The sensitivities for each marker were 37.2% (773/2076), 34.3% (702/2045), 34.0% (665/1959), and 29.9% (564/1885) for CEA, CA19‐9, CA72‐4, and CA125, respectively, when we simply add them together without considering their heterogeneity or bias. The sensitivities in three articles [44, 47, 50] that only covered stage IV were 43.4% (285/656), 43.7% (272/623), 42.4% (249/587), and 37.7% (207/548) for CEA, CA19‐9, CA72‐4, and CA125, respectively. Compared with the sensitivity of 11 articles that included all stages, these rates were higher by approximately 6%–9% (Figure 3).
Sensitivity of serum tumor markers in all stages and stage IV gastric cancer. The sensitivities of each serum marker at all stages were 37.2%, 34.0%, 34.0%, and 29.9% for CEA, CA19‐9, CA72‐4, and CA125, respectively. The sensitivities of serum tumor markers in stage IV cases were 43.4%, 43.7%, 42.4%, and 37.7% for CEA, CA19‐9, CA72‐4, and CA125, respectively. The sensitivity of serum tumor markers in stage IV cases was higher than that in all other stages.
Regarding diagnostic accuracy, eight studies [17, 45, 49, 50, 51, 52, 53, 54, 55] measured all four markers and reported AUCs of 0.55–0.83, 0.50–0.76, 0.54–0.84, and 0.50–0.73 for CEA, CA19‐9, CA72‐4, and CA125, respectively (Table S3). The review question was set as “Which serum marker has the highest diagnostic ability for GC?,” a meta‐analysis was performed on five articles [17, 49, 52, 55, 56] that simultaneously measured the TP, FP, FN, and FP of the four markers. The quality of the literature was assessed using QUADAS‐2 (Figure 4a), and publication bias was assessed using a funnel plot based on the sample size and positive likelihood ratio in each article (Figure 4b). Details of the cases included in the articles (e.g., details of the control group, cutoff values used, etc.) are listed in the Table S4. The specificity was below 0.7 for CA72‐4 in only one article [52] that include a large number of healthy controls and the possible presence of bias risk in QUADAS‐2; for CEA and CA19‐9 it was also 0.89 and 0.88 in one study, respectively, but in the other literature specificity for all four markers was 0.9 or higher. Conversely, the sensitivity was 0.09–0.43, 0.12–0.39, 0.16–0.33, and 0.14–0.31 for CEA, CA19‐9, CA72‐4, and CA125, respectively, suggesting that isolated markers do not possess sufficient sensitivity (Figure 4c). According to an integrated analysis of five articles, the PPVs for CEA, CA19‐9, CA72‐4, and CA125 were 68.6%, 68.8%, 48.9%, and 72.2%, indicating that CA125 was the most reliable marker of gastric cancer. The SROC curves for each marker are shown in Figure 4d. The AUC values were the highest for CA125, followed by CA19‐9, CEA, and CA72‐4.
Diagnostic accuracies of serum tumor markers in gastric cancer. (a) Quality assessment of the five included articles using QUADAS‐2. (b) Funnel plots with sample size and positive likelihood ratios (PLR) were used to evaluate publication bias in the five articles. (c) The number of true positives (TP), false positives (FP), false negatives (FN), and true negatives (TN) was calculated from each of the five articles, and sensitivity and specificity were computed and plotted. (d) Summary ROC curve of each serum marker. The AUC value was highest for CA125, followed by CA19‐9, CEA, and CA72‐4.
Sensitivities of Metastases of Tumor Markers in Gastric Cancer
3.4
Only one article [48] reported the simultaneous measurement of four markers for lymph node metastasis, with reported sensitivities of 12.8%, 23.5%, 21.6%, and 15.7% for CA125 for CEA, CA19‐9, CA72‐4, and CA125, respectively. The sensitivity of CA19‐9 was relatively high; nonetheless, the sensitivity of each marker was less than 30%.
Four articles [48, 50, 57, 58] measured the four markers for peritoneal dissemination; the sensitivities of dissemination positivity, calculated from the number of cases listed, were 25.8%, 35.1%, 43.7%, and 33.4% for CEA, CA19‐9, CA72‐4, and CA125, respectively. The profile differed from the marker positivity rate in Stage IV cases mentioned previously. Specifically, the sensitivity of CEA was reported to be below 30% in all articles. However, the PPV of CA125 was 56.8%, which was higher than that of the other three markers (Figure 5).
Sensitivity and positive predictive value of serum tumor markers in peritoneal dissemination of gastric cancer. (a) The sensitivity calculated by combining the reported articles was 25.8%, 35.1%, 43.7%, and 33.4% for CEA, CA19‐9, CA72‐4, and CA125, respectively. (b) The positive predictive value of CA125 was 56.8%, which was higher than that of the other three markers.
Prognostic Significance of Tumor Markers in Gastric Cancer
3.5
Five articles [42, 43, 47, 50, 59] conducted univariate and multivariate analyses of the prognostic values of the four markers. Except one article [47] that did not provide a clear explanation prior to treatment, the markers are pre‐treatment measurements. In univariate analysis, one report of CA19‐9 found an HR of 0.80, while other reports showed an HR of 1 or more for positivity of all four markers. In multivariate analysis, high values of the three markers, except for CA19‐9, were significantly associated with poor prognosis (Table 4). In this analysis, CA125 had the highest HR in the univariate analysis of all articles, and CEA and CA125 were identified as independent poor prognostic factors in two articles in the multivariate analysis. However, the articles included in this analysis targeted different populations (e.g., the two studies that showed significant results for CA125 were metastatic or recurrent GC, while the other studies were surgical cases), and bias due to patient background and demographic differences must also be taken into consideration. Therefore, it is not feasible to conclude which marker more accurately reflects prognosis.
Discussion
4
In this systematic review, we comprehensively evaluated the clinical and prognostic significance of SCC‐Ag, CEA, and CYFRA21‐1 in ESCC, as well as CEA, CA19‐9, CA72‐5, and CA125 in gastric cancer. SCC‐Ag exhibited the highest PPV for ESCC and was an independent poor prognostic factor for ESCC when prognosis was used as the endpoint. In gastric cancer, CEA exhibited the highest overall positivity; CA72‐4 demonstrated the greatest sensitivity for detecting peritoneal dissemination; and CA125 yielded the highest PPV. Moreover, CEA and CA125 concentrations have been identified as independent prognostic factors in gastric cancer.
SCC‐Ag in Esophageal SCC
4.1
SCC‐Ag was evaluated in most articles included in this systematic review. It displayed the highest reported sensitivity and can therefore be regarded as a useful tumor marker for ESCC. In addition, multivariate analyses based on overall survival yielded HRs of 1.03–2.92, underscoring its value as a prognostic parameter. Although each marker contributes to prognosis estimation to some extent, heterogeneity in patient background and selection bias preclude a definitive determination of which marker most accurately reflects prognosis.
CEA in ESCC
4.2
CEA was examined in the second‐largest number of articles after SCC‐Ag. Nonetheless, its pooled sensitivity in ESCC was only 18.1%, and the PPV derived from the meta‐analysis reached merely 72.3%. Consequently, the clinical relevance of CEA measurement in ESCC is limited.
CYFRA21‐1 in ESCC
4.3
The sensitivity of this analysis was slightly lower than that of the SCC‐Ag. However, when overall survival was used as the endpoint, CYFRA21‐1 was the second most frequently mentioned target in univariate analysis following SCC‐Ag, suggesting its usefulness as a prognostic factor for ESCC. Moreover, combining SCC‐Ag with CYFRA21‐1 has been proposed to improve prognostic assessment (HR = 1.371, 95% CI: 1.024–1.836, p = 0.034) [27], and integrating these markers with additional assays is expected to enhance diagnostic accuracy.
Serum p53 Antibody in ESCC
4.4
Investigations of serum p53 antibodies have been conducted predominantly in Japan. Their sensitivity is reportedly lower than that of SCC‐Ag but comparable to that of CYFRA21‐1. In the largest multi‐institutional cohort to date (n = 1487), serum p53 antibodies were identified as an independent prognostic factor [26]. Because few studies have assessed serum p53 concurrently with other markers, its relative utility in ESCC could not be fully evaluated here; additional research is therefore warranted.
CA19‐9 in ESCC
4.5
This marker was analyzed in only five articles. In a study that simultaneously analyzed SCC‐Ag, CEA, and CA19‐9, the sensitivity was reported to be extremely low at 4.9% [32]. Therefore, CA19‐9 is unlikely to be a useful diagnostic tool for ESCC.
CEA in Gastric Cancer
4.6
Throughout the search period, the status of this tumor marker remained unchanged, as it was the most frequently cited in the literature. Our analysis confirmed its high sensitivity in gastric cancer and its role as an independent prognostic factor. However, its sensitivity and PPV for detecting peritoneal dissemination remained low; thus, complementary markers are required.
CA19‐9 in Gastric Cancer
4.7
This marker did not demonstrate independence from other markers with respect to survival, and CEA and CA125, both associated with higher HRs, should therefore take precedence. For diagnosing peritoneal dissemination, it is inferior to CA72‐4 in sensitivity and PPV and to CA125 in PPV. Nonetheless, reported cutoff values vary only minimally, and the positive rate and sensitivity for peritoneal dissemination show the least variability, indicating that this marker can readily support clinical interpretation.
CA72‐4 in Gastric Cancer
4.8
Although the PPV of CA72‐4 for peritoneal dissemination is lower than that of CA125, it has the highest sensitivity and is therefore considered useful in detecting peritoneal dissemination. Cutoff values were inconsistent across the 11 articles reviewed; apart from two studies that employed 6.9 U/mL, each used a distinct threshold. A uniform standard is therefore needed to clarify its clinical value.
CA125 in Gastric Cancer
4.9
Due to its low sensitivity, CA125 detection has limited utility as a screening test for gastric cancer. However, it has the highest PPV for dissemination and is an independent prognostic factor, particularly in metastatic or recurrent GC; therefore, it may be useful for determining treatment options for advanced cancer.
Positioning of Serum Markers Now and in the Future
4.10
In Japanese guidelines [60, 61, 62], the recommended use of serum markers is limited. In esophageal squamous cell carcinoma, the Japanese guidelines do not clearly state the significance of measuring tumor markers. In gastric cancer, there is a weak recommendation to measure multiple markers and use them as a reference in determining the course of treatment for peritoneal dissemination. In addition, serum markers are considered to contribute to the early detection of recurrence and multiple cancers during postoperative follow‐up.
Based on the results of this review, the following markers should be considered in actual clinical practice, although not with sufficient accuracy, and further findings are expected in the future: SCC‐Ag is useful for screening ESCC, and its sensitivity may be enhanced by adding CYFRA21‐1 or serum p53 antibodies. For prognostication, SCC‐Ag alone or combined with CYFRA21‐1 is most informative. Moreover, CEA and CA19‐9 aid in screening for gastric cancer. Finally, CA72‐4 and CA125 are valuable for diagnosing peritoneal dissemination, whereas CEA and CA125 are informative for prognostic prediction.
In order to improve the accuracy of blood‐based tumor markers in the future, it will be important to improve accuracy through combinations of markers and to develop new markers. Regarding the diagnostic accuracy of GC, combining four markers yields a PPV of 84.1% [56], and AUC of 0.959 [17]. In ESCC, the combination of SCC‐Ag and CYFRA21‐1 has been reported to more sensitively reflect prognosis (HR: 1.371, 95% CI: 1.024–1.836, p = 0.034) [27], but large‐scale studies are lacking. Regarding new blood‐based markers such as circulating tumor DNA (ctDNA) and microRNA are expected to contribute to personalized medicine. ctDNA is already being used clinically for colorectal cancer, but in the field of ESCC and GC, it is still in the research stage [63, 64, 65], and evidence of its usefulness in actual clinical practice is eagerly awaited.
The limitations of this study are as follows. First, studies that included esophagogastric junction adenocarcinomas or esophageal adenocarcinomas were excluded when evaluating ESCC. Second, detailed clinicopathological variables, such as histological subtype, protein expression, gene profile, stage, and metastatic sites, remain unknown because a meta‐analysis using individual patient data has not yet been conducted. For instance, in stage IV gastric cancer versus peritoneal dissemination, Wang et al. [47] reported 439 cases of stage IV disease, with peritoneal, liver, and lung metastases observed in 64.0%, 36.8%, and 10.6% of patients, respectively, whereas Emoto et al. [50] analyzed 102 cases, all with peritoneal dissemination. Whether this disparity in disease composition accounts for the divergent marker profiles is unclear. Third, overlap among markers has not been verified in ESCC or gastric cancer, underscoring the need for multicenter studies and biobank‐based analyses. Fourth, no studies have examined therapeutic efficacy or chemotherapy responsiveness, and our review identified no detailed evaluations of immune checkpoint inhibitors. Fifth, there are no reports of cost‐effectiveness analyses or evaluations conducted during this review. In recent years, discussions have been held on new markers such as ctDNA, including cost‐effectiveness evaluations [66]. Serum markers can be measured at less than one‐hundredth of the cost of ctDNA and have the potential for high cost‐effectiveness, but this has not been confirmed.
In conclusion, our systematic review presents the current evidence of serum markers for ESCC and gastric cancer, presenting considerations for their use in medical practice. Future analyses should be conducted over time, as therapeutic efficacy and prognosis may change with the advent of new therapeutic agents.
Author Contributions
Yasunori Matsumoto: conceptualization, methodology, software, data curation, investigation, validation, formal analysis, visualization, writing – original draft, writing – review and editing. Takeshi Toyozumi: conceptualization, methodology, data curation, investigation, validation, formal analysis, visualization, writing – review and editing. Hideaki Shimada: conceptualization, methodology, investigation, validation, supervision, visualization, project administration, writing – review and editing.
Ethics Statement
The authors have nothing to report.
Consent
The authors have nothing to report.
Conflicts of Interest
The authors declare no conflicts of interest.
Supporting information
Figure S1: Flowchart of the included articles for (a) esophageal squamous cell carcinoma and (b) gastric cancer. Table S1: Search formulas used for PubMed database search. Table S2: Case descriptions and cutoff values in the articles used for diagnostic accuracy analysis of esophageal squamous cell carcinoma. Table S3: AUC values for diagnosis of gastric cancer by four tumor markers. Table S4: Case descriptions and cutoff values in the articles used for diagnostic accuracy analysis of gastric cancer.
The reference list from the paper itself. Each links out to its DOI / PubMed record.
- 1F. Bray , M. Laversanne , H. Sung , et al., “Global Cancer Statistics 2022: GLOBOCAN Estimates of Incidence and Mortality Worldwide for 36 Cancers in 185 Countries,” CA: A Cancer Journal for Clinicians 74, no. 3 (2024): 229–263, 10.3322/caac.21834.38572751 · doi ↗ · pubmed ↗
- 2D. Guo , J. Jin , D. Li , Y. He , and Y. Lin , “Analysis of the Incidence and Mortality Trends of Esophageal Cancer in Cancer Registry Areas of China and Japan,” International Journal of Cancer 155, no. 8 (2024): 1376–1386, 10.1002/ijc.35003.38771567 · doi ↗ · pubmed ↗
- 3M. Asaka , M. Kobayashi , T. Kudo , et al., “Gastric Cancer Deaths by Age Group in Japan: Outlook on Preventive Measures for Elderly Adults,” Cancer Science 111, no. 10 (2020): 3845–3853, 10.1111/cas.14586.32713120 PMC 7540974 · doi ↗ · pubmed ↗
- 4H. Katoh and S. Ishikawa , “Lifestyles, Genetics, and Future Perspectives on Gastric Cancer in East Asian Populations,” Journal of Human Genetics 66, no. 9 (2021): 887–899, 10.1038/s 10038-021-00960-8.34267306 PMC 8384627 · doi ↗ · pubmed ↗
- 5M. Sasako , “Progress in the Treatment of Gastric Cancer in Japan Over the Last 50 Years,” Annals of Gastroenterological Surgery 4, no. 1 (2020): 21–29, 10.1002/ags 3.12306.32021955 PMC 6992673 · doi ↗ · pubmed ↗
- 6S. Holdenrieder , L. Pagliaro , D. Morgenstern , and F. Dayyani , “Clinically Meaningful Use of Blood Tumor Markers in Oncology,” Bio Med Research International 2016 (2016): 9795269, 10.1155/2016/9795269.28042579 PMC 5155072 · doi ↗ · pubmed ↗
- 7H. Shimada , T. Noie , M. Ohashi , K. Oba , and Y. Takahashi , “Clinical Significance of Serum Tumor Markers for Gastric Cancer: A Systematic Review of Literature by the Task Force of the Japanese Gastric Cancer Association,” Gastric Cancer 17, no. 1 (2014): 26–33, 10.1007/s 10120-013-0259-5.23572188 · doi ↗ · pubmed ↗
- 8J. X. Jing , Y. Wang , X. Q. Xu , et al., “Tumor Markers for Diagnosis, Monitoring of Recurrence and Prognosis in Patients With Upper Gastrointestinal Tract Cancer,” Asian Pacific Journal of Cancer Prevention 15, no. 23 (2014): 10267–10272, 10.7314/apjcp.2014.15.23.10267.25556459 · doi ↗ · pubmed ↗