APOE Genotype Differentially Modulates Prion Pathology in a Mouse Model
Anita M. Lizińczyk, Joanna E. Pankiewicz, William L. Cullina, Leor A. Franco, Patrick M. Sullivan, Martin J. Sadowski

TL;DR
This study shows that different APOE gene variants affect how prion diseases progress in mice, with the ε4 variant causing the worst outcomes.
Contribution
The study reveals that APOE genotype differentially modulates prion disease progression through ε4-driven mechanisms of PrPSc accumulation and neuroinflammation.
Findings
ε4/ε4 mice showed the shortest disease latency, worst neurological scores, and highest spongiform lesions.
APOE ε4 increases PrPSc accumulation, reduces solubility, and enhances neuroinflammation compared to ε3.
ε2 also worsens disease outcomes compared to ε3, though less severely than ε4.
Abstract
APOE polymorphism affects the risk of occurrence and the rate of progression in several neurodegenerative diseases including Alzheimer’s disease, primary tauopathies, α-synucleinopathy, and age-related macular degeneration, but its role in prionoses remains unestablished. Using APOE targeted replacement (TR) mice, we investigated how APOE genotype affects key neurodegenerative mechanisms involved in prion pathology. Male and female ε2/ε2, ε3/ε3, and ε4/ε4 APOE-TR mice were inoculated with 22L mouse-adapted scrapie strain or normal brain homogenate and monitored with behavioral testing from 10-week post inoculation (wpi.) onward. Mice were euthanized at 23 wpi. when all prion-infected animals were symptomatic, and their brains were analyzed for multiple neuropathological, biochemical, and transcriptomic metrics. ε4/ε422L mice featured the shortest disease latency time, the worst…
Genes, proteins, chemicals, diseases, species, mutations and cell lines named across the full text — each resolved to its canonical identifier and authoritative record.
Click any figure to enlarge with its caption.
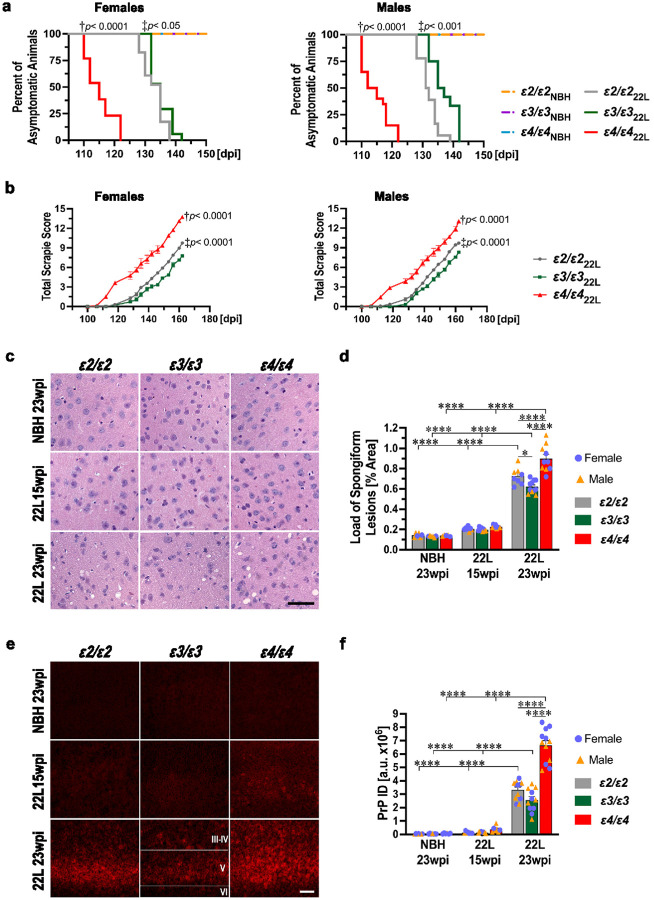 Figure 1
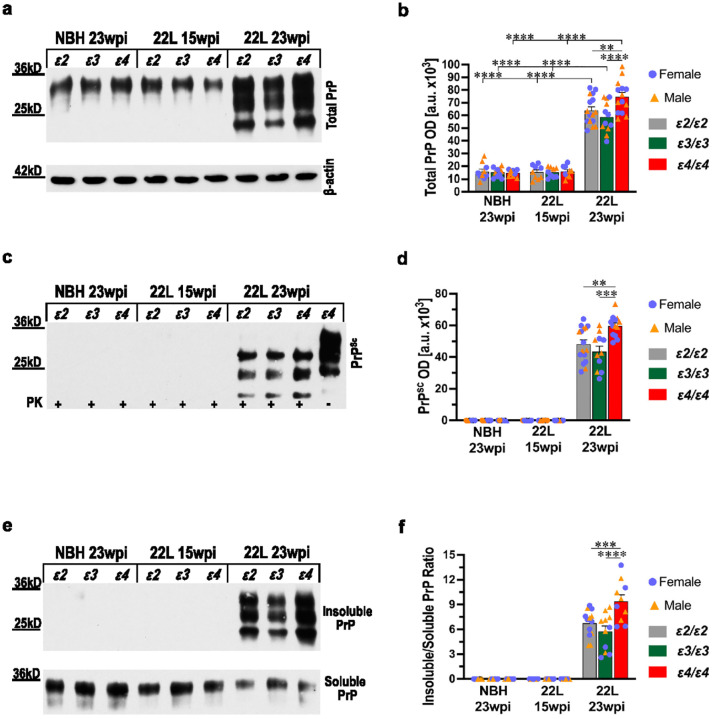 Figure 2
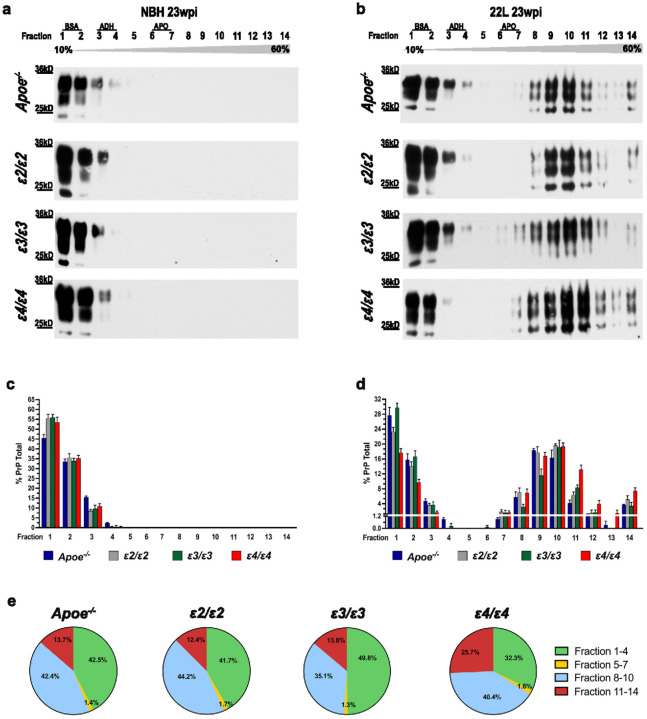 Figure 3
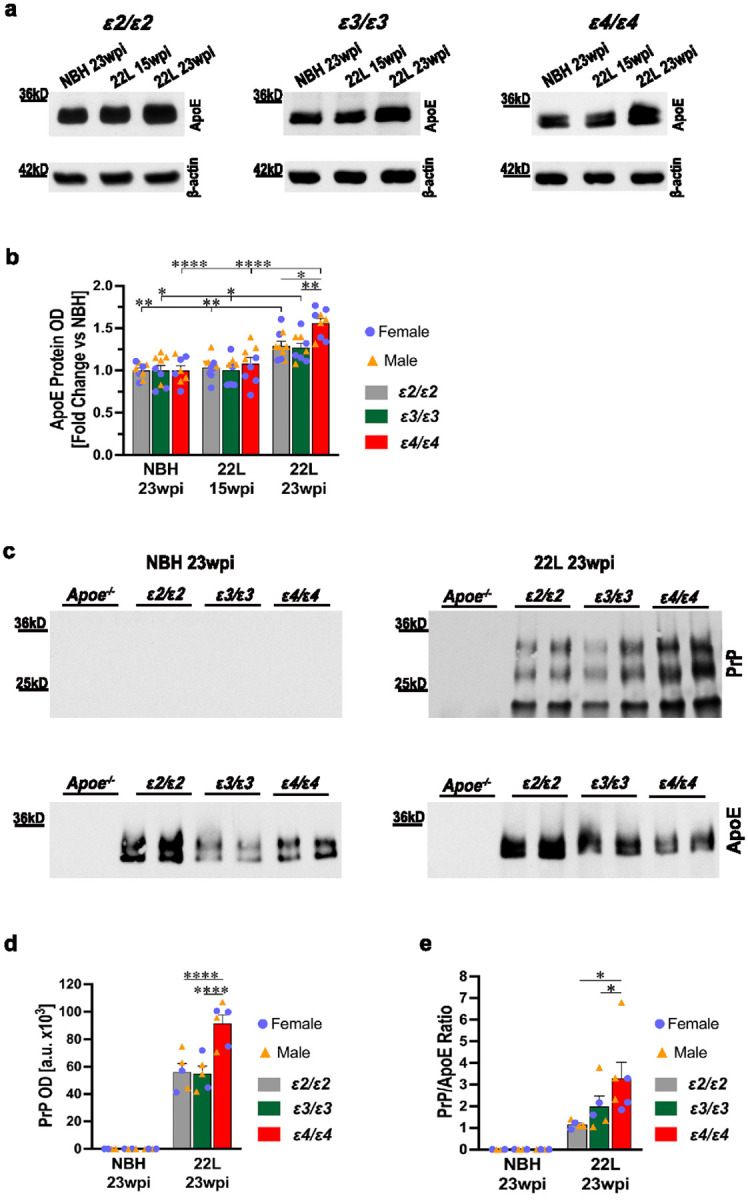 Figure 4
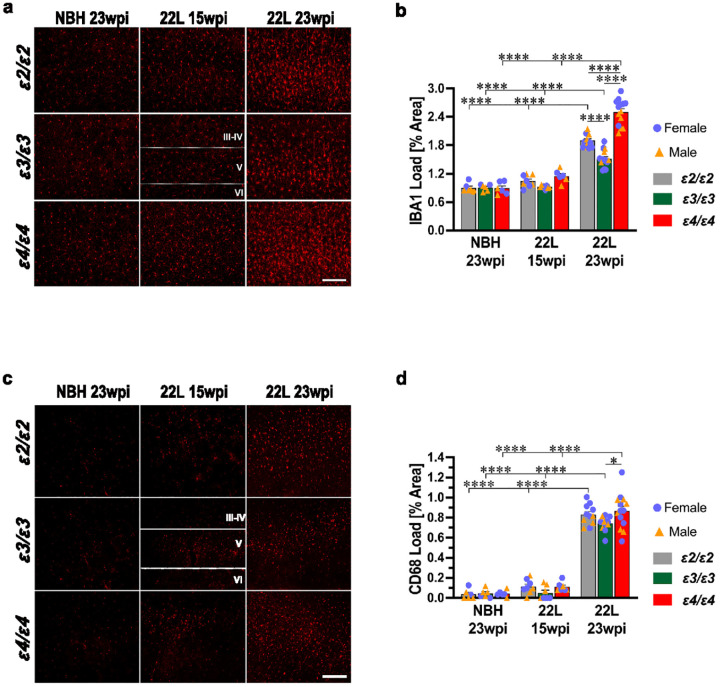 Figure 5
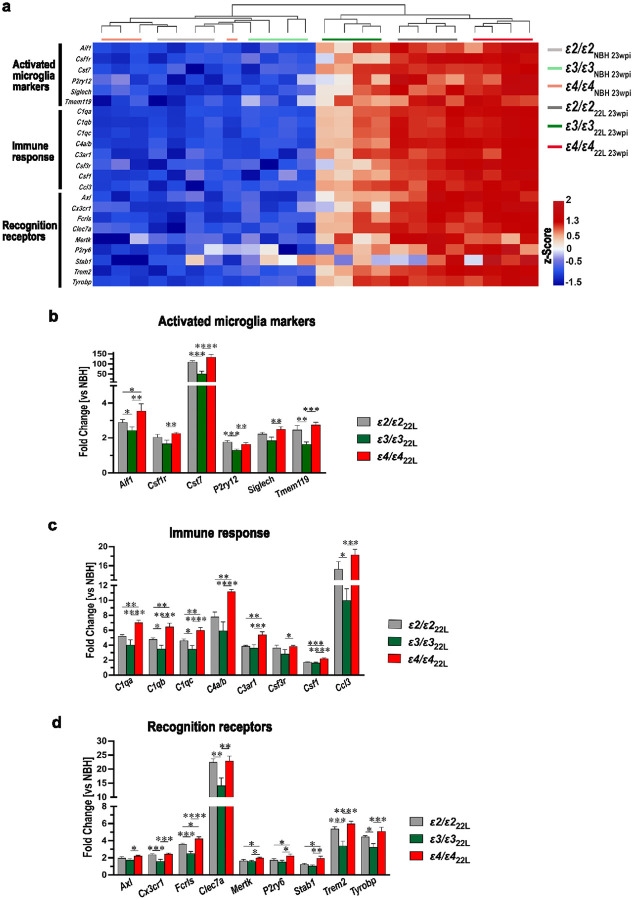 Figure 6
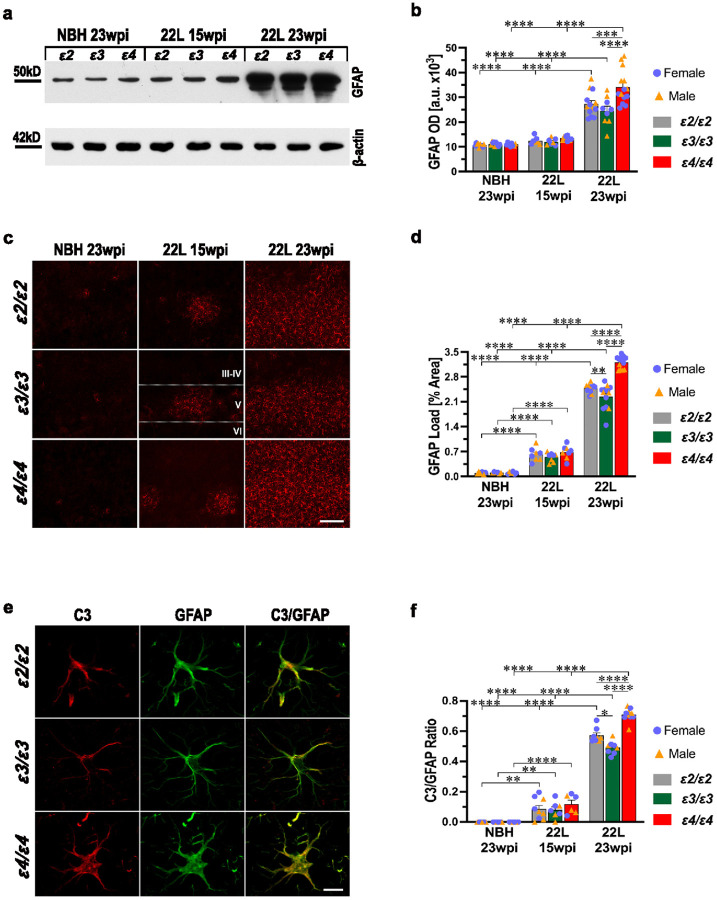 Figure 7
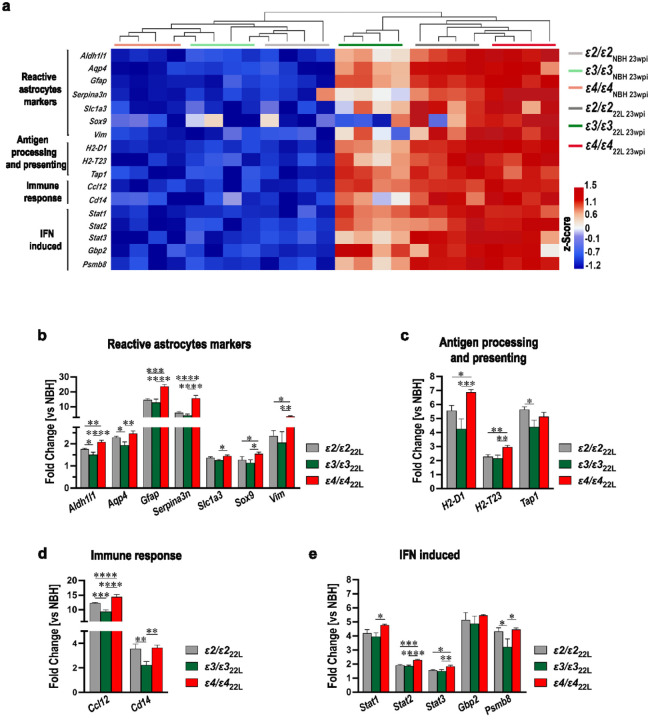 Figure 8
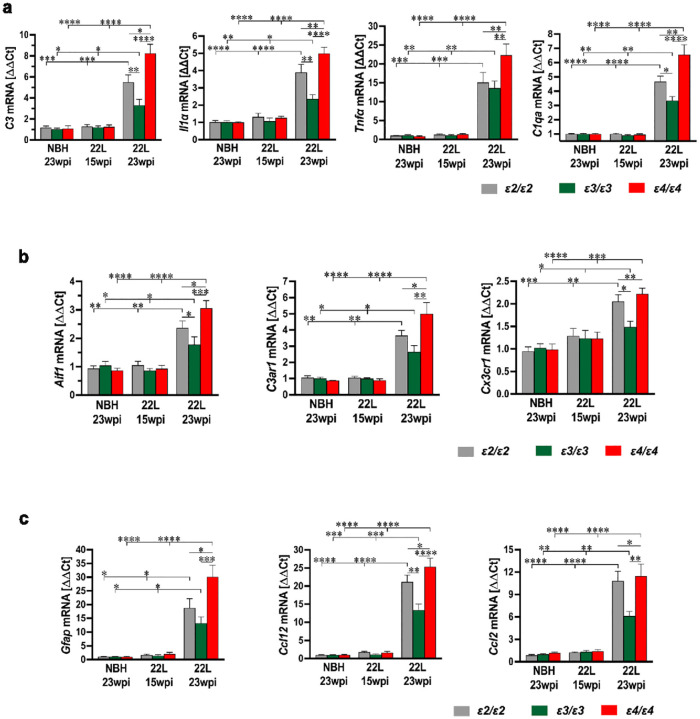 Figure 9
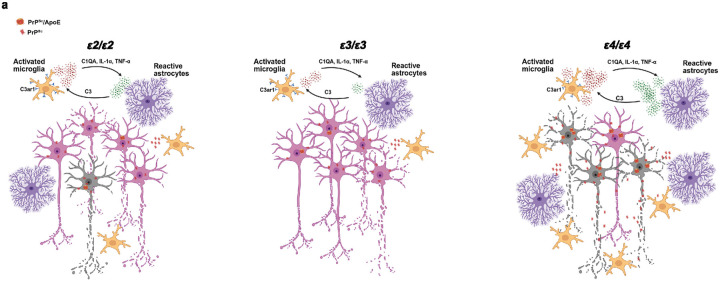 Figure 10
Peer Reviews
No public reviews on file for this paper yet. If you reviewed it on a platform where reviews are public (OpenReview, ICLR, NeurIPS, ICML), you can paste yours below so the community can read it here.
Videos
No videos yet. Explain this paper in a talk, walkthrough, or lecture? Add one.
Taxonomy
TopicsPrion Diseases and Protein Misfolding · Alzheimer's disease research and treatments · Neurological diseases and metabolism
Introduction
Apolipoprotein (apo) E is a 34-kDa lipid transporting protein encoded by the APOE gene located on chromosome 19q13.32 and expressed by hepatocytes, astrocytes, immune cells of the myeloid-lineage, vascular smooth muscle cells and adipocytes [87]. APOE polymorphism includes three common alleles ε2, ε3, and ε4, with world-wide distribution frequencies of 6.4%, 78.3%, and 14.5%, respectively [35]. They encode respective isoforms of the apoE protein, which differ in the presence of cysteine and arginine at positions 112 and 158 and feature impactful dissimilarities in tertiary structure, lipid binding ability, and receptor-mediated clearance [22, 70]. APOE polymorphism influences the risk of occurrence and the rate of progression in several cardiovascular and neurodegenerative diseases [5, 119]. The presence of the ε4 allele significantly increases risk of coronary artery disease, while the ε2 allele is associated with elevated plasma triglyceride level, and increases risk of peripheral vascular disease and carotid atherosclerosis [32, 101]. Since its discovery in the early 90’s, APOE polymorphism has remained the strongest identified genetic factor affecting risk of late-onset Alzheimer’s disease (LOAD) with the ε4 allele being associated with increased disease occurrence [25, 26, 119], while the ε2 allele effectively lowering the risk among ε4 allele non-carriers [24, 88]. This strong clinical effect is canonically explained by the opposing effects of ε4 and ε2 alleles on brain clearance of soluble β-amyloid (Aβ) peptide [20], Aβ aggregation [37], and Aβ plaque formation [75, 97], which are critical steps in establishing early AD pathology. Irrespective of promoting LOAD’s occurrence, the ε4 allele is associated with worse outcome of once established disease, via modulation of several disease mechanisms, including spread of tau pathology [99], neuroinflammatory response [98], and endo-lysosomal system dysfunction [100], which all are potent contributors to faster rate of dementia progression among ε4 carriers compared to non-carriers [21, 27, 86]. Besides LOAD, APOE polymorphism also affects the risk of occurrence and the rate of progression of several other neurodegenerative diseases including primary tauopathies, α-synucleinopathies, and age-related macular degeneration, but unlike LOAD, in some of these entities not the ε4 allele but the ε2 allele has been found to produce worse outcomes [46, 58, 128].
Prion diseases or prionoses are neurodegenerative proteinopathies, characterized by the accumulation of disease specific scrapieform conformer (PrP^Sc^), which sets off a neurodegenerative cascade including proinflammatory activation of microglia and astrocytes [3, 4, 15, 18, 42, 77] leading to widespread synaptic and neuronal loss and an ultimately fatal outcome [71, 85, 91]. PrP^Sc^ arises from the cellular prion protein (PrP^C^) in a process known as recycling propagation, in which PrP^Sc^ binds PrP^C^ during its recycling cycle between the plasma membrane and the endosomal compartment and forces PrP^C^ to adopt its own β-sheet-rich secondary conformation [40, 41, 48]. Transition between PrP^C^ and PrP^Sc^ conformers is gradual and associated with a number of physicochemical changes, including reduced detergent solubility, oligomerization, and acquisition of partial proteolytic resistance, which is a hallmark property of PrP^Sc^ [30, 40, 41, 78, 81, 115]. Prionoses affect both human and non-human mammalian species [2, 91]. The list of human prionoses include Creutzfeldt-Jakob disease (CJD), Gerstmann Straussler Scheinker syndrome, fatal familial insomnia, variably protease-sensitive prionopathy and kuru. Sporadic CJD (sCJD) with an annual incidence approximated at one case per million is the most common of the human prionoses [38, 67, 91]. Given several shared characteristics between sCJD and other neurodegenerative diseases, which include strong association with aging, misfolded protein centered pathology, and chronic neuroinflammatory activation, several past studies have explored how APOE polymorphism might influence the risk of sCJD occurrence. While some initial reports suggested a modest uptick in incidence among ε4 carriers [6, 118] this association was refuted by subsequent studies [72, 95, 126]. Expanding knowledge on the modulatory effects played by APOE alleles in various mechanisms of neurodegeneration and separating these mechanisms into those regulating the risk of disease occurrence from those affecting the rate of progression [119] merit a careful examination whether APOE polymorphism might influence the course of neurodegeneration in prionoses. However, the limited number of clinical cases and well-recognized complexity of human prion disease, which includes factors like codon 129 polymorphism, PrP^Sc^ subtypes, and variable presence of Aβ co-pathology [33, 79], render systematic analysis of the APOE polymorphism effect on disease progression in human prion entities arduous to conduct and inherently underpowered [126]. To control for these variables we used APOE targeted replacement (APOE-TR) mice, where both murine Apoe alleles are replaced by human APOE alleles [110], and infected them with 22L mouse adapted scrapie strain, which is an established and reliable laboratory model of prion disease featuring limited variability in disease latency and neuropathological metrics [8, 9, 77, 93]. Using this model, we determined the detrimental effect of the ε4 allele and to a lesser extent the ε2 allele on progression of neurodegeneration compared to the ε3 allele.
Material and methods
Material and reagents
Unless otherwise specified, all reagents and chemicals were purchased from Sigma-Aldrich (St. Louis, MO). Information on primary and secondary antibodies used for Western immunoblotting and immunohistochemistry is provided in Tables 1 and 2, respectively. Sequences of primers used for Reverse Transcription Quantitative Polymerase Chain Reaction (RT-qPCR) are listed in Table 3. All primers were made to order by Sigma-Aldrich.
Transgenic animals
All mouse care and experimental procedures were approved by Institutional Animal Care and Use Committees of the New York University Grossman School of Medicine. Apoe^−/−^, ε2/ε2, ε3/ε3, and ε4/ε4 strains have been detailed in previous publications [51, 127]. ε2/ε2, ε3/ε3, and ε4/ε4 lines are APOE targeted replacement mice, where both murine Apoe alleles are replaced by isogenic human APOE alleles and those remain expressed under the endogenous Apoe promoter. We maintain a colony of APP/PS1/Apoe^−/−^, APP/PS1/ε2/ε2, APP/PS1/ε3/ε3, and APP/PS1/ε4/ε4 mice, which are heterozygous for the APP/PS1 transgene [56, 75]. For this project we used non-transgenic offsprings from this colony, which did not carry the APP/PS1 transgene. All animals were subjected to genomic DNA analysis. They genotyped negatively for the APP/PS1 transgene, while their APOE genotype was confirmed by restricted fragment length polymorphism of the APOE amplification product as previously described [56]. All mice used in this study were on C57BL/6 background.
Experimental design
Prion disease was induced by intraperitoneal inoculation with 22L mouse adapted scrapie strain following our published protocols [77, 93]. Control animals were intraperitoneally inoculated with the normal brain homogenate (NBH). Mice were inoculated at the age of 10–12 weeks, maintaining ~ 50%:50% female: male ratio per each experimental group. Mice were euthanized at 23 weeks post inoculation (wpi.), when all 22L-inoculated groups displayed overt neurological signs of prion disease, while NBH inoculated control mice appeared healthy. A subset of 22L-inoculated mice also was euthanized at 15 wpi. when the mice remain presymptomatic, to assess accumulation of PrP^Sc^ in the lymphoreticular system (LRS) and characterize early stage of neuroinvasion. In the manuscript, 22L-inoculated mice euthanized at 15 and 23 wpi. are alternatively referred to as presymptomatic and symptomatic animals, respectively.
Prion inoculation, animals’ care, and behavioral testing
The 22L prion inoculum was prepared from the brains of C57BL/6 mice, which were infected with 22L mouse adapted scrapie strain and housed in an Animal Biosafety Level 2 facility until they reached the terminal stage of prion disease. Their brains were harvested and homogenized under sterile conditions in the tissue homogenization buffer (THB) maintaining 1:10 weight to volume ratio. The THB consists of 20 mM Tris-HCL pH 7.4, 250 mM sucrose, 1 mM ethylenediaminetetraacetic acid, 1 mM egtazic acid and 10 μg/mL of Complete Proteinase Inhibitor Cocktail (cOmplete) (Roche Life Science, Indianapolis, IN). After preparation, the inoculum was immediately aliquoted, flash-frozen, and stored at −80°C until use. NBH was prepared from the brains of healthy C57BL/6 mice following the same protocol. A single prepared batch of 22L inoculum and NBH was used for the entire study. For the inoculation, aliquots of the 22L inoculum or NBH were taken out from the cryostorage and thawed. Each animal received a single intraperitoneal injection containing 100 μL of either 22L inoculum or NBH. Remnants of the aliquots were never reused but neutralized with an excess of sodium hypochlorite and disposed.
Following the inoculation mice were kept in a pathogen-free Animal Biosafety Level 2 facility with 12/12-hour light/dark cycle and ad libitum food and water access. Their general health and well-being were assessed twice a week following established standards of good husbandry practice [12]. From 10 wpi. onward, mice were evaluated weekly for the first signs of prion disease using a parallel bar crossing test, which was carried out by two independent examiners blinded to APOE genotype and inoculum type. This testing evaluates an animal’s competency to cross a series of parallel bars that are 3 mm in diameter and set 7 mm apart. An animal displaying difficulties in initiating and/or completing this task in a timely and coordinated manner for three weeks in a row is considered clinically symptomatic and the first week that the positive score is assigned is considered the onset of clinical disease. Severity of neurological symptoms were longitudinally characterized using the Total Scrapie Score (TSS), which is an equally weighted composite of the following scorable metrics: somnolence, hind limb weakness, kyphosis, walk, and body condition. These behavioral metrics are scored based on the following criteria: 0 = normal, 1 = subtle, 1.5 = mild, 2 = moderate, 2.5 = advanced, and 3 = severe [16, 17, 77, 104]. Their sum constitutes the TSS, which ranges from 0 in healthy animals to 15 points in terminally sick ones. TSS was assessed on a weekly basis starting from the 100th day post-inoculation (dpi) by two independent examiners who remained blinded to the animal APOE genotype.
Animal euthanasia and tissue harvesting
At the conclusion of the experiment animals were euthanized by a single intraperitoneal injection of Euthasol (500 μl/kg) (Virbac AH, Inc.; Westlake, TX). Once they showed absence of pain and corneal responses, they were transcardially perfused with heparinized, ice-cold 10 mM phosphate-buffered saline (PBS) pH 7.4. Their brains were extracted from the skulls and carefully stripped from the dura and vessels under the AmScope stereoscopic microscope (AmScope, Chino, CA). The olfactory bulbs, the brain stem, and the cerebellum were removed, and the corpus callosum was dissected to separate the hemispheres. The cortical mantle including the hippocampus was dissected out from the left hemisphere and either flash-frozen and stored at −80°C or immediately used for RNA extraction. The total RNA was extracted using RNeasy Mini Kit (Qiagen Sciences Inc., Germantown, MD) following the manufacturer-provided protocol. The resulting extract was treated with 2 U of DNAse I per brain (Qiagen Sciences Inc.), flash frozen and stored at −80°C for transcriptomic analysis. The right brain hemisphere was cut in the frontal plane at ~ 1 mm anterior to the bregma. The rostral part was immersion-fixed in 2% phosphate-buffered formalin and embedded in paraffin. The caudal part was immersion fixed in 2% paraformaldehyde in 0.1 M phosphate buffer (PB), pH 7.4 at 4°C for a week and then dehydrated in a solution of 2% dimethyl sulfoxide and 20% glycerol in 0.1 M PB, pH 7.4 at 4°C until sectioning.
Western immunoblot analyses
Brain homogenate samples were removed from cryostorage, thawed, weighted, and homogenized in the THB maintaining 1:10 tissue weight to the THB volume ratio. A three-step homogenization protocol was followed where the tissue was first manually fragmented by grinding with a pestle, then triturated by repeated passing through a 28-gauge needle and finally sonicated. The remaining cellular fragments were cleared by centrifugation at 10,000 × g and 4°C for 3 min. The protein concentration in the resulting supernatant was measured by bicinchoninic acid (BCA) method using Pierce^™^ Micro BCA Protein Assay Kit (Thermo Fisher Scientific, Waltham, MA) according to the manufacturer’s protocol. Samples containing 5 μg of the total protein were resolved by sodium dodecyl sulfate-polyacrylamide gel electrophoresis (SDS-PAGE) under reducing conditions using 10% gels. Resolved protein was transferred onto nitrocellulose membranes, which were blocked overnight in 5% non-fat milk at 4°C and then incubated with primary and then horse radish peroxidase-conjugated secondary antibodies listed in Table 1. The membranes were treated with SuperSignal West Pico PLUS Chemiluminescent Substrate (ThermoFisher Scientific) and apposed to HyBlot CL^®^ autoradiography films (Thomas Scientific, LLC, Swedesboro, NJ), which then were developed. For immunoblotting of the apoE protein the Western blot protocol was modified by increasing the amount of the total protein in electrophoresed samples to 20 μg and using 5% soy milk for the overnight block. To confirm equal protein load, the nitrocellulose membranes were stripped with Restore^™^ Western Blot Stripping Buffer (Thermo Fisher Scientific) and immunoblotted against β-actin.
Autoradiography films were digitized at the resolution of 600 dots per inch and saved in TIFF format. Protein band optical densities (OD) were quantified using NIH ImageJ v2.1.0/1.53c (Bethesda, MD) following our previously established protocols [7, 77, 78]. For PrP protein analysis, OD of its three bands was totaled.
PrP detection
Aliquots of brain homogenate containing 10 μg of total protein were diluted with 10 mM PBS to the final protein concentration of 1 μg/μL and treated with Proteinase K (PK) (Roche Life Science) at 37°C for 45 min. maintaining 10:1 protein to enzyme weight ratio. PK activity was quenched by adding 4 μL of 100 mM phenylmethylsulfonyl fluoride (PMSF) per sample and placing the samples in ice bath for 5 min. Samples were centrifuged at 20,000 × g and 4°C for 45 min. Resulting pellets were resuspended in 20 μL of 10 mM PBS and 20 μl of sample buffer containing β-mercaptoethanol, boiled, and resolved on 12.5% SDS-PAGE. Following Western blot transfer, the PrP protein was immunodetected and densitometrically quantified as described above.
To detect the presence of PrP^Sc^ in the LRS we homogenized spleen tissue, which was first cut up into small pieces using a thin surgical blade and then thoroughly sonicated in Dulbecco’s phosphate buffered saline (DPBS) without Ca^2+^ and Mg^2+^ and supplemented with 10 μg/mL cOmplete. Remnants of unhomogenized tissue were cleared by centrifugation at 10,000 × g and 4°C for 3 min. and the protein concentration in the resulting supernatant was measured by the BCA method. Samples containing 500 μg of total protein were diluted with DPBS to obtain the final volume of 100 μL, mixed with equal volume of 4% Sarkosyl in DPBS, and incubated at 37°C for 10 min. with constant agitation in a ThermoMixer^®^ C (Eppendorf North America, Enfield, CT). Then, Benzon nuclease and MgCl_2_ were added to the final concentrations of 50 U/mL and 1 mmol/L, respectively, and the samples were incubated again at 37°C for 30 min. To enhance sensitivity of PrP^Sc^ detection, the total protein in the sample was precipitated with sodium phosphotungustic acid (NaPTA) [93, 94]. A 4% stock solution of NaPTA was prepared in 170 mmol/L MgCl_2_ and added to achieve the final NaPTA concentration of 0.3% in the sample. Samples were incubated at 37°C for 30 min. in a ThermoMixer^®^ C and then centrifuged at 15,800 × g and 4°C for 30 min. Resulting pellets were resuspended in 50 μL of 0.1% Sarkosyl in DPBS and sonicated for 30 sec. [93, 120]. Ten μL of sarkosyl solubilized pellet was mixed with 38 μL of PBS and digested by adding 2 μL of 1 μg/μL PK solution at 37°C for 45 min. PK activity was quenched by adding 6 μL of 100 mM PMSF per sample and placing the samples in ice bath for 5 min. PK-digested samples were centrifugated at 20,000 × g and 4°C for 45 min. Resulting supernatant was discarded while the pellets were resuspended in 20 μL of 10 mM PBS and 20 μL of sample buffer containing β-mercaptoethanol, boiled, and resolved on 12.5% SDS-PAGE. Following Western blot transfer, the PrP protein was immunodetected and densitometrically quantified as described above.
PrP detergent solubility assay
Fifty microliters of brain homogenate were mixed with 50 μL THB containing 1% Triton X-100 and 1% sodium deoxycholate and incubated on ice for 60 min. The samples were sonicated for 30 sec., incubated at 37°C for 60 min., and centrifuged at 10,000 × g at 4°C for 3 min. Protein concentration in the supernatant was assayed using the BCA method. Aliquots containing 100 μg of protein were diluted with 10 mM PBS to achieve 1μg/μL protein concentration and subjected to ultracentrifugation at 150,000 × g and 4°C for 60 min. using the TLA120.2 fixed-angle rotor in Optima TL ultracentrifuge (Beckman Coulter, Indianapolis, IN). Ultracentrifugated supernatant containing detergent soluble PrP fraction was transferred into new tubes, while the pellets containing detergent insoluble PrP fraction were solubilized by sonication in 100 μL of THB containing 0.5% Triton X-100 and 0.5% sodium deoxycholate. Ten microliters of the supernatant or 10 μL of the solubilized pellet were mixed with an equal volume of sample buffer containing β-mercaptoethanol, boiled, and resolved on 12.5% SDS-PAGE. Following Western blot transfer, the PrP protein was immunodetected and densitometrically quantified as described above.
Characterization of PrP oligomers
Brain homogenate samples containing 600 μg of total protein were diluted with 10 mM PBS to the final volume of 200 μL, mixed with 20 μL of 10% Sarkosyl and incubated on ice for 30 min. Then they were loaded on the top of the sucrose density gradient, which was formed in polyallomer centrifuge tubes by carefully layering 300 μL of 60%, 50%, 40%, 30%, 20% and 10% sucrose solution prepared in deionized water. Velocity sedimentation was performed using TLS-55 swinging-bucket rotor in an Optima TL ultracentrifuge (Beckman Coulter, Indianapolis, IN) at 200,000 × g and 4°C for 90 min. Fourteen fractions (145 μL each) were collected from the top to the bottom of each ultracentrifugated sample. Twenty microliters from each fraction were mixed with an equal volume of sample buffer containing β-mercaptoethanol, boiled, and resolved on 12.5% SDS-PAGE. Following Western blot transfer, the PrP protein was immunodetected and densitometrically quantified as described above. OD of the PrP signal in each fraction was converted to percentage value using the sum of OD values in all 14 fractions as denominator. Bovine serum albumin (molecular weight 68 kDa), alcohol dehydrogenase (150 kDa) and apoferritin (443 kDa) were used as molecular weight markers. They were subjected to the same velocity sedimentation, SDS-PAGE, and Western blot protocols as PrP oligomers and detected with InstantBlue Coomassie Protein Stain (ThermoFisher Scientific).
Immunoprecipitation and characterization of PrP/apoE complexes
M-280 Sheep anti-mouse IgG magnetic Dyanabeads^™^ (Thermo Fisher Scientific) were coated with anti-human apoE monoclonal antibody (mAb) HJ15.3 [44, 60, 103]. For each immunoprecipitated brain homogenate sample a 50 μL of manufacturer provided bead solution was mixed with 15 μg of the antibody and incubated in room temperature for 3 hrs. HJ15.3 coated beads were added to samples of brain homogenate containing 400 μg of total protein in 400 μL volume and incubated overnight at 4°C with constant mixing on a Roto-Bot programmable rotator (Benchmark Scientific, Sayreville, NJ). On the following day, the beads were magnetically separated, washed with 10 mM PBS pH 7.4, and incubated in a solution containing 0.05 M Tris-HCL pH 8.0, 0.15 M NaCl and 2% Sarkosyl for 30 min. in room temperature with constant mixing to remove nonspecifically bound brain proteins. This step was followed by additional 30-min. and 5-min. incubations in 0.05 M Tris-HCl solution pH 8.0 containing 0.5 M NaCl and 1% Sarkosyl in room temperature, with constant mixing. Finally, the beads were magnetically separated and resuspended in 20 μL of 10 mM PBS and 20 μL of sample buffer containing β-mercaptoethanol, boiled, and resolved on 12.5% SDS-PAGE. Following Western blot transfer, the PrP protein was immunodetected as described above. To confirm the presence of the apoE protein in immunoprecipitated complexes, the nitrocellulose membranes were stripped with Restore^™^ Western Blot Stripping Buffer (Thermo Fisher Scientific) and immunoblotted with anti-human ApoE goat polyclonal antibody (Table 1).
Histology, immunochemistry, and quantitative neuropathology
Paraffin blocks containing the rostral portion of the right hemisphere were cut into 5-μm-thick coronal sections, which were then stained with hematoxylin-eosin. The load of spongiform lesions in the M1 primary motor cortex was quantified at three approximated bregma levels (+ 1.0 mm, + 1.2 mm, and + 1.4 mm) following our previously published protocols [77]]. The caudal portion of the right hemisphere was cut serially using a freezing microtome (Leica Microsystems, Weltzer, Germany) into 40-μm-thick coronal sections, which were alternately collected into 10 series and stored in a cryoprotectant solution consisting of 30% ethylene glycol and 30% sucrose in 0.1M PB, pH 7.4. Randomly selected series of sections were immunostained against the following antigens [1] cluster of differentiation (CD) 230 (a.k.a. prion protein [PrP]), [2] ionized calcium adaptor protein 1 (IBA1), [3] cluster of differentiation (CD) 68, [4] glial fibrillary acidic protein (GFAP), and [5] complement component 3 (C3) in combination with GFAP. An antigen retrieval protocol was used for all immunostainings and involved incubating the sections in 10 mM sodium citrate pH 6.0 with 0.05% Tween 20 at 85°C for 15 min. For anti-CD230 immunostaining, sections were additionally incubated in 98% formic acid at room temperature for 10 min. to disrupt β-sheet-pleated secondary structure of the PrP^Sc^ conformer. Non-specific staining was reduced using a blocking mixture which contained 10% normal goat serum, 1% bovine serum albumin and 0.3% Triton X-100 in 10 mM PBS pH 7.4 in room temperature for two hours. For mouse-derived primary antibodies, the mouse-on-mouse blocking reagent (Vector Laboratories; Burlingame, CA) was added to the blocking mixture at the amount of 1.5 μL per 1mL. The list of primary antibodies and fluorochrome-conjugated secondary antibodies, along with their working dilutions is provided in Table 2. Double anti-GFAP/anti-C3 immunostaining was performed using a mixture of primary antibodies to respective antigens, followed by a mixture of fluorochrome-conjugated secondary antibodies. All immunostainings were carried out on free floating sections. Sections were washed thrice with excess 10 mM PBS pH 7.4 and 0.1% Triton X-100 between each step of the protocol. Immunostained sections were carried onto glass histological slides, briefly air-dried, and coverslipped using Depex mounting medium (Thermo Fisher Scientific, Waltham, MA). They were digitized and subjected to quantitative analysis following our published protocols [75–77]. Quantitative metrics included [1] integrated density (ID) of anti-CD230 (PrP) immunostaining, the load of [2] IBA1^+^ and [3] CD68^+^ microglia, [4] the load of GFAP^+^ astrocytes, and [5] ratio of C3^+^ to GFAP^+^ immunostaining in astrocytes. All quantitative analyses were performed in the S1 primary somatosensory cortex at three approximated bregma levels (0.0 mm, −0.4 mm, and − 0.8 mm).
NanoStringTM nCounter® analysis of glial transcript
Aliquots of previously isolated total RNA were removed from − 80°C cryostorage and assayed for purity and integrity using a 2100 Bioanalyzer (Agilent Technologies Inc., Santa Clara, CA). Only samples with the RNA Integrity Number ≥ 7 were used for gene expression analysis. RNA concentration in the samples was determined by NanoDrop^™^ 2000 spectrophotometer (Thermo Fisher Scientific). The nCounter Mouse Glial Profiling Panel (NanoString Technologies, Inc., Seattle, WA) was used to assess the expression of 770 glia specific genes in samples containing 100 ng of total RNA. This analysis was carried out by the Genome Technology Center at NYU Grossman School of Medicine using nCounter MAX Analysis System. Gene expression data were analyzed using nSolver Analysis Software v4.0 (NanoString Technologies Inc.) and included only genes consistently producing a read of ≥ 25 counts per brain. Raw counts were normalized using 13 internal reference genes as described before [77]. Gene expression heatmaps were created using the nSolver Analysis Software v4.0, which also was used for cluster analysis of individual animals. In addition, we computed a fold change for each analyzed gene in 22L-infected animals relative to their APOE-matched NBH inoculated controls.
Reverse Transcription Quantitative Polymerase Chain Reaction (RT-qPCR) analysis
Two micrograms of total RNA per brain were reverse transcribed into cDNA using an iScript^™^ Advanced cDNA Synthesis Kit (Bio-Rad Laboratories, Hercules, CA). Sequences of primers used to determine the expression of target and housekeeping genes are listed in Table 3. Their amplification efficiency was vetted and optimized to remain within the 90% to 110% range. The qPCR was performed using SsoAdvanced Universal SYBR Green Supermix on the CFX96 Real-Time System (Bio-Rad Laboratories). Differences in gene expression were analyzed using ΔΔCt method [65, 77].
Statistical analysis
Disease latency time was analyzed using Kaplan-Meier estimator and the differences across APOE genotypes were compared using Log-Rank test. Differences in the total scrapie score and its components were tracked longitudinally and analyzed by repeated measures analysis of variance (ANOVA). Data distribution of individual, quantitative metrics was vetted using Kolmogorov-Smirnov and Shapiro-Wilk tests to assess conformity with the normal distribution pattern. Differences across multiple data sets were first analyzed with one-way ANOVA, which was followed by Holm-Sidak’s post hoc test, comparing pairs of individual experimental groups. Sex differences within individual experimental groups were tested with the help of unpaired t-test with Welch’s correction. Differences in the PrP signal distribution across 14 fractions resulting from sucrose density gradient centrifugation of brain homogenate were determined using the Kolmogorov-Smirnov test between each pair of experimental groups. GraphPad Prism (v10.4.1 for Windows, GraphPad Software, Boston, MA) was used for all statistical analyses and graph making.
Results
APOE genotype modulates latency, symptom progression, and pathology burden in a mouse model of prion disease
The latency period of prion disease was determined through serial locomotor testing, and the differences across animals of different APOE genotypes were compared using the Kaplan-Meier estimator. The ε4/ε422L mice were the first to show neurological signs of the prion disease with a median latency of 115.0 days in females and 113.5 days in males. The ε2/ε222L mice were second to be affected with a median latency of 135.0 days in females and 131.5 days in males, followed by ε3/ε322L mice, where the median latency was 136.0 days for both sexes. Differences across APOE genotypes both for female and male animals were statistically significant (Fig. 1a), while female and male mice of the same APOE genotype showed no significant differences (Supplementary File 1; Fig. S1). To quantify progression and severity of neurological symptoms we conducted serial assessments using the Total Scrapie Score (TSS) in a subset of 22L-infected mice. The TSS is a 15-point cumulative scale, accounting for five scorable behavioral metrics: animal alertness (somnolence), hind limb weakness, posture (kyphosis), walking competency, and body condition. Both ε4/ε422L females and males showed the most aggressive tempo of disease progression compared to mice of other APOE genotypes. At 23 weeks post inoculation (wpi.), which was the final time point of the experiment, ε4/ε422L females scored on average 13.8 ± 0.1 pts. on the TSS scale (p < 0.0001 vs. ε2/ε222L and ε3/ε322L), while ε4/ε422L males scored 13.1 ± 0.1 pts. (p < 0.0001 vs. ε2/ε222L and ε3/ε322L) (Fig. 1b). ε2/ε222L mice scored worse than ε3/ε322L mice, with females and males scoring an average of 9.8 ± 0.1 pts. (p < 0.0001 vs. ε3/ε322L) and 9.7 ± 0.2 pts. (p < 0.0001 ε3/ε322L), respectively. At 23 wpi. TSS scores in ε3/ε322L females and males were 7.8 ± 0.1 pts. and 8.3 ± 0.1 pts., respectively. The ε4 > > ε2 > ε3 APOE allele gradient effect was consistent across all five individual components of the TSS, with the most prominent differences in respect to alertness, walk, and body condition (Supplementary File 1: Fig. S2 a, b). Differences in the TSS and its individual components between APOE genotype matched female and male mice were not statistically significant.
To ensure that differences in disease latency and the tempo of symptoms progression across mice of different APOE genotypes are not caused by variable accumulation of PrP^Sc^ in the LRS, we assayed the level of PK-resistant PrP^Sc^ in the spleen homogenate. In presymptomatic 22L-infected mice, which were killed at 15 wpi., PrP^Sc^ was readily detectable in the spleen, but its level did not significantly differ across APOE genotypes (Supplementary File 1: Fig. S3 a, b). In NBH-inoculated control animals no PK-resistant PrP^Sc^ signal was detectable.
To determine the effect of the APOE genotype on the burden of prion pathology in the brain we quantified the load of spongiform lesions in the M1 motor cortex. Presymptomatic 22L-infected mice showed only a limited number of spongiform lesions. In contrast, symptomatic mice, euthanized at 23 wpi. featured numerous spongiform lesions, which load was significantly affected by the APOE genotype. In ε4/ε422L mice the spongiform lesion load was 1.24- and 1.44-fold higher than that in ε2/ε222L and ε3/ε322L animals (p < 0.0001), respectively; with the difference between the two latter groups being significant (p < 0.05) (Fig. 1c, d). We also analyzed, the integrated density (ID) of anti-PrP immunostaining in the S1 somatosensory cortex. Not presymptomatic, but symptomatic 22L-infected mice showed a significant increase in the anti-PrP ID values relative to NBH controls, and this effect was APOE genotype dependent (Fig. 1e, f). ε4/ε422L mice had 2.0 and 2.6- fold higher values of anti-PrP ID compared to ε2/ε222L and ε3/ε322L animals (p < 0.0001), respectively; with the difference between the latter two groups not reaching statistical significance. Differences in the spongiform lesion load and the anti-PrP ID values between female and male animals for matching APOE genotypes, inoculum type, and the survival time were not statistically significant (Supplementary File 1: Fig. S4 a, b).
The APOE ε4 allele is associated with greater PrP accumulation, PrPSc conversion, and aggregation
Prion pathology is invariably associated with an increase in the brain total PrP protein level and the appearance of its PK-resistant conformer PrP^Sc^. The total PrP level showed no differences across NBH-inoculated control mice of various APOE genotypes and no significant increase in presymptomatic 22L-infected mice, at 15 wpi. In contrast, symptomatic 22L-infected mice, euthanized at 23 wpi., featured a marked increase in the total brain PrP level by ~ 4- to ~ 5- folds compared to APOE matched NBH controls (p < 0.0001) (Fig. 2a, b). The highest total PrP level was found in ε4/ε422L mice, and it was 1.2- and 1.3-fold higher than those in ε2/ε222L (p < 0.01) and ε3/ε322L (p < 0.0001) animals, respectively; with the difference between the two latter groups not reaching statistical significance. The PrP^Sc^ conformer was undetectable by the PK-digestion assay in the brains of NBH-controls and presymptomatic 22L-infected mice. In contrast, in symptomatic 22L-infected mice PrP^Sc^ was abundantly detected, and its level was significantly potentiated by the presence of the ε4 allele (Fig. 2c, d). ε4/ε422L mice featured 1.24- and 1.37-fold higher PrP^Sc^ level compared to ε2/ε222L (p < 0.01) and ε3/ε322L mice (p < 0.001), respectively; with the difference between the two latter groups not reaching statistical significance.
Using the detergent solubility assay, we characterized solubility changes the PrP protein undergoes during the PrP^C^ to PrP^Sc^ transformation. Brains from NBH and presymptomatic 22L-infected mice showed no evidence of detergent insoluble PrP protein. In symptomatic, 22L-infected mice detergent insoluble PrP, was not only abundantly present, but its amount well exceeded that detected in the detergent soluble fraction. The highest ratio of detergent insoluble to detergent soluble PrP was in ε4/ε422L mice (9.4 ± 0.8) and it was significantly higher than those in ε2/ε222L mice (6.7 ± 0.4) (p < 0.001) and in ε3/ε322L mice (5.7 ± 0.7) (p < 0.0001) (Fig. 2e, f). The difference between ε2/ε222L and ε3/ε322L mice was not statistically significant. Differences in the total PrP level, PrP^Sc^ level, and the insoluble to soluble PrP ratio between female and male mice for matching APOE genotype, inoculum, and survival time were not statistically significant (Supplementary File 1: Fig. S5 a-c).
We also investigated the effect of APOE genotype on PrP oligomerization by subjecting brain cortex homogenate to sucrose gradient centrifugation. The resulting 14 fractions were individually collected and resolved using SDS-PAGE under reducing conditions and immunoblotted for PrP (Fig. 3a, b). Brains from NBH-inoculated and symptomatic, 22L-infected ε2/ε2, ε3/ε3, and ε4/ε4 mice were examined along with those from Apoe^−/−^ mice. In NBH controls, the PrP signal was detectable only in fractions 1–4 and its distribution showed no statistically significant differences across APOE genotype (Fig. 3c; Supplementary File 2: Table S1). In contrast, in 22L-infected mice, the PrP signal was detected across all 14 fractions, and its distribution bore a significant ε4 effect (Fig. 3d). The ε4/ε422L mice featured the most pronounced, right-sided shift in the PrP signal distribution across the 14 fractions compared to any other 22L-infected APOE genotype or Apoe^−/−^ animals (p < 0.0001). Differences in the PrP signal distribution pattern between Apoe^−/−^22L and ε2/ε222L or ε3/ε322L mice were insignificant. A statistically significant difference was noted only between ε2/ε222L and ε3/ε322L mice (p < 0.01) owing to the most left-sided shift in the signal distribution in the latter group. To better visualize the ε4 effect in 22L-infected mice we grouped the fractions into four clusters 1–4, 5–7, 8–10, and 11–14, and showed the proportional contribution of each cluster to the total PrP signal in all 14 fractions using pie charts (Fig. 3e). In ε4/ε422L mice, the cluster 11–14 contributed 25.7% of the total PrP signal, while for comparison in ε2/ε222L, ε3/ε322L, and Apoe^−/−^22L groups its contribution ranged from 12.4% to 13.8%. Conversely, the cluster 1–4 in ε4/ε422L mice constituted 32.3% of the total PrP signal, while in ε2/ε222L, ε3/ε322L, and Apoe^−/−^22L groups its contribution ranged from 41.7% to 49.8%. This experiment demonstrates that while PrP oligomerization is an inherent feature of the prion proteinopathy, it is promoted only in the presence of the ε4 allele, as there are no significant differences between Apoe^−/−^22L and ε2/ε222L or ε3/ε322L animals.
Increase in the apoE protein level and formation of the PrP/apoE complexes during prion infection is APOE genotype dependent
Consistently with previously published data, we found a significant effect of the APOE genotype on the brain apoE protein level in NBH control mice. ε2/ε2NBH animals featured 1.2- and 1.5- fold higher apoE level compared to ε3/ε3NBH (p < 0.05) and ε4/ε4NBH mice (p < 0.0001) (Fig. 4a; Supplementary File 1: Fig. S6), respectively; with the difference between ε3/ε3NBH and ε4/ε4NBH mice being statistically significant (p < 0.01). Prion infection gave rise to a significant increase in the brain apoE level in symptomatic (23 wpi.) but not in presymptomatic (15 wpi.) animals (Fig. 4a, b). The magnitude of this increase varied across APOE genotypes, and it was the highest in ε4/ε422L mice, where the level of apoE protein rose 1.6-fold relative to ε4/ε4NBH controls (p < 0.0001). Both in ε2/ε222L and ε3/ε3_22L_ mice the increase in apoE level was 1.3-fold relative to ε2/ε2NBH (p < 0.01) and ε3/ε3NBH (p < 0.05) controls, respectively. Animal sex had no significant effect on the brain apoE level, neither in NBH-controls nor in 22L-infected mice (Supplementary File 1: Fig. S7).
To determine whether apoE directly interacts with PrP, we immunoprecipitated the apoE/PrP complexes from the brain cortex homogenate using magnetic beads coated with HJ15.3 mAb, which reacts with the human apoE sequence. Captured complexes were resolved on SDS-PAGE under reducing conditions and the resulting monomeric PrP was detected using anti-CD230 clone 6D11 mAb (Fig. 4c). The PrP signal was detected in symptomatic ε2/ε222L, ε3/ε322L, and ε4/ε422L mice, but not in NBH-inoculated controls.
Optical density (OD) of the PrP protein band released from the complexes in ε4/ε422L mice was ~ 1.6-fold higher compared to ε2/ε222L or ε3/ε322L mice (p < 0.0001) (Fig. 4d), while the difference between the latter two groups was not statistically significant. We also quantified the PrP/apoE OD ratio by dividing the PrP protein band OD by that of apoE, which was detected on the same membrane as PrP, following membrane stripping and re-probing with goat polyclonal anti-human apoE antibody. The PrP/apoE OD ratio in ε4/ε422L mice was 2.8- and 1.7- fold higher than those in ε2/ε222L and ε3/ε322L mice (p < 0.05) (Fig. 4e), respectively, while the difference between the latter two groups was not statistically significant. As additional negative experimental controls, we used brain cortex homogenate from Apoe^−/−^NBH and Apoe^−/−^22L animals, in which no apoE/PrP complexes were detected. Our findings indicate that the apoE protein directly interacts with PrP but only in prion disease and not under physiological conditions.
Microglia activation is differentially regulated by the APOE genotype
Microglia activation was characterized by unbiased quantification of IBA1- and CD68-positive microglia load in the S1 somatosensory cortex alongside transcriptomic analysis of microglia specific genes. Presymptomatic, 22L-infected mice (15 wpi.) already showed a modest, but statistically insignificant increase in the IBA1 and CD68 load relative to NBH-inoculated controls. A robust and significant increase in the IBA1 and CD68 load was observed in symptomatic 22L-infected mice (23 wpi.), and this effect was APOE genotype dependent (Fig. 5a–d). The strongest activation of microglia was noted in ε4/ε422L mice, which had a 1.32- and 1.64-fold greater IBA1 load relative to the ε2/ε222L (p < 0.0001) and ε3/ε322L (p < 0.0001) mice, respectively. Likewise, ε4/ε422L mice showed 1.04-fold and 1.17-fold greater CD68 load relative to ε2/ε222L (non-significant) and ε3/ε322L (p < 0.05) mice, respectively. The value of IBA1 load in ε2/ε222L mice was significantly higher than that in ε3/ε322L mice (p < 0.0001), while the difference in the CD68 load insignificantly favored ε2/ε222L animals. It is noteworthy that the increase in the IBA1 load in symptomatic 22L-infected mice relative to their APOE-matched NBH controls ranged between 1.7-fold and 2.8-fold, while the increase in the CD68 load ranged between 16.4-fold and 22.7-fold. Differences in the IBA1 and CD68 load values between female and male animals for matching APOE genotypes, inoculum type, and the survival time were not statistically significant (Supplementary File 1: Fig. S8 a, b).
Transcriptomic analysis included microglial genes, which were significantly upregulated in at least one APOE genotype within the symptomatic 22L-infected group compared to APOE-matched NBH controls (Supplementary File 2: Table S2). Significantly upregulated genes were grouped into three functional categories 1) activated microglia markers (Aif1, Csf1r, Cst7, P2ry12, Siglech, and Tmem119), 2) genes involved in immune response (C1qa, C1qb, C1qc, C4a/b, C3ar1, Csf3r, Csf1, and Ccl3), 3) and those encoding various microglia recognition receptors (Axl, Cx3cr1, Fcrls, Clec7a, Mertk, P2ry6, Stab1, Trem2, and Tyrobp). Hierarchical cluster analysis of all genes showed no systematic clustering across individual NBH animals. In contrast, 22L-infected animals featured a strong hierarchical signal (Fig. 6a). First, the animals clustered within their APOE genotypes, and then ε2/ε222L and ε4/ε422L animals clustered together separate from ε3/ε322L animals. We also compared differences in the fold increase of individual gene expression across APOE genotypes. ε4/ε422L mice showed significantly higher upregulations of all genes compared to ε3/ε322L mice and Aif1, C1qa, C1qb, C1qc, C4a/b, C3ar1, Csf1, Fcrls, Mertk, P2ry6, Stab1 genes compared to ε2/ε222L mice (Fig. 6b–d). Aif1, Cst7, P2ry12, Tmem119, C1qb, C1qc, Ccl3, Cx3cr1, Fcrls, Clec7a, Trem2, and Tyrobp genes were expressed at significantly higher level in ε2/ε222L mice compared to ε3/ε322L mice. Cst7, C4a/b, Ccl3, and Clec7a were found to be upregulated at particularly high level (≥ 10-fold relative to NBH controls) in at least one of the APOE genotypes (Supplementary File 2: Table S2).
APOE genotype differentially modulates activation of astrocytes during prion infection
Astrocytic activation was characterized by determining changes in the GFAP protein level by quantitative immunoblotting, unbiased quantification of GFAP and C3-positive astrocyte load in the S1 somatosensory cortex and transcriptomic analysis of astrocyte specific genes. GFAP protein level showed no differences across APOE genotypes in NBH-inoculated controls. In presymptomatic 22L-infected mice (15 wpi.), it was modestly, albeit insignificantly increased (1.1–1.2-fold), while in symptomatic 22L-infected mice (23 wpi.) its level ranged between 2.2-fold and 3.1-fold relative to APOE-matched NBH controls (p < 0.0001) (Fig. 7a, b). Differences across APOE genotypes in symptomatic 22L-infected mice were statistically significant with ε4/ε422L mice featuring 1.3- and 1.4-fold higher GFAP protein level compared to ε2/ε222L (p < 0.001) and ε3/ε322L mice (p < 0.0001), respectively; while the difference between the latter two groups was not significant.
The load of GFAP positive astrocytes in the S1 somatosensory cortex was already significantly increased in presymptomatic 22L-infected mice (15 wpi.) (p < 0.0001) (Fig. 7c, d), but without any significant APOE genotype effect. Symptomatic 22L-infected mice (23 wpi.) featured further increase in the GFAP load, which ranged between 20.1- and 32.1-fold relative to NBH controls (p < 0.0001). ε4/ε422L mice had a 1.3- and 1.4-fold higher GFAP load compared to ε2/ε222L (p < 0.0001) and ε3/ε322L mice (p < 0.0001), respectively, and the difference between the latter two groups was statistically significant (p < 0.01). We also quantified the load of C3-positive astrocytes and analyzed it in relation to the GFAP load (Fig. 7e, f). In NBH-inoculated control mice, C3-positive astrocytes were absent. For the first time, expression of C3 in astrocytes was noted in presymptomatic 22L-infected mice, where the C3/GFAP ratio ranged between 0.08 and 0.11 across APOE genotypes (p < 0.01 to p < 0.0001 vs. NBH). In symptomatic 22L-infected mice, the C3 expression increased further with C3/GFAP ratio reaching values of 0.49 to 0.71 across APOE genotypes (p < 0.0001 vs. NBH or 22L at 15 wpi). Differences in the C3/GFAP ratio showed a significant APOE-genotype effect in symptomatic but not in presymptomatic animals. Symptomatic ε4/ε422L mice featured 1.2- and 1.4-fold higher values of the C3/GFAP ratio compared to ε2/ε222L (p < 0.0001) and ε3/ε322L mice (p < 0.0001), respectively; with the difference between the latter two groups also being statistically significant (p < 0.05). There were no statistically significant differences in respect to the GFAP protein level, the GFAP-positive astrocyte load, and the C3/GFAP ratio between female and male animals for matching APOE genotype, inoculum type, and survival time (Supplementary File 1: Fig. S9 a-c).
Transcriptomic analysis included those astrocytic genes, which were significantly upregulated in at least one APOE genotype in symptomatic 22L-infected mice relative to their APOE-matched NBH controls (Supplementary File 2; Tab S3). Analyzed genes were grouped into four functional categories: 1) markers of reactive astrocytes (Aldh1l1, Aqp4, Gfap, Serpina3n, Slc1a3, Sox9, Vim), 2) genes involved in antigen presenting and processing (H2-D1, H2-T23, Tap1), 3) genes involved in immune response (Ccl12, Cd14), and 4) those encoding astrocytic markers, whose expression is induced by interferons (Stat1, Stat2, Stat3, Gbp2, Psmb8). Hierarchical cluster analysis of all genes showed no systematic clustering across individual NBH-inoculated animals. ε3/ε322L mice clustered separately from ε2/ε222L and ε4/ε422L mice, which clustered together. All NBH animals clustered separately from 22L-infected animals (Fig. 8a). We also compared differences in the fold increase of individual genes across APOE genotypes. ε4/ε422L mice showed significantly greater expression of all genes compared to ε3/ε322L mice except for Tap1 and Gbp2 (Fig. 8b–e). ε4/ε422L mice also showed significantly greater expression of Aldh1l1, Gfap, Serpina3n, Vim, H2-D1, H2-T23, Ccl12, Stat2, and Stat3 compared to ε2/ε222L mice. Aldh1l1, Aqp4, Tap1, Ccl12, Cd14, and Psmb8 genes were upregulated at significantly higher level in ε2/ε222L mice compared to ε3/ε322L mice. Gfap, Serpina3n, Vim, and Ccl12 were upregulated at particularly high level (≥ 10-fold relative to NBH controls) in at least one of the APOE genotypes (Supplementary File 2: Table S3).
APOE genotype differentially regulates reciprocal proinflammatory crosstalk between microglia and astrocytes
Chronically reactive microglia secrete a triad of cytokines IL1-α, TNFα, and C1QA, which stimulate reactive astrocytes. These in turn secrete C3, which reciprocally stimulates neurodegenerative microglia. We explored the effect of APOE genotype on this pathway in prion infected mice using qRT-PCR (Fig. 9a–c). We compared the expression of Il1α, Tnfα, C1qa, and C3 genes alongside expression of genes which are considered transcriptomic markers of neurodegenerative microglia phenotype (Aif1, C3ar1, and Cx3cr1) and those specifically associated with chronically reactive astrocytes (Gfap, Ccl12, and Ccl2). No changes in expression level of any of these genes were found in presymptomatic 22L-inoculated mice (15 wpi.) compared to NBH-inoculated controls for matching APOE genotypes. In contrast, symptomatic 22L-inoculated mice (23 wpi.) showed significant upregulation of all interrogated genes with significant differences across the APOE genotypes. The highest expression of all the genes was found in ε4/ε422L mice with differences between ε4/ε422L mice and ε2/ε222L and ε3/ε322L mice being statistically significant for all genes (p < 0.05 to p < 0.0001) except for Cx3cr1 (ε4/ε422L vs. ε3/ε322L). Expression of Il1α, C1qa, C3, Aif1, Cx3cr1 and Ccl12 genes was significantly higher in ε2/ε222L mice compared to ε3/ε322L animals (p < 0.05 to p < 0.01).
Discussion
By infecting APOE-TR mice with 22L mouse adapted scrapie strain, we identified a differential effect of human APOE alleles on prion induced neurodegeneration. ε4/ε422L mice featured the shortest disease latency, the fastest progression of neurological symptoms, the worst neurological score at the end of the study, and the highest load of spongiform lesions, PrP^Sc^ level, and neuroinflammatory response. In addition, we found that ε2/ε222L mice performed worse in respect to behavioral, neuropathological, and neuroinflammatory metrics compared to ε3/ε322L animals, which suggests the ε2 allele might be a disadvantageous rather than protective determinant in prion pathology. Examination of spleens and brains of presymptomatic mice euthanized at 15 wpi., showed no evidence of differential effect of APOE alleles on PrP^Sc^ accumulation in the LRS or early brain pathology. This indicates prion neuroinvasion is independent of the APOE polymorphism and the variance we observed in disease outcomes results from differential effect of the APOE polymorphism on ensuing brain pathology. This is an important observation since apoE is expressed by the spleen’s dendritic cells [5]], which are known to replicate PrP^Sc^ and constitute its reservoirs outside the central nervous system [10, 83].
Conformational transformation of PrP^C^ into PrP^Sc^ is central to prion pathogenesis and involves several physicochemical changes within the PrP protein, which include reduced detergent solubility, oligomerization, acquisition of proteolytic resistance, and accumulation [30, 40, 41, 78, 81, 115]. ε4/ε422L mice featured significantly higher level of the total brain PrP, confirmed both by quantitative immunohistochemistry and Western immunoblotting, PK-resistant PrP^Sc^, and insoluble PrP fraction compared to ε2/ε222L and ε3/ε322L animals, in which values of these metrics were similar. Characterization of PrP oligomeric assemblies performed using sucrose density gradient centrifugation of brain homogenate detected PrP signal only in fractions 1–4 in NBH inoculated controls while in 22L infected mice the PrP signal was predominantly present in fractions 8–14. Apoe^−/−^22L, ε2/ε222L, and ε3/ε322L mice showed similar pattern of PrP signal distribution across all 14 fractions, what suggests apoE is not a prerequisite for PrP oligomer formation since these are detectable in Apoe^−/−^22L mice. However, ε4/ε422L animals featured a distinctly different PrP distribution pattern characterized by significantly increased signal in fractions 11–14, which represent higher order oligomers (+ 10-mers). This finding indicates that apoE4 isoform effectively promotes PrP oligomerization.
Consistent with several published studies, we found the brain level of apoE protein is APOE genotype dependent, with ε2/ε2NBH and ε4/ε4 NBH animals representing opposite ends of the spectrum [28, 63, 109, 116]. The mechanism(s) underlying this phenomenon have not been fully elucidated, though differential receptor mediated clearance of various apoE isoforms has been postulated to play a central role. We previously showed that prion pathology is associated both with an increase in the brain apoE level and cell-type shift in apoE expression [77]. While under physiological conditions the bulk of brain apoE is produced by resting or A0 astrocytes, their activation is associated with reduced apoE expression [77]. Conversely, while resting (M0) microglia do not produce apoE, de-repression of apoE translation is an unique characteristic of their reactive states commonly referred to as disease-associated microglia (DAM) or microglia neurodegenerative phenotype (MGnD) [49, 53]. In all three APOE-TR lines, prion pathology was associated with increase in the total brain apoE level, but the magnitude of this effect was APOE-genotype dependent. While ε2/ε222L, and ε3/ε322L mice featured a similar fold change relative to their APOE genotype matched NBH controls, the relative increase in ε4/ε422L mice was significantly higher. Notably ε4/ε422L animals featured the highest degree of microglia and astrocyte activation compared to ε2/ε222L, and ε3/ε322L mice, what reasonably can explain the highest relative increase in apoE level in this line.
Using immunoprecipitation assay, we found apoE protein and disease-altered PrP form complexes, which become dissociated under reducing conditions. ApoE/PrP complexes were immunoprecipitated using HJ15.3 anti-apoE clone [44, 60, 103] and detected using 6D11 anti-PrP clone [93, 102]. Interestingly, the immunoprecipitation experiment did not work in reverse where 6D11 and HJ15.3 clones were used as the capture and the detection antibodies, respectively. This suggests, binding of apoE to PrP might hinder the 6D11 epitope comprised of residues 97–100 (QWNK) of murine PrP [102]. This epitope is known to be conserved between mouse and human sequences and corresponds to residues 98–101 of the latter [93], which implies similar interaction between apoE and PrP might take place in human prionoses. It is noteworthy that the 6D11 PrP epitope also was proposed to interact with Aβ oligomers, while its hindrance was shown to prevent binding of Aβ oligomers to excitatory synapses and reduce intraneuronal tau phosphorylation and aggregation [57, 117]. The amount of PrP, which was released from immunoprecipitated complexes under reducing conditions was similar between ε2/ε222L, and ε3/ε322L mice but significantly higher in ε4/ε422L animals. This increased ratio between apoE and PrP in ε4/ε422L mice suggests stronger interaction between PrP and apoE4 than between PrP and other apoE isoforms and might explain the propensity for increased formation of large order oligomers observed in ε4/ε422L animals. Since no apoE/PrP complexes were detected in NBH-inoculated control, it is likely that disease specific changes in the PrP protein conformation and/or changes in its physicochemical properties constitute prerequisites for the interaction with apoE. Taking it together, we found numerous aspects of PrP proteinopathy that were significantly enhanced in the presence of the ε4 allele including elevated levels of the total PrP, PrP^Sc^, detergent insoluble PrP, enhanced PrP oligomerization and evidence of increased complexing of pathologically altered PrP with apoE, which constitute one important mechanism, through which the ε4 allele negatively affects the outcome of prion disease. The isoform-specific interaction between apoE and various disease-specific misfolded proteins is a recognized mechanism through which apoE propagates aggregation and deposition of these proteins. Besides a well-established effect of apoE directly interacting with Aβ and particularly apoE4 promoting Aβ oligomerization and fibrillization [66, 92, 96, 106, 108], there is evidence derived both from transgenic animal and in vitro studies apoE4 may directly promote α-synuclein aggregation [31, 36]. In contrast, in vitro studies have identified that recombinant as well as lipidated, apoE2 and to a lesser extent apoE3, but not apoE4 form complexes with recombinant human tau [105, 107, 128].
Prion pathology is inherently associated with early and robust inflammatory activation of astrocytes and microglia [3, 4, 15, 18, 42, 77]. In fact, GFAP-reactive astrogliosis was the first neuropathological metric clearly showing a significant increase in presymptomatic APOE-TR mice at 15 wpi. We found a strong APOE genotype effect on the magnitude of microglia and astrocyte activation both reflected by differences in the load of activated microglia and astrocytes and differences in microglia and astrocyte specific transcript. Characterization of the transcript using a nanoStringTM nCounter^®^ analysis showed significant upregulation in a number of microglia specific genes, canonically categorized as markers of microglia activation (Aif1, Csf1r, Cst7, and Siglech), genes involved in immune response (C1qa, C1qb, C1qc, C4a/b, C3ar1, Csf3r, Csf1, and Ccl3), and those encoding various microglia recognition receptors (Axl, Cx3cr1, Fcrls, Clec7a, Mertk, P2ry6, Stab1, Trem2, and Tyrobp). Similarly, several categories of astrocyte specific genes were upregulated including reactive astrocyte markers (Aldh1l1, Aqp4, Gfap, Serpina3n, Slc1a3, Sox9, Vim), genes involved in antigen presenting and processing (H2-D1, H2-T23, Tap1), genes involved in immune response (Ccl12, Cd14), and those encoding astrocytic markers, which expression is induced by interferons (Stat1, Stat2, Stat3, Gbp2, Psmb8). Nearly all these genes were expressed in ε4/ε422L mice at a significantly higher level than in ε2/ε222L, and ε3/ε322L mice, while majority of them also showed significantly higher expression in ε2/ε222L mice compared with ε3/ε322L animals. This ε4 > ε2 > ε3 allele gradient effect could be demonstrated both through cluster analysis of microglia and astrocyte specific gene sets and comparison of individual gene expression through one-way ANOVA. Among significantly upregulated microglia genes we found P2ry12, and Tmem119, which together with Cx3cr1 encoding fractalkine receptor are canonically categorized as microglia homeostatic (M0) genes. Their expression is controlled by TGFβ signaling [13]] and they become commonly downregulated in microglia adopting DAM or MGnD states [14, 39, 49, 53, 84]. However, there also is prior evidence for modest increase in P2ry12, Tmem119 and Cx3cr1 transcript in mouse prion models, especially in bulk RNA transcript analysis, what suggests a disease-specific effect on their expression [11, 42, 55, 77].
Several genes were found to be expressed more than 10-folds higher in prion infected mice compared to NBH controls in at least one APOE genotype. This list both includes genes specific for microglia Cst7, C4a/b, Ccl3, and Clec7a and for astrocytes Gfap, Serpina3n, Vim, and Ccl12. Cst7 encodes cystatin F, which is an endosomal cysteine protease inhibitor, and its upregulation has been confirmed across several prion and AD studies most likely as a function of ongoing lysosomal pathology [29, 43, 74, 77]. C4a/b encodes isotypes of the complement component C4 and Ccl3 encodes macrophage inflammatory protein 1α, which both are critically involved in mounting the inflammatory cascade initiated by MGnD [15, 73]. Upregulation of Clec7a is a hallmark of adopting by microglia DAM or MGnD reactive state [14, 49, 53] and the gene encodes Dectin-1 representing the C-type lectin receptor involved in the immune system’s recognition and acting as the phagocytosis regulator. Its inhibition was found to attenuate neurodegeneration and excessive synapse elimination by MGnD in P301S tau mutant mice [123]. Gfap and Vim encode intermediate filament proteins of the astrocyte cytoskeleton, and their upregulation is recognized as universal marker of astrocytic activation [52]. Serpina3n encodes Serpin 3 protein (a.k.a. α1-antichymotrypsin), which functions as serine peptidase inhibitor during complement cascade activation, apoptosis and inflammation and its expression is particularly increased in response to IL-1, TNF, and IL-6. Upregulation of Serpina3n has been documented both in transmissible prion mouse models and AD transgenic mice and it is closely linked to chronic inflammatory response featured by these models [125]. Ccl12 encodes CC motif chemokine ligand 12, also known as monocyte chemotactic protein 5 (MCP-5), a small protein, which plays a role in recruiting peripheral immune cells to the site of damage and inflammation and its upregulation previously has been shown in prion disease [19].
Stimulation between chronically reactive microglia and astrocytes in neurodegeneration is bidirectional [82]. To ascertain the effect of APOE genotype on this process we used RT-qPCR to quantify expression of Il1α, Tnfα, C1qa encoding respective cytokines IL1α, TNFα and C1QA, which are secreted by MGnD microglia and stimulate acquisition of the chronic reactive state by astrocytes and the C3 gene encoding complement component 3 protein (C3), which is expressed by reactive astrocytes and reciprocally advances MGnD phenotype [42, 61, 62]. We also used RT-qPCR to quantify expression of specific MGnD markers Aif1 encoding IBA1, C3ar1 encoding C3 specific receptor, and Cx3cr1. Reactive astrocyte markers included Gfap, Ccl12, and Ccl2, which encodes CC motif chemokine ligand 2. Both CC motif chemokine ligands 12 and 2 are astrocytic secretans that can attract immune cells like microglia to the site of chronic inflammation [50]. Propensity of astrocytes to secrete chemotactic molecules like CC2 and CC12 and proinflammatory factors like C3 suggest they may not only passively contribute to neuroinflammation but rather function as effector cells performing classical innate immune functions and driving the neuroinflammatory cascade [23, 89]. These proinflammatory functions of astrocytes appear to play a particularly important role in prionoses, where paradoxical exacerbation of pathology was observed in microglia deficient mice as it was driven by uninhibited proinflammatory response of astrocytes [11]. In line with the concept of astrocyte-driving neurodegeneration selective removal of astrocytic apoE4 was found to protect against tau mediated neurodegeneration in P301S tau mutant mice [121]. All genes interrogated using RT-qPCR were significantly upregulated in 22L inoculated mice at 23 wpi. but not at 15 wpi. Their transcript level was the highest in ε4/ε422L mice followed by ε2/ε222L and ε3/ε322L animals. Thus, using various transcriptomic approaches we found the strongest proinflammatory effect and evidence for microglia-astrocyte co-stimulatory activation in the setting of the ε4 allele and to a lesser extent in the setting of the ε2 allele compared to the ε3 allele, where the inflammatory response was the least pronounced. This increased neuroinflammatory response associated with the ε2 allele is most likely responsible for reduced disease latency, accelerated tempo of symptoms progression and increased burden of pathology observed in ε2/ε222L mice compared to ε3/ε322L animals.
The APOE polymorphism influences immune response both systemically and within the CNS owing it to the expression of apoE in multiple myeloid-lineage cells, including macrophages, dendritic cells, and microglia [5, 64, 80]. Consistently with the main finding of this study, the ε4 allele has been generally acknowledged as associated with the strongest inflammatory response, while the immunoregulatory properties of the ε2 allele have been reported with variable results depending on cell type and inflammatory stimulus. In respect to the systemic response, both ε2 and ε4 alleles were found to produce stronger inflammatory effect compared to the ε3 allele [45, 54, 114]. In respect to CNS-specific studies, intraventricular injection of lipopolysaccharide (LPS) into APOE-TR mice [129], or in vitro stimulation of microglia isolated from these animals using LPS [69] yielded aggravated and attenuated response in the context to ε4 and ε2 alleles compared to the ε3 allele, respectively. In stark contrast, in vitro LPS challenge of astrocytes isolates from APOE-TR mice produced the highest release of proinflammatory cytokines and upregulation of nuclear factor-kappa B subunit expression in the context of the ε2 allele [68]. Interestingly a recent study examining how APOE genotype modulates cell-type-specific transcriptomic changes in AD brains revealed that ε4 carriers feature the strongest upregulation of microglia specific genes and most of pro-inflammatory pathways, it also found ε2 carriers exhibit strong inflammatory response especially involving IL-6 and IL-1β pathways, which suggests a role of both alleles in promoting inflammatory response in the context of AD pathology [59].
Several bi-transgenic mouse models were generated based on APOE-TR mice to directly study the effect of the APOE polymorphism on CNS pathology induced by accumulation of disease specific misfolded proteins. In models of Aβ deposition, Aβ plaque load clearly was modified in the rank order of ε4 > > ε3 > ε2 [75, 90], with ε4 mice featuring the strongest peri-plaque proinflammatory microglia activation [90]. Interestingly modeling of tau pathology has been reported with variable results depending on the model used. Crossing of P301S tau mutant mice [47] with APOE-TR mice exacerbated tau accumulation and produced the strongest tau-associated inflammatory response in ε4 mice, while both the tau pathology load and innate immune response in ε2 and ε3 mice were comparable [99]. In contrast, following adenoassociated virus delivery of the P301L tau mutant into the lateral ventricle of APOE-TR mice the greatest accumulation of pathology was found in ε2 mice, while ε4 allele showed a protective effect compared to ε3 mice [128]. These variable outcomes could be explained by differences in neuroinflammatory response, which in the P301S model is inherently upregulated, and it was further exacerbated by the presence of the ε4 allele [47], differences in the size of expressed human tau protein, and specific mutations used in different models, and possibly by existence of direct interaction between tau and apoE isoforms postulated in the P301L tau model [128]. Crossing of A53T α-synucleinopathy model mice onto the APOE-TR lines, exacerbated behavioral and pathological metrics in animals expressing the ε4 allele, while the ε2 allele attenuated α-synuclein pathology [31]. It is noteworthy, that in this model transcriptomic markers of microglia and astrocyte activation showed no differences across animals expressing various APOE alleles. Study using a Cx3cr1^GFP/GFP^ mouse model of macular degeneration showed exacerbation of the pathology readouts including subretinal inflammatory response in the setting of the ε2 allele and a protective effect of the ε4 allele compared to the ε3 allele [58]. In summary, APOE-TR mouse studies have demonstrated both ε2 and ε4 allele can exacerbate neurodegeneration in a pathology specific context.
The effect of APOE polymorphism on various neurodegenerative diseases also was investigated through a number epidemiological and neuropathological studies carried out in affected patients. Presence of the ε4 allele has been invariably found to elevate occurrence of LOAD, which risk is 3–4-fold and 12–15-fold increased among carries of a single and two ε4 copies, compared to ε3 homozygotes, respectively [25]. In contrast, the ε2 allele strongly protects against LOAD [24] and the likelihood of LOAD among ε2 homozygotes was found to be exceptionally low [88]. Irrespective of its effect on increasing the risk of LOAD occurrence, the ε4 allele in allele dose-dependent manner accelerates the tempo of cognitive decline, brain atrophy, and accumulation of neurofibrillary tangle (NFT) pathology in patients with established disease [1, 21, 99, 112, 113]. Information on how the ε2 allele may affect progression of established LOAD is limited due to low number of affected ε2 carriers who also do not carry the ε4 allele; however, available data suggest NFT pathology load in ε2/ε3 patients is reduced compared to ε3/ε3 and ε3/ε4 individuals [124]. The ε4 allele also has been associated with a greater severity of Lewy body pathology when controlling for co-associated AD pathology [34]. In contrast, several studies have found ε2 carriers and in particular ε2/ε2 homozygotes to present with increased risk and elevated pathology load in primary tauopathies, including progressive-supranuclear palsy [122, 128], corticobasal degeneration [128] and very late onset NFT-predominant dementia [46]. Likewise, the ε2 allele was implicated as a potential risk factor in aged-related macular degeneration [111]. While in prion diseases epidemiological studies showed no clear effect of APOE polymorphism on the risk of disease occurrence [72, 95, 126], clinical and neuropathological studies evaluating possible effects of APOE polymorphism on the rate of prion disease progression and pathology burden have not been done due to limited number of available cases, disease diversity, and restrictions related to infection precaution concerning work with human prion material [33, 79, 126]. Therefore, we examined the effect of APOE polymorphism on prion pathology using APOE-TR mice we infected with 22L mouse adapted scrapie strain and while we found no effect of the APOE genotype on extra-CNS PrP^Sc^ accumulation and neuroinvasion, the ensuing brain pathology was significantly intensified in the presence of the ε4 allele and to lesser extent in the presence of the ε2 allele.
Conclusions
Findings of our study indicate that APOE polymorphism differentially regulates the progression of prion pathology. We identified two mechanisms attributable to detrimental effect endowed by the ε4 allele, which are increased conversion and accumulation of the PrP^Sc^ conformer and worsening of prion-associated neuroinflammation, while the ε2 allele was found to be associated with increased inflammatory response. Our findings suggest both ε4 and ε2 alleles are disadvantageous determinants in prion pathology (Fig. 10).
Supplementary Material
Supplementary Files
This is a list of supplementary files associated with this preprint. Click to download.
The reference list from the paper itself. Each links out to its DOI / PubMed record.
- 1Agosta F, Vossel KA, Miller BL, Migliaccio R, Bonasera SJ, Filippi M (2009) Apolipoprotein E epsilon 4 is associated with disease-specific effects on brain atrophy in Alzheimer’s disease and frontotemporal dementia. Proc Natl Acad Sci U S A 106(6):2018–202219164761 10.1073/pnas.0812697106 PMC 2644156 · doi ↗ · pubmed ↗
- 2Aguilar-Calvo P, Garcia C, Espinosa JC, Andreoletti O, Torres JM (2015) Prion and prion-like diseases in animals. Virus Res 207:82–9325444937 10.1016/j.virusres.2014.11.026 · doi ↗ · pubmed ↗
- 3Aguzzi A, Liu Y (2017) A role for astroglia in prion diseases. J Exp Med 214(12):3477–347929162644 10.1084/jem.20172045 PMC 5716049 · doi ↗ · pubmed ↗
- 4Aguzzi A, Zhu C (2017) Microglia in prion diseases. J Clin Invest 127(9):3230–323928714865 10.1172/JCI 90605 PMC 5669569 · doi ↗ · pubmed ↗
- 5Alagarsamy J, Jaeschke A, Hui DY (2022) Apolipoprotein E in Cardiometabolic and Neurological Health and Diseases. Int J Mol Sci 23(17)
- 6Amouyel P, Vidal O, Launay JM, Laplanche JL (1994) The apolipoprotein E alleles as major susceptibility factors for Creutzfeldt-Jakob disease. Lancet 344(8933):1315–13187968026 10.1016/s 0140-6736(94)90691-2 · doi ↗ · pubmed ↗
- 7Asuni AA, Guridi M, Pankiewicz JE, Sanchez S, Sadowski MJ (2014) Modulation of amyloid precursor protein expression reduces beta-amyloid deposition in a mouse model. Ann Neurol 75(5):684–69924687915 10.1002/ana.24149 PMC 4247163 · doi ↗ · pubmed ↗
- 8Asuni AA, Guridi M, Sanchez S, Sadowski MJ (2015) Antioxidant peroxiredoxin 6 protein rescues toxicity due to oxidative stress and cellular hypoxia in vitro, and attenuates prion-related pathology in vivo. Neurochem Int 90:152–16526265052 10.1016/j.neuint.2015.08.006PMC 4641785 · doi ↗ · pubmed ↗