Drug-induced headache reports: a comprehensive disproportionality and time-to-onset pharmacovigilance study using the FAERS database (2018–2024)
Abdulaziz Ibrahim Alzarea, Azfar Athar Ishaqui, Muhammad Bilal Maqsood, Abdullah Salah Alanazi, Aseel Awad Alsaidan, Tauqeer Hussain Mallhi, Narendar Kumar, Khalid M. Orayj, Sultan M. Alshahrani, Hassan H. Alhassan, Sami I. Alzarea, Omar Awad Alsaidan

TL;DR
This study uses a large database to find drugs most commonly linked to headaches as side effects, highlighting the need for better monitoring.
Contribution
The study provides new insights into drug-induced headaches using FAERS data and identifies specific drugs and classes with high headache risk.
Findings
Glecaprevir/pibrentasvir, sofosbuvir/velpatasvir, and eptinezumab-jjmr showed the highest headache risk based on ROR.
Calcium homeostasis agents and systemic antivirals were the therapeutic classes most strongly associated with headaches.
Early-onset headaches were linked to ofatumumab and fingolimod, while late-onset headaches were associated with treprostinil and infliximab-dyyb.
Abstract
Headache is a common adverse drug reaction (ADR) across diverse therapeutic classes, yet systematic evaluations of drug-associated headaches in real-world settings are limited. This study aimed to explore the association between various medications and the reporting of headache as an ADR using the FDA-Adverse Event Reporting System (FAERS). We conducted a retrospective disproportionality analysis using FAERS data from Q1-2018 to Q4-2024. Duplicate reports were removed per FDA guidelines. Reports with headache as an adverse event and drugs classified as Primary Suspect were included. Disproportionality metrics — Reporting Odds Ratio (ROR) and Proportional Reporting Ratio (PRR)—were calculated to identify signals. Drugs were classified according to the Anatomical Therapeutic Chemical(ATC) classification system, and time-to-onset analyses were performed. A total of 313,166…
Genes, proteins, chemicals, diseases, species, mutations and cell lines named across the full text — each resolved to its canonical identifier and authoritative record.
Click any figure to enlarge with its caption.
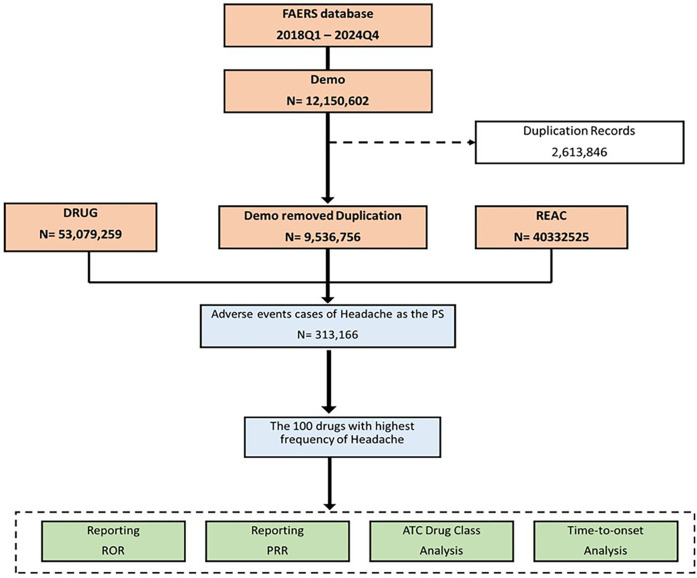 Figure 1
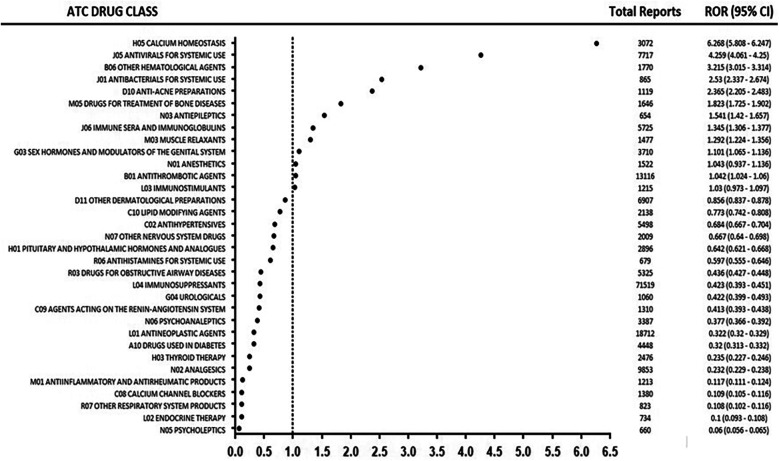 Figure 2
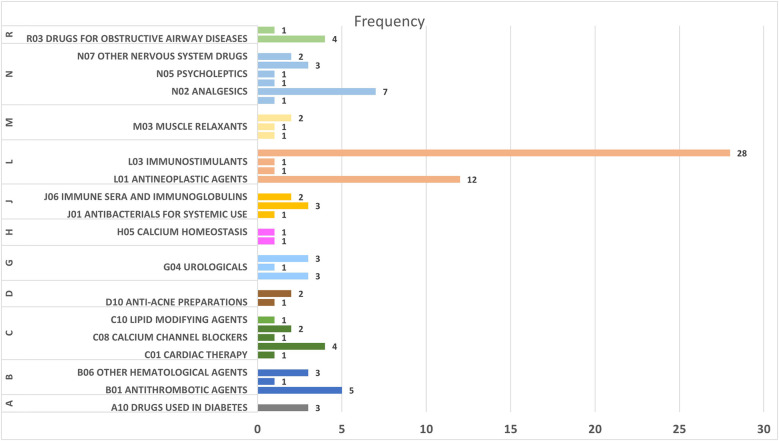 Figure 3
| Characteristics | Categorization | Frequency ( | Percentage (%) |
|---|---|---|---|
| Age | <18 years | 9,184 | 2.93 |
| 18–30 years | 17,472 | 5.58 | |
| 31–50 years | 56,794 | 18.14 | |
| 51–65 years | 66,862 | 21.35 | |
| >65 years | 48,343 | 15.44 | |
| Missing | 114,511 | 36.57 | |
| Sex | Female | 208,746 | 66.66 |
| Male | 72,601 | 23.18 | |
| Missing | 31,474 | 10.05 | |
| Unknown | 345 | 0.11 | |
| Weight | ≤50 kg | 6,533 | 2.09 |
| >50–≤100 kg | 66,462 | 21.22 | |
| >100 kg | 10,548 | 3.37 | |
| Missing | 229,623 | 73.32 | |
| Occupation Reporter | Consumer | 171,354 | 54.72 |
| Health Professional | 49,874 | 15.93 | |
| Medical Doctor | 46,659 | 14.90 | |
| Pharmacist | 16,296 | 5.20 | |
| Other Work | 1,601 | 0.51 | |
| Others | 20,337 | 6.49 | |
| Not Available | 7,045 | 2.25 | |
| Reporter Country | United States | 206,270 | 65.87 |
| Canada | 37,782 | 12.06 | |
| United Kingdom | 12,904 | 4.12 | |
| Denmark | 7,381 | 2.36 | |
| Country Not Specified | 8,271 | 2.64 | |
| Others | 40,558 | 12.95 |
| Drug | Frequency | ROR (95% CI)1 | PRR (95% CI)1 | ADR status mentioned in drug profile | ADR frequency IN drug profile |
|---|---|---|---|---|---|
| APREMILAST | 8,694 | 2.021 (1.978–2.065) | 2.006 (1.963–2.049) | YES | >10% |
| TREPROSTINIL | 7,014 | 2.387 (2.331–2.445) | 2.362 (2.307–2.419) | YES | >10% |
| ADALIMUMAB | 6,981 | 0.349 (0.34–0.357) | 0.35 (0.342–0.359) | YES | >10% |
| TOFACITINIB CITRATE | 6,594 | 0.536 (0.523–0.549) | 0.538 (0.525–0.551) | YES | 1% to 10% |
| DUPILUMAB | 5,799 | 0.786 (0.766–0.807) | 0.788 (0.767–0.808) | YES | 1% to 10% |
| HUMAN IMMUNOGLOBULIN G | 5,725 | 1.345 (1.31–1.381) | 1.341 (1.306–1.377) | YES | >10% |
| OFATUMUMAB | 4,314 | 3.077 (2.985–3.172) | 3.029 (2.938–3.122) | YES | >10% |
| FINGOLIMOD HYDROCHLORIDE | 4,085 | 2.132 (2.067–2.2) | 2.114 (2.049–2.181) | YES | >10% |
| SECUKINUMAB | 3,463 | 0.38 (0.367–0.393) | 0.382 (0.369–0.395) | YES | 1% to 10% |
| METHOTREXATE | 3,188 | 0.147 (0.142–0.152) | 1.066 (1.029–1.104) | YES | 1% to 10% |
| MACITENTAN | 3,145 | 1.067 (1.03–1.105) | 6.024 (5.808–6.247) | YES | >10% |
| ABALOPARATIDE | 3,072 | 6.268 (6.044–6.5) | 0.243 (0.235–0.253) | YES | 1% to 10% |
| RITUXIMAB | 3,064 | 0.212 (0.205–0.22) | 1.019 (0.983–1.057) | YES | 1% to 10% |
| INFLIXIMAB | 3,062 | 0.242 (0.233–0.251) | 1.914 (1.843–1.987) | YES | >10% |
| OCRELIZUMAB | 2,999 | 1.02 (0.983–1.057) | 1.393 (1.342–1.987) | YES | >10% |
| SELEXIPAG | 2,818 | 1.927 (1.857–2.001) | 0.213 (0.206–0.222) | YES | >10% |
| NIRAPARIB | 2,795 | 1.397 (1.346–1.45) | 0.574 (0.553–0.597) | YES | >10% |
| OMALIZUMAB | 2,611 | 0.572 (0.551–0.595) | 0.489 (0.47–0.509) | YES | >10% |
| LENALIDOMIDE | 2,543 | 0.487 (0.469–0.507) | 0.236 (0.227–0.246) | YES | >10% |
| LEVOTHYROXINE SODIUM | 2,476 | 0.235 (0.226–0.244) | 9.116 (8.749–9.498) | YES | FREQUENCY NOT DEFINED |
| SOFOSBUVIR\VELPATASVIR | 2,472 | 9.729 (9.338–10.137) | 0.561 (0.539–0.584) | YES | >10% |
| VEDOLIZUMAB | 2,421 | 0.559 (0.537–0.582) | 0.216 (0.208–0.225) | YES | >10% |
| ABATACEPT | 2,399 | 0.215 (0.206–0.224) | 0.474 (0.455–0.493) | YES | >10% |
| INFLIXIMAB-DYYB | 2,382 | 0.472 (0.453–0.491) | 9.322 (9.322–10.167) | YES | >10% |
| GLECAPREVIR\PIBRENTASVIR | 2,219 | 10.445 (10.001–10.908) | 0.143 (0.143–0.153) | YES | >10% |
| EVOLOCUMAB | 2,138 | 0.773 (0.741–0.807) | 0.742 (0.742–0.808) | YES | >10% |
| PALBOCICLIB | 2,116 | 0.649 (0.621–0.677) | 0.623 (0.623–0.679) | NO | - |
| GALCANEZUMAB-GNLM | 2,094 | 4.251 (4.07–4.441) | 3.97 (3.97–4.332) | NO | - |
| ETANERCEPT | 2,071 | 0.155 (0.149–0.162) | 0.15 (0.15–0.163) | POST MARKETING | - |
| TOCILIZUMAB | 2,048 | 0.167 (0.16–0.175) | 0.161 (0.161–0.176) | YES | 1% to 10% |
| NIRMATRELVIR\RITONAVIR | 2,012 | 1.71 (1.637–1.788) | 1.628 (1.628–1.778) | POST MARKETING | - |
| LEVONORGESTREL | 1,982 | 1.424 (1.362–1.489) | 1.358 (1.358–1.483) | YES | >10% |
| ERENUMAB-AOOE | 1,980 | 1.19 (1.139–1.244) | 1.137 (1.137–1.242) | NO | - |
| CERTOLIZUMAB PEGOL | 1,956 | 0.228 (0.218–0.238) | 0.219 (0.219–0.239) | YES | 1% to 10% |
| TERIFLUNOMIDE | 1,780 | 1.573 (1.501–1.649) | 1.495 (1.495–1.641) | YES | >10% |
| VOXELOTOR | 1,770 | 3.215 (3.067–3.371) | 3.015 (3.015–3.314) | YES | >10% |
| DIMETHYL FUMARATE | 1,769 | 1.049 (1.001–1.099) | 1 (1–1.099) | NO | - |
| PREGABALIN | 1,756 | 0.178 (0.17–0.187) | 0.171 (0.171–0.188) | YES | >10% |
| RUXOLITINIB | 1,658 | 0.722 (0.688–0.758) | 0.69 (0.69–0.76) | YES | >10% |
| SEMAGLUTIDE | 1,657 | 0.915 (0.872–0.961) | 0.873 (0.873–0.961) | YES | >10% |
| AMBRISENTAN | 1,570 | 0.883 (0.841–0.928) | 0.841 (0.841–0.929) | YES | >10% |
| SOMATROPIN | 1,531 | 0.981 (0.933–1.032) | 0.933 (0.933–1.032) | YES | >10% |
| SODIUM OXYBATE | 1,522 | 1.043 (0.992–1.097) | 0.991 (0.991–1.097) | YES | >10% |
| ONABOTULINUMTOXINA | 1,477 | 1.292 (1.227–1.36) | 1.224 (1.224–1.357) | YES | >10% |
| NATALIZUMAB | 1,455 | 1.166 (1.107–1.228) | 1.106 (1.106–1.226) | YES | >10% |
| APIXABAN | 1,397 | 0.208 (0.197–0.219) | 0.199 (0.199–0.221) | NO | - |
| AMLODIPINE BESYLATE | 1,380 | 0.109 (0.104–0.115) | 0.104 (0.104–0.116) | NO | - |
| ACETAMINOPHEN | 1,377 | 0.05 (0.048–0.053) | 0.048 (0.048–0.053) | YES | 1% to 10% |
| OCTREOTIDE ACETATE | 1,365 | 0.462 (0.438–0.487) | 0.44 (0.44–0.489) | YES | >10% |
| AMPHETAMINE ASPARTATE\AMPHETAMINE SULFATE\DEXTROAMPHETAMINE SACCHARATE\DEXTROAMPHETAMINE SULFATE | 1,361 | 0.972 (0.921–1.025) | 0.922 (0.922–1.026) | YES | >10% |
| RISANKIZUMAB-RZAA | 1,349 | 1.106 (1.048–1.166) | 1.064 (1.064–1.183) | YES | 1% to 10% |
| USTEKINUMAB | 1,343 | 0.241 (0.229–0.255) | 0.23 (0.23–0.256) | YES | 1% to 10% |
| MEPOLIZUMAB | 1,323 | 0.44 (0.416–0.464) | 0.418 (0.418–0.466) | YES | >10% |
| SACUBITRIL\VALSARTAN | 1,310 | 0.413 (0.391–0.436) | 0.393 (0.393–0.438) | NO | - |
| ECULIZUMAB | 1,289 | 1.745 (1.652–1.844) | 1.642 (1.642–1.833) | YES | >10% |
| INTERFERON BETA-1A | 1,215 | 1.03 (0.973–1.09) | 0.973 (0.973–1.09) | YES | >10% |
| IBUPROFEN | 1,213 | 0.117 (0.11–0.124) | 0.111 (0.111–0.125) | YES | 1% to 10% |
| UPADACITINIB | 1,182 | 0.703 (0.664–0.744) | 0.665 (0.665–0.746) | YES | 1% to 10% |
| ALEMTUZUMAB | 1,132 | 1.002 (0.945–1.063) | 0.945 (0.945–1.062) | YES | >10% |
| EPOPROSTENOL | 1,123 | 1.399 (1.319–1.484) | 1.315 (1.315–1.48) | YES | >10% |
| ISOTRETINOIN | 1,119 | 2.365 (2.229–2.509) | 2.205 (2.205–2.483) | POST MARKETING | - |
| MINOXIDIL | 1,108 | 1.559 (1.469–1.654) | 1.463 (1.463–1.479) | YES | >10% |
| DALFAMPRIDINE | 1,088 | 0.742 (0.699–0.787) | 0.7 (0.7–0.789) | YES | 1% to 10% |
| SERTRALINE | 1,073 | 0.198 (0.187–0.211) | 0.188 (0.188–0.225) | NO | - |
| TADALAFIL | 1,060 | 0.422 (0.397–0.448) | 0.399 (0.399–0.45) | YES | >10% |
| LEDIPASVIR\SOFOSBUVIR | 1,014 | 5.937 (5.574–6.323) | 5.369 (5.369–6.09) | YES | >10% |
| IBRUTINIB | 1,008 | 0.522 (0.49–0.555) | 0.492 (0.492–0.557) | YES | >10% |
| NINTEDANIB | 986 | 0.773 (0.726–0.823) | 0.728 (0.728–0.825) | YES | 1% to 10% |
| GABAPENTIN | 974 | 0.09 (0.085–0.096) | 0.085 (0.085–0.097) | NO | - |
| TIRZEPATIDE | 967 | 0.851 (0.799–0.907) | 0.8 (0.8–0.908) | NO | - |
| ESTRADIOL | 963 | 0.437 (0.41–0.466) | 0.412 (0.412–0.467) | YES | >10% |
| VENLAFAXINE | 953 | 0.23 (0.216–0.245) | 0.217 (0.217–0.246) | YES | <1% |
| BELIMUMAB | 943 | 1.126 (1.056–1.201) | 1.055 (1.055–1.199) | NO | - |
| DULAGLUTIDE | 943 | 0.61 (0.572–0.65) | 0.574 (0.574–0.652) | NO | - |
| NALTREXONE | 921 | 1.337 (1.253–1.427) | 0.249 (0.249–0.254) | YES | >10% |
| METFORMIN | 881 | 0.078 (0.073–0.083) | 0.073 (0.073–0.107) | YES | 1% to 10% |
| LEFLUNOMIDE | 879 | 0.076 (0.071–0.082) | 0.072 (0.072–0.082) | YES | >10% |
| SIPONIMOD | 871 | 2.547 (2.382–2.724) | 2.354 (2.354–2.692) | YES | >10% |
| CIPROFLOXACIN | 865 | 0.299 (0.279–0.319) | 0.281 (0.281–0.321) | YES | 1% to 10% |
| DASATINIB | 860 | 1.625 (1.519–1.738) | 1.512 (1.512–1.73) | YES | >10% |
| ZOLEDRONIC ACID | 860 | 0.404 (0.377–0.432) | 0.379 (0.379–0.434) | YES | >10% |
| PIRFENIDONE | 847 | 1.083 (1.012–1.159) | 1.012 (1.012–1.089) | YES | >10% |
| OXYCODONE HYDROCHLORIDE | 845 | 0.111 (0.104–0.119) | 0.104 (0.104–0.119) | YES | >10% |
| ELEXACAFTOR\IVACAFTOR\TEZACAFTOR | 823 | 2.203 (2.056–2.36) | 2.037 (2.037–2.338) | YES | >10% |
| DENOSUMAB | 786 | 0.237 (0.221–0.254) | 0.222 (0.222–0.255) | YES | >10% |
| RIOCIGUAT | 783 | 0.652 (0.607–0.699) | 0.609 (0.609–0.701) | YES | >10% |
| NIVOLUMAB | 781 | 0.301 (0.28–0.323) | 0.218 (0.218–0.255) | YES | >10% |
| EPTINEZUMAB-JJMR | 773 | 6.775 (6.302–7.283) | 6.469 (6.469–7.443) | NO | - |
| LENVATINIB | 766 | 0.909 (0.847–0.976) | 0.847 (0.847–0.977) | YES | >10% |
| ETONOGESTREL | 765 | 1.036 (0.965–1.113) | 0.965 (0.965–1.113) | YES | >10% |
| RIVAROXABAN | 764 | 0.191 (0.178–0.205) | 0.179 (0.179–0.207) | NO | - |
| RIBOCICLIB | 756 | 0.434 (0.404–0.466) | 0.406 (0.406–0.468) | YES | >10% |
| MONTELUKAST SODIUM | 736 | 0.1 (0.093–0.107) | 0.093 (0.093–0.108) | YES | 1% to 10% |
| ENZALUTAMIDE | 734 | 0.737 (0.685–0.792) | 0.687 (0.687–0.794) | YES | >10% |
| CABOZANTINIB S-MALATE | 734 | 0.646 (0.601–0.694) | 0.602 (0.602–0.794) | YES | >10% |
| CETIRIZINE HYDROCHLORIDE | 679 | 0.062 (0.057–0.066) | 0.058 (0.058–0.097) | YES | >10% |
| ARIPIPRAZOLE | 660 | 0.228 (0.211–0.246) | 0.213 (0.213–0.245) | YES | >10% |
| BENRALIZUMAB | 655 | 1.543 (1.428–1.667) | 1.422 (1.422–1.66) | YES | >10% |
| TOPIRAMATE | 654 | 0.234 (0.217–0.253) | 0.218 (0.218–0.255) | YES | FREQUENCY NOT DEFINED |
| POMALIDOMIDE | 647 | 0.449 (0.416–0.485) | 0.417 (0.417–0.487) | YES | >10% |
| ATC | No. of drugs | ROR (95% CI) | PRR (95% CI) |
|---|---|---|---|
| A10 DRUGS USED IN DIABETES | 4 | 0.32 (0.313–0.332) | 0.322 (0.313–0.332) |
| B01 ANTITHROMBOTIC AGENTS | 5 | 1.042 (1.024–1.06) | 1.042 (1.024–1.06) |
| B06 OTHER HEMATOLOGICAL AGENTS | 1 | 3.215 (3.015–3.314) | 3.161 (3.015–3.314) |
| C02 ANTIHYPERTENSIVES | 3 | 0.684 (0.667–0.704) | 0.685 (0.667–0.704) |
| C08 CALCIUM CHANNEL BLOCKERS | 1 | 0.109 (0.105–0.116) | 0.11 (0.105–0.116) |
| C09 AGENTS ACTING ON THE RENIN-ANGIOTENSIN SYSTEM | 1 | 0.413 (0.393–0.438) | 0.415 (0.393–0.438) |
| C10 LIPID MODIFYING AGENTS | 1 | 0.773 (0.742–0.808) | 0.774 (0.742–0.808) |
| D10 ANTI-ACNE PREPARATIONS | 1 | 2.365 (2.205–2.483) | 2.34 (2.205–2.483) |
| D11 OTHER DERMATOLOGICAL PREPARATIONS | 2 | 0.856 (0.837–0.878) | 0.857 (0.837–0.877) |
| G03 SEX HORMONES AND MODULATORS OF THE GENITAL SYSTEM | 3 | 1.101 (1.065–1.136) | 1.1 (1.065–1.137) |
| G04 UROLOGICALS | 1 | 0.422 (0.399–0.493) | 0.424 (0.399–0.493) |
| H01 PITUITARY AND HYPOTHALAMIC HORMONES AND ANALOGUES | 2 | 0.642 (0.621–0.668) | 0.644 (0.621–0.668) |
| H03 THYROID THERAPY | 1 | 0.235 (0.227–0.246) | 0.236 (0.227–0.246) |
| H05 CALCIUM HOMEOSTASIS | 1 | 6.268 (5.808–6.247) | 6.024 (5.808–6.247) |
| J01 ANTIBACTERIALS FOR SYSTEMIC USE | 1 | 2.53 (2.337–2.674) | 2.5 (2.337–2.674) |
| J05 ANTIVIRALS FOR SYSTEMIC USE | 4 | 4.259 (4.061–4.25) | 4.155 (4.061–4.25) |
| J06 IMMUNE SERA AND IMMUNOGLOBULINS | 1 | 1.345 (1.306–1.377) | 1.341 (1.306–1.377) |
| L01 ANTINEOPLASTIC AGENTS | 12 | 0.322 (0.32–0.329) | 0.324 (0.32–0.329) |
| L02 ENDOCRINE THERAPY | 1 | 0.1 (0.093–0.108) | 0.093 (0.093–0.108) |
| L03 IMMUNOSTIMULANTS | 1 | 1.03 (0.973–1.097) | 1.03 (0.973–1.097) |
| L04 IMMUNOSUPPRESSANTS | 28 | 0.423 (0.393–0.451) | 0.425 (0.422–0.451) |
| M01 ANTIINFLAMMATORY AND ANTIRHEUMATIC PRODUCTS | 1 | 0.117 (0.111–0.124) | 0.111 (0.111–0.124) |
| M03 MUSCLE RELAXANTS | 1 | 1.292 (1.224–1.356) | 1.289 (1.224–1.356) |
| M05 DRUGS FOR TREATMENT OF BONE DISEASES | 2 | 1.823 (1.725–1.902) | 1.812 (1.725–1.902) |
| N01 ANESTHETICS | 1 | 1.043 (0.937–1.136) | 1.043 (0.991–1.097) |
| N02 ANALGESICS | 7 | 0.232 (0.229–0.238) | 0.234 (0.229–0.238) |
| N03 ANTIEPILEPTICS | 1 | 1.541 (1.42–1.657) | 1.534 (1.42–1.657) |
| N05 PSYCHOLEPTICS | 1 | 0.06 (0.056–0.065) | 0.06 (0.056–0.065) |
| N06 PSYCHOANALEPTICS | 3 | 0.377 (0.366–0.392) | 0.379 (0.366–0.392) |
| N07 OTHER NERVOUS SYSTEM DRUGS | 2 | 0.667 (0.64–0.698) | 0.668 (0.64–0.698) |
| R03 DRUGS FOR OBSTRUCTIVE AIRWAY DISEASES | 4 | 0.436 (0.427–0.448) | 0.438 (0.427–0.448) |
| R06 ANTIHISTAMINES FOR SYSTEMIC USE | 1 | 0.597 (0.555–0.646) | 0.556 (0.556–0.646) |
| R07 OTHER RESPIRATORY SYSTEM PRODUCTS | 1 | 0.108 (0.102–0.116) | 0.102 (0.102–0.116) |
| Drug name | ATC | Total complete cases | ≤ 7 days | 8-28 days | 29-60 days | 61-90 days | >90 days |
|---|---|---|---|---|---|---|---|
| APREMILAST | L04 IMMUNOSUPPRESSANTS | 2,552 | 1,171 (45.90%) | 342 (13.5%) | 201 (7.90%) | 90 (3.50%) | 748 (29.30%) |
| TREPROSTINIL | B01 ANTITHROMBOTIC AGENTS | 2,352 | 375 (15.90%) | 326 (13.90%) | 153 (6.50%) | 110 (4.70%) | 1,388 (59.00%) |
| FINGOLIMOD HYDROCHLORIDE | L04 IMMUNOSUPPRESSANTS | 2,261 | 1,323 (58.50%) | 167 (7.40%) | 110 (4.90%) | 64 (2.80%) | 597 (26.40%) |
| HUMAN IMMUNOGLOBULIN G | J06 IMMUNE SERA AND IMMUNOGLOBULINS | 2,104 | 1,030 (49.00%) | 166 (7.90%) | 103 (4.90%) | 72 (3.40%) | 733 (34.80%) |
| OFATUMUMAB | L04 IMMUNOSUPPRESSANTS | 2,014 | 1,582 (78.60%) | 183 (9.00%) | 75 (3.70%) | 21 (1.00%) | 153 (7.60%) |
| INFLIXIMAB-DYYB | L04 IMMUNOSUPPRESSANTS | 1,912 | 292 (15.30%) | 219 (11.50%) | 168 (8.80%) | 104 (5.40%) | 1,129 (59.00%) |
| OCRELIZUMAB | L04 IMMUNOSUPPRESSANTS | 1,729 | 947 (54.80%) | 156 (9.00%) | 46 (2.70%) | 20 (1.20%) | 560 (32.40%) |
| DUPILUMAB | D11 OTHER DERMATOLOGICAL PREPARATIONS | 1,678 | 574 (34.20%) | 238 (14.10%) | 137 (8.20%) | 93 (5.50%) | 636 (37.90%) |
| ADALIMUMAB | L04 IMMUNOSUPPRESSANTS | 1,627 | 410 (25.20%) | 178 (10.90%) | 106 (6.50%) | 68 (4.20%) | 865 (53.20%) |
| NIRMATRELVIR\RITONAVIR | J05 ANTIVIRALS FOR SYSTEMIC USE | 1,510 | 796 (52.70%) | 617 (40.80%) | 13 (0.90%) | 2 (0.10%) | 82 (5.40%) |
| VEDOLIZUMAB | L04 IMMUNOSUPPRESSANTS | 1,395 | 418 (30.00%) | 141 (10.00%) | 104 (7.50%) | 77 (5.50%) | 655 (47.00%) |
| TOFACITINIB CITRATE | L04 IMMUNOSUPPRESSANTS | 1,345 | 422 (31.40%) | 175 (13.00%) | 93 (6.90%) | 70 (5.20%) | 585 (43.50%) |
| OMALIZUMAB | R03 DRUGS FOR OBSTRUCTIVE AIRWAY DISEASES | 1,312 | 410 (31.20%) | 106 (8.10%) | 94 (7.20%) | 54 (4.10%) | 648 (49.40%) |
| ABALOPARATIDE | H05 CALCIUM HOMEOSTASIS | 1,284 | 893 (69.50%) | 182 (14.20%) | 62 (4.80%) | 32 (2.50%) | 115 (9.00%) |
| MACITENTAN | C02 ANTIHYPERTENSIVES | 1,224 | 261 (21.30%) | 182 (14.90%) | 108 (8.80%) | 45 (3.70%) | 628 (51.30%) |
| SELEXIPAG | B01 ANTITHROMBOTIC AGENTS | 1,166 | 415 (35.60%) | 235 (20.10%) | 119 (10.20%) | 60 (5.10%) | 337 (28.90%) |
| SECUKINUMAB | L04 IMMUNOSUPPRESSANTS | 1,137 | 380 (33.40%) | 167 (14.70%) | 103 (9.10%) | 53 (4.70%) | 434 (38.20%) |
| NIRAPARIB | L01 ANTINEOPLASTIC AGENTS | 1,036 | 384 (37.10%) | 313 (30.20%) | 89 (8.60%) | 50 (4.80%) | 200 (19.30%) |
| LEVONORGESTREL | G03 SEX HORMONES AND MODULATORS OF THE GENITAL SYSTEM | 980 | 642 (65.50%) | 91 (9.30%) | 34 (3.50%) | 10 (1.00%) | 203 (20.70%) |
| GLECAPREVIR\PIBRENTASVIR | J05 ANTIVIRALS FOR SYSTEMIC USE | 890 | 300 (33.70%) | 274 (30.80%) | 127 (14.30%) | 22 (2.50%) | 167 (18.80%) |
| CERTOLIZUMAB PEGOL | L04 IMMUNOSUPPRESSANTS | 762 | 284 (37.30%) | 77 (10.10%) | 73 (9.60%) | 37 (4.90%) | 291 (38.20%) |
| SOFOSBUVIR\VELPATASVIR | J05 ANTIVIRALS FOR SYSTEMIC USE | 744 | 264 (35.50%) | 192 (25.90%) | 115 (15.50%) | 18 (2.40%) | 155 (20.80%) |
| NATALIZUMAB | L04 IMMUNOSUPPRESSANTS | 732 | 293 (40.00%) | 68 (9.30%) | 26 (3.60%) | 12 (1.60%) | 333 (45.50%) |
| OCTREOTIDE ACETATE | H01 PITUITARY AND HYPOTHALAMIC HORMONES AND ANALOGUES | 679 | 146 (21.50%) | 47 (7.00%) | 32 (4.70%) | 35 (5.20%) | 419 (61.70%) |
| SEMAGLUTIDE | A10 DRUGS USED IN DIABETES | 666 | 404 (60.70%) | 95 (14.40%) | 50 (7.50%) | 17 (2.60%) | 100 (15.00%) |
| VOXELOTOR | B06 OTHER HEMATOLOGICAL AGENTS | 661 | 218 (33.00%) | 125 (18.90%) | 43 (6.50%) | 44 (6.70%) | 231 (34.90%) |
| ONABOTULINUMTOXINA | M03 MUSCLE RELAXANTS | 622 | 416 (66.90%) | 62 (9.90%) | 16 (2.60%) | 8 (1.30%) | 120 (19.30%) |
| RUXOLITINIB | L01 ANTINEOPLASTIC AGENTS | 616 | 215 (34.90%) | 106 (17.20%) | 69 (11.20%) | 18 (2.90%) | 208 (33.80%) |
| PALBOCICLIB | L01 ANTINEOPLASTIC AGENTS | 595 | 114 (19.20%) | 109 (18.30%) | 64 (10.80%) | 35 (5.90%) | 273 (45.90%) |
| LENALIDOMIDE | L04 IMMUNOSUPPRESSANTS | 576 | 142 (24.70%) | 82 (14.20%) | 46 (8.00%) | 31 (5.40%) | 275 (47.70%) |
| RISANKIZUMAB-RZAA | L04 IMMUNOSUPPRESSANTS | 571 | 125 (21.90%) | 86 (15.10%) | 34 (6.00%) | 29 (5.10%) | 297 (52.00%) |
| MEPOLIZUMAB | R03 DRUGS FOR OBSTRUCTIVE AIRWAY DISEASES | 557 | 192 (34.50%) | 41 (7.40%) | 49 (8.80%) | 13 (2.30%) | 262 (47.00%) |
| NINTEDANIB | L01 ANTINEOPLASTIC AGENTS | 552 | 197 (35.70%) | 123 (22.30%) | 55 (10.00%) | 26 (4.70%) | 151 (27.40%) |
| ABATACEPT | L04 IMMUNOSUPPRESSANTS | 551 | 155 (28.10%) | 64 (11.60%) | 35 (6.40%) | 23 (4.20%) | 274 (49.70%) |
| ALEMTUZUMAB | L04 IMMUNOSUPPRESSANTS | 551 | 388 (70.40%) | 22 (4.00%) | 8 (1.50%) | 4 (0.70%) | 129 (23.40%) |
| ACETAMINOPHEN | N02 ANALGESICS | 550 | 477 (86.70%) | 19 (3.50%) | 8 (1.50%) | 6 (1.10%) | 40 (7.30%) |
| DIMETHYL FUMARATE | L04 IMMUNOSUPPRESSANTS | 526 | 226 (43.00%) | 79 (15.00%) | 29 (5.50%) | 5 (1.00%) | 187 (35.60%) |
| AMPHETAMINE \DEXTROAMPHETAMINE | N06 PSYCHOANALEPTICS | 522 | 414 (79.30%) | 50 (9.50%) | 24 (4.60%) | 6 (1.10%) | 28 (5.40%) |
| AMBRISENTAN | C02 ANTIHYPERTENSIVES | 503 | 82 (16.30%) | 41 (8.20%) | 45 (8.90%) | 21 (4.20%) | 314 (62.40%) |
| NIVOLUMAB | L01 ANTINEOPLASTIC AGENTS | 485 | 154 (31.80%) | 123 (25.40%) | 71 (14.60%) | 42 (8.70%) | 95 (19.60%) |
| UPADACITINIB | L04 IMMUNOSUPPRESSANTS | 477 | 108 (22.60%) | 58 (12.20%) | 43 (9.00%) | 32 (6.70%) | 236 (49.50%) |
| TERIFLUNOMIDE | L04 IMMUNOSUPPRESSANTS | 464 | 101 (21.80%) | 63 (13.50%) | 43 (9.30%) | 24 (5.20%) | 233 (50.20%) |
| LEVOTHYROXINE SODIUM | H03 THYROID THERAPY | 445 | 196 (44.00%) | 85 (19.10%) | 64 (14.40%) | 20 (4.50%) | 80 (18.00%) |
| AMLODIPINE BESYLATE | C08 CALCIUM CHANNEL BLOCKERS | 436 | 255 (58.50%) | 59 (13.60%) | 25 (5.70%) | 9 (2.10%) | 88 (20.20%) |
| EVOLOCUMAB | C10 LIPID MODIFYING AGENTS | 420 | 219 (52.10%) | 67 (16.00%) | 22 (5.20%) | 24 (5.70%) | 88 (21.00%) |
| IBUPROFEN | M01 ANTIINFLAMMATORY AND ANTIRHEUMATIC PRODUCTS | 411 | 296 (72.00%) | 22 (5.30%) | 23 (5.60%) | 14 (3.40%) | 56 (13.60%) |
| ZOLEDRONIC ACID | M05 DRUGS FOR TREATMENT OF BONE DISEASES | 410 | 344 (83.90%) | 13 (3.20%) | 10 (2.40%) | 7 (1.70%) | 36 (8.80%) |
| CIPROFLOXACIN | J01 ANTIBACTERIALS FOR SYSTEMIC USE | 407 | 283 (69.50%) | 60 (14.80%) | 17 (4.20%) | 10 (2.50%) | 37 (9.10%) |
| SIPONIMOD | L04 IMMUNOSUPPRESSANTS | 404 | 287 (71.00%) | 36 (8.90%) | 23 (5.70%) | 9 (2.20%) | 49 (12.10%) |
| ERENUMAB-AOOE | N02 ANALGESICS | 400 | 215 (53.80%) | 40 (9.90%) | 34 (8.50%) | 25 (6.20%) | 86 (21.50%) |
| ATC Category | No. of drugs | Total complete caseS | ≤ 7 days | 8-28 days | 29-60 days | 61–90 days | >90 days |
|---|---|---|---|---|---|---|---|
| A10 DRUGS USED IN DIABETES | 3 | 1,077 | 695 (64.5%) | 132 (12.3%) | 65 (6%) | 25 (2.3%) | 160 (14.9%) |
| B01 ANTITHROMBOTIC AGENTS | 5 | 4,396 | 1,125 (25.6%) | 670 (15.2%) | 337 (7.7%) | 200 (4.5%) | 2,064 (47%) |
| B06 OTHER HEMATOLOGICAL AGENTS | 3 | 661 | 218 (33%) | 125 (18.9%) | 43 (6.5%) | 44 (6.7%) | 231 (34.9%) |
| C02 ANTIHYPERTENSIVES | 3 | 2,002 | 398 (19.9%) | 264 (13.2%) | 179 (8.9%) | 91 (4.5%) | 1,070 (53.4%) |
| C08 CALCIUM CHANNEL BLOCKERS | 1 | 436 | 255 (58.5%) | 59 (13.5%) | 25 (5.7%) | 9 (2.1%) | 88 (20.2%) |
| C09 AGENTS ACTING ON THE RENIN-ANGIOTENSIN SYSTEM | 1 | 272 | 115 (42.3%) | 50 (18.4%) | 20 (7.4%) | 12 (4.4%) | 75 (27.6%) |
| C10 LIPID MODIFYING AGENTS | 1 | 420 | 219 (52.1%) | 67 (16%) | 22 (5.2%) | 24 (5.7%) | 88 (21%) |
| D10 ANTI-ACNE PREPARATIONS | 1 | 206 | 67 (32.5%) | 35 (17%) | 25 (12.1%) | 19 (9.2%) | 60 (29.1%) |
| D11 OTHER DERMATOLOGICAL PREPARATIONS | 2 | 1,944 | 756 (38.9%) | 251 (12.9%) | 141 (7.3%) | 94 (4.8%) | 702 (36.1%) |
| G03 SEX HORMONES AND MODULATORS OF THE GENITAL SYSTEM | 3 | 1,493 | 910 (61%) | 131 (8.8%) | 66 (4.4%) | 25 (1.7%) | 361 (24.2%) |
| G04 UROLOGICALS | 1 | 381 | 131 (34.4%) | 48 (12.6%) | 37 (9.7%) | 20 (5.2%) | 145 (38.1%) |
| H01 PITUITARY AND HYPOTHALAMIC HORMONES AND ANALOGUES | 2 | 1,043 | 300 (28.8%) | 96 (9.2%) | 53 (5.1%) | 51 (4.9%) | 543 (52.1%) |
| H03 THYROID THERAPY | 1 | 445 | 196 (44%) | 85 (19.1%) | 64 (14.4%) | 20 (4.5%) | 80 (18%) |
| H05 CALCIUM HOMEOSTASIS | 1 | 1,284 | 893 (69.5%) | 182 (14.2%) | 62 (4.8%) | 32 (2.5%) | 115 (9%) |
| J01 ANTIBACTERIALS FOR SYSTEMIC USE | 1 | 407 | 283 (69.5%) | 60 (14.7%) | 17 (4.2%) | 10 (2.5%) | 37 (9.1%) |
| J05 ANTIVIRALS FOR SYSTEMIC USE | 4 | 3,498 | 1,490 (42.6%) | 1,187 (33.9%) | 307 (8.8%) | 54 (1.5%) | 460 (13.2%) |
| J06 IMMUNE SERA AND IMMUNOGLOBULINS | 1 | 2,104 | 1,030 (49%) | 166 (7.9%) | 103 (4.9%) | 72 (3.4%) | 733 (34.8%) |
| L01 ANTINEOPLASTIC AGENTS | 12 | 5,256 | 1,671 (31.8%) | 1,139 (21.7%) | 526 (10%) | 269 (5.1%) | 1,651 (31.4%) |
| L02 ENDOCRINE THERAPY | 1 | 241 | 75 (31.1%) | 43 (17.8%) | 21 (8.7%) | 13 (5.4%) | 89 (36.9%) |
| L03 IMMUNOSTIMULANTS | 1 | 365 | 82 (22.5%) | 30 (8.2%) | 14 (3.8%) | 11 (3%) | 228 (62.5%) |
| L04 IMMUNOSUPPRESSANTS | 28 | 24,017 | 9,841 (41%) | 2,676 (11.1%) | 1,563 (6.5%) | 869 (3.6%) | 9,068 (37.8%) |
| M01 ANTIINFLAMMATORY AND ANTIRHEUMATIC PRODUCTS | 1 | 411 | 296 (72%) | 22 (5.4%) | 23 (5.6%) | 14 (3.4%) | 56 (13.6%) |
| M03 MUSCLE RELAXANTS | 1 | 622 | 416 (66.9%) | 62 (10%) | 16 (2.6%) | 8 (1.3%) | 120 (19.3%) |
| M05 DRUGS FOR TREATMENT OF BONE DISEASES | 2 | 617 | 436 (70.7%) | 30 (4.9%) | 21 (3.4%) | 11 (1.8%) | 119 (19.3%) |
| N01 ANESTHETICS | 1 | 323 | 96 (29.7%) | 43 (13.3%) | 13 (4%) | 7 (2.2%) | 164 (50.8%) |
| N02 ANALGESICS | 7 | 2,125 | 1,423 (67%) | 178 (8.4%) | 104 (4.9%) | 69 (3.2%) | 351 (16.5%) |
| N03 ANTIEPILEPTICS | 1 | 102 | 47 (46.1%) | 22 (21.6%) | 4 (3.9%) | 6 (5.9%) | 23 (22.5%) |
| N05 PSYCHOLEPTICS | 1 | 210 | 126 (60%) | 22 (10.5%) | 20 (9.5%) | 7 (3.3%) | 35 (16.7%) |
| N06 PSYCHOANALEPTICS | 1 | 522 | 414 (79.3%) | 50 (9.6%) | 24 (4.6%) | 6 (1.1%) | 28 (5.4%) |
| N07 OTHER NERVOUS SYSTEM DRUGS | 2 | 597 | 290 (48.6%) | 68 (11.4%) | 49 (8.2%) | 20 (3.4%) | 170 (28.5%) |
| R03 DRUGS FOR OBSTRUCTIVE AIRWAY DISEASES | 4 | 2,344 | 850 (36.3%) | 210 (9%) | 174 (7.4%) | 78 (3.3%) | 1,032 (44%) |
| R06 ANTIHISTAMINES FOR SYSTEMIC USE | 1 | 302 | 209 (69.2%) | 18 (6%) | 2 (0.7%) | 2 (0.7%) | 71 (23.5%) |
| R07 OTHER RESPIRATORY SYSTEM PRODUCTS | 1 | 345 | 149 (43.2%) | 42 (12.2%) | 16 (4.6%) | 5 (1.4%) | 133 (38.6%) |
Peer Reviews
No public reviews on file for this paper yet. If you reviewed it on a platform where reviews are public (OpenReview, ICLR, NeurIPS, ICML), you can paste yours below so the community can read it here.
Videos
No videos yet. Explain this paper in a talk, walkthrough, or lecture? Add one.
Taxonomy
TopicsMigraine and Headache Studies · Pharmacovigilance and Adverse Drug Reactions · Opioid Use Disorder Treatment
Introduction
1
Headache is a temporary or permanent functional disorder of the central nervous system, affecting a substantial proportion of the global population (1). It is estimated that nearly 50% of adults experience at least one headache per year (2), with a significant number progressing to chronic or disabling forms, such as migraine or tension-type headache (3). Beyond primary headache disorders, many cases are drug-induced, either as a direct adverse effect or due to medication overuse (4, 5). Medications targeting the central nervous system or cardiovascular system are commonly associated with the onset or aggravation of headaches (6–8).
The mechanisms behind drug-associated headaches (DAH) vary and often drug-specific. Some agents, such as nitrates, phosphodiesterase inhibitors, and calcium channel blockers, induce headaches through vasodilation and increased cerebral blood flow (9, 10). Others, including selective serotonin reuptake inhibitors (SSRIs) (11, 12) and hormonal therapies (13, 14), may alter neurotransmitter balance, leading to headache development. Additionally, analgesic overuse is a well-documented cause of medication-overuse headache (MOH), creating a vicious cycle of pain and dependency (15). Although evidence supports drug-induced headache as a recognized phenomenon, its detection in clinical practice remains inconsistent. Diagnostic ambiguity arises from overlapping symptom profiles and the inherent difficulties in isolating causative agents in patients with complex medication histories.
Current evidence on DAH primarily derives from case reports, observational studies, and clinical trials focused on specific drug classes, with limited systematic evaluation across broader therapeutic categories. We hypothesize that certain medications will show statistically significant disproportionality signals for headache compared to other drugs in the FDA Adverse Event Reporting System (FAERS) database. Therefore, current study aimed to address that gap by utilizing data from the FAERS and applying disproportionality analysis to explore the association between drug use and the reporting of headache as an adverse drug event (ADE). The study aims to identify drugs most frequently linked to headache reports, assess the strength of these as-sociations using statistical signal detection methods, and classify headache-related signals across various therapeutic classes based on the Anatomical Therapeutic Chemical (ATC) classification system. The current study's approach builds upon prior pharmacovigilance studies using FAERS data, such as Musialowicz et al. (16), which analyzed headache associations from 2018 to 2020 using reporting odds ratio (ROR) (16). By extending the timeframe to 2024, incorporating proportional reporting ratio (PRR) and ATC classification analyses, and including data on newly approved agents like CGRP monoclonal antibodies (e.g., galcanezumab and eptinezumab), this study provides an updated and expanded evaluation.
Material and methods
2
Data source
2.1
The FAERS served as the primary data source, providing access to patient demographics, drug exposure information, and spontaneously reported AEs. Our study period ranged from Quarter 1-2018 to Quarter 4-2024, identifying drugs and therapeutic classes most strongly associated with headache. The database was accessed via FDA's FAERS Public Dashboard (https://fis.fda.gov/extensions/FPD-QDE-FAERS/FPD-QDE-FAERS.html).
Data cleaning
2.2
A total of 28 quarters of data, spanning from Q1 2018 to Q4 2024, was downloaded and stored in XML format. Each quarterly dataset included patient demographics (DEMO), indication (INDI), drug use records (DRUG), therapy duration (THER), adverse event records (REAC), and patient outcomes (OUTC). To process the downloaded data in R (version 4.3.3), the dataset was initially cleaned in accordance with FDA recommendations for eliminating duplicate reports. For reports sharing the same CASEID, the one with the latest FDA_DT value was preserved. In instances where both CASEID and FDA_DT were identical, the report with the highest PRIMARYID was retained. Subsequently, the dataset was further refined to include only reports where the target drug was designated as the Primary Suspect (PS), enhancing the reliability of the study. To reduce potential confounding, secondary suspect and interacting drugs were excluded from the background counts for ROR and PRR calculations (17). All drugs reported in association with headache were extracted. Both brand and generic names were standardized for consistency. The term “headache” was identified using the MedDRA preferred term. No subtypes (e.g., migraine, tension-type) were specifically analyzed in this study to maintain uniformity and minimize diagnostic bias in spontaneous reports. Further details of this process are illustrated in Figure 1.
Flowchart of FAERS data selection and analysis for headache-related adverse events.
Statistical analysis
2.3
The descriptive analyses in our study included frequencies and proportions of reported headaches stratified by drug class, and demographic variables. Statistical analysis was conducted using disproportionality methods, specifically the ROR and PRR, to evaluate associations between drug exposures and reported headache events within the FAERS database. For each drug and ATC class, ROR and PRR were calculated along with corresponding 95% confidence intervals (CIs), allowing for the identification of signals suggestive of a potential link to drug-associated headaches. The formula is used for computing ROR is as follows (18):
The 95% CI for ROR is computed using the logarithmic transformation:
The PRR measures the proportion of headache reports for the drug of interest relative to all drugs. The formula used for computing PRR is as follows (19):
The 95% CI for PRR is similarly calculated using the logarithmic transformation:
Where:
- a: Number of reports with the drug of interest and headache.
- b: Number of reports with the drug of interest and other adverse events.
- c: Number of reports with other drugs and headache.
- d: Number of reports with other drugs and other adverse events.
A drug was considered to have a positive signal if both ROR and PRR exceeded the threshold of 1.0 with the lower bound of the 95% CI also above 1 (20). These disproportionality measures provided a robust and standardized approach to detect elevated reporting frequencies of headache relative to other adverse events, supporting the identification of drugs and therapeutic categories with significant risk profiles. Onset time was calculated by subtracting the drug start date (start_dt) from the adverse event date (event_dt) in the FAERS database. Only reports with complete and valid date pairs were included.
Results
3
The analysis utilized data from the FAERS database spanning from the first quarter of 2018 to the fourth quarter of 2024. Initially, the dataset comprised 12,150,602 adverse event reports. After data cleansing, which included the removal of duplicate records (2,613,846 cases: approximately 21.5% of the initial dataset), the refined demographic dataset contained 9,536,756 unique entries. From these, a total of 313,166 cases were identified where headache was reported as the PS adverse event. The 100 drugs most frequently associated with headache were selected for further analysis, which included disproportionality assessments using the ROR and Proportional Reporting Ratio PRR, as well as an ATC drug class analysis and time-to-onset evaluation. Figure 1 summarizes the FAERS data extraction and analysis steps, from initial reports to the final selection of headache-associated drugs.
The data regarding demographic and reporting characteristics of headache-related adverse events is presented in Table 1. The data was comprised individuals across various age groups, with the majority aged 51–65 years (21.35%), followed by 31–50 years (18.14%) and >65 years (15.44%), while 36.57% had missing age data. Females constituted the majority (66.66%), with males accounting for 23.18%, and 10.05% had missing sex data. Regarding weight, most records were missing (73.32%), while 21.22% weighed >50–≤100 kg, and 3.37% weighed >100 kg. The consumers were the most frequent reporters (54.72%), followed by health professionals (15.93%) and medical doctors (14.90%). Geographically, the United States contributed the majority of reports (65.87%), followed by Canada (12.06%), the United Kingdom (4.12%), and Denmark (2.36%), with 12.95% originating from other countries.
Table 2 presents Frequency, RORs and PRR of top 100 drugs Associated with headache. Among the drugs analyzed for headache as an adverse drug reaction, glecaprevir/pibrentasvir exhibited the highest ROR at 10.445 (95% CI: 10.001–10.908), indicating a strong association with the reported outcome. This was closely followed by sofosbuvir/velpatasvir with an ROR of 9.729 (95% CI: 9.338–10.137), and eptinezumab-jjmr with an ROR of 6.775 (95% CI: 6.302–7.283). Other drugs with notably high RORs included abaloparatide (6.268), ledipasvir/sofosbuvir (5.937), and galcanezumab-gnlm (4.251), suggesting a relatively higher likelihood of reporting associated adverse events. On the opposite end of the spectrum, acetaminophen showed one of the lowest RORs at 0.05, followed closely by cetirizine hydrochloride (0.062), leflunomide (0.076), and metformin (0.078), reflecting a comparatively lower signal for adverse event reporting.
The top 10 most frequently reported drugs associated with headache, based on adverse event report frequency, were led by apremilast with 8,694 reports, making it the most commonly implicated agent. This was followed by treprostinil (7,014) and adalimumab (6,981). Tofacitinib citrate ranked fourth with 6,594 reports, closely followed by dupilumab (5,799) and human immunoglobulin G (5,725). The list also included ofatumumab (4,314), fingolimod hydrochloride (4,085), secukinumab (3,463), and methotrexate (3,188).
The pharmacovigilance analysis, stratified by ATC classification (Table 3), revealed significant variations in the association between drug classes and headache as an adverse drug reaction (ADR). Calcium homeostasis agents showed the strongest risk (ROR = 6.268), followed by systemic antivirals (ROR = 4.259), other hematological agents (ROR = 3.215), systemic antibacterials (ROR = 2.53), and anti-acne preparations (ROR = 2.365). Intermediate risks were observed for drugs treating bone diseases (ROR = 1.823), antiepileptics (ROR = 1.541), and sex hormones and modulators of the genital system (ROR = 1.101). The analysis revealed several noteworthy patterns regarding reporting frequency and risk magnitude. Immunosuppressants accounted for the highest number of reports (n = 28) yet demonstrated low risk (ROR = 0.423), while Antineoplastic agents, despite frequent reporting (n = 12), similarly showed weak association (ROR = 0.322). Cardiovascular agents including Calcium channel blockers and Antihypertensives displayed consistently low risk profiles. Figure 2 summarizes the ATC class signal values for the top drugs linked to headache reports.
Signal strength (ROR) of the top drug classes associated with headache reports, stratified by ATC classification.
Table 4 presents headache onset timing across different drug classes. Ofatumumab. abaloparatide and fingolimod hydrochloride exhibited the highest proportion of early-onset headaches (≤7 days), reported in 78.6%, 69.5% and 58.5% of cases, respectively. In contrast, treprostinil and infliximab-dyyb showed delayed onset patterns, with 59% of headaches occurring after 90 days. Moreover, nirmatrelvir/ritonavir demonstrated a sharp decline in headache reports beyond the first week, with only 5.4% occurring after 90 days. Among immunosuppressants, vedolizumab and adalimumab had substantial late-onset cases (47% and 53.2%, respectively. Dupilumab and macitentan displayed intermediate distributions, with 37.9% and 51.3% of headaches emerging after 90 days.
The analysis of headache onset timelines across different ATC drug categories is presented in Table 5. It was revealed that the drugs used in diabetes (A10) and anti-inflammatory/antirheumatic agents (M01) had the highest proportion of early-onset headaches (≤7 days), occurring in 64.5% and 72% of cases, respectively. Similarly, calcium homeostasis agents (H05) and antibacterials (J01) showed rapid onset, with 69.5% of headaches reported within the first week. In contrast, antithrombotic agents (B01) and pituitary/hypothalamic hormones (H01) exhibited delayed reactions, with 47% and 52.1% of headaches occurring after 90 days. Immunosuppressants (L04), despite being the most frequently reported drug class (n = 24,017), demonstrated a balanced distribution, with 41% early-onset and 37.8% delayed-onset headaches. Antivirals (J05) displayed a unique bimodal pattern, with 42.6% early-onset and a sharp decline after the first month, while immunostimulants (L03) had the highest delayed-onset rate (62.5% after 90 days).
Figure 3 illustrates the distribution of drugs associated with headache as an ADR across different ATC categories. The largest number of drugs was found in the “L04 Immunosuppressants” category, with 28 drugs, followed by “B01 Antithrombotic Agents” with 5 drugs. Other categories, such as “J05 Antivirals for Systemic Use” and “N02 Analgesics,” also included several drugs linked to headache as an ADR. In contrast, categories like “B06 Other Hematological Agents” and “H03 Thyroid Therapy” contained only a single drug associated with this adverse effect.
Distribution of drugs in different ATC categories associated with headache as ADR.
Discussion
4
Our study reviewed data from the FAERS spanning from 2018 to 2024, providing a comprehensive overview of medications potentially associated with headache as an ADR. The refined dataset, consisting of 9,536,756 unique reports, highlights 313,166 cases where headache was reported as the primary suspected adverse event. We used disproportionality analysis by ROR and PRR to identify drugs with strong associations to headache.
Demographic Patterns in headache reports
4.1
Our findings showed that females constituted the majority of reports (66.66%), consistent with evidence that women have a 1.5- to 1.7-fold higher risk of adverse drug reactions than men (21–23). The potential contributing factors include sex-based differences in pharmacokinetics (e.g., hepatic metabolism, cytochrome P450 activity), pharmacodynamics, hormonal influences, and immunological responses, as well as higher medication use among women (24, 25).
The majority of headache cases in our study occurred in individuals aged 51–65 years, a population likely more susceptible to polypharmacy and chronic disease treatments, both known contributors to headache-related adverse drug reactions (4, 26). This aligns with evidence that elderly patients, particularly women, frequently experience headaches as ADRs, often linked to antivirals, antidepressants, and analgesics, with nearly half of cases classified as serious (4). Polypharmacy exacerbates this risk, as seen in primary headache disorders where comorbidities and prophylactic treatments drive high medication burdens (26, 27). However, the substantial proportion of missing data for age (36.57%) and sex (10.05%) suggests potential limitations in reporting completeness, which may influence the generalizability of these findings. Furthermore, the predominance of reports from the USA (65.87%) and Canada (12.06%) reflects the strength of North American pharmacovigilance systems, such as the FDA's FAERS, but may introduce geographic bias, underscoring the need for harmonized international data collection to enhance generalizability.
Associations with antivirals and other high-ROR drugs
4.2
Our analysis identified strong associations between headache and direct-acting antivirals (DAAs), particularly glecaprevir/pibrentasvir (ROR = 10.445) and sofosbuvir/velpatasvir (ROR = 9.729). This elevated reporting may reflect sampling bias from registration studies, where structured AE collection leads to higher frequencies than in routine clinical use, as evidenced by real-world data showing milder headache incidence (28–30). While DAAs like glecaprevir/pibrentasvir maintain high efficacy and tolerability, the consistency of headache reports across studies suggests a class effect warranting patient education and proactive management (31, 32).
Immunomodulatory drugs and headache frequency
4.3
Furthermore, our analysis revealed significant associations between headache and several medications, including eptinezumab-jjmr (ROR = 6.775), abaloparatide (ROR = 6.268), ledipasvir/sofosbuvir (ROR = 5.937), and galcanezumab-gnlm (ROR = 4.251). While these drugs serve distinct therapeutic purposes—from migraine prevention (eptinezumab, galcanezumab) to osteoporosis treatment (abaloparatide) and HCV therapy (ledipasvir/sofosbuvir)—headache emerges as a common adverse effect across these classes. Conversely, drugs like acetaminophen and cetirizine hydrochloride displayed low RORs (0.05 and 0.062, respectively), suggesting that these agents have a minimal association with headache. However, the elevated ROR for galcanezumab-gnlm (4.251) raises concerns about its long-term tolerability, despite favorable clinical trial safety profiles. The occurrence of headache as an ADR could indicate a failure of these medications to effectively prevent migraines. However, the elevated RORs for CGRP monoclonal antibodies like eptinezumab and galcanezumab may reflect indication bias, a known limitation of FAERS where drugs prescribed for headache-related conditions over-represent such reports, as noted by Musialowicz et al. (16). Excluding headache-related indications for bias control is challenging due to incomplete FAERS data, with elevated RORs likely reflecting migraine patient reporting patterns rather than causality. The high frequencies for these migraine-targeted mAbs in Table 2 likely arise from indication and sampling biases in registration trials, where headache monitoring is intensive, potentially over-representing events in FAERS compared to broader post-marketing surveillance (33).
Abaloparatide, an anabolic treatment for osteoporosis, exhibits a high ROR (6.268), which may reflect the occurrence of headache as an ADR. The drug demonstrates robust efficacy in increasing bone mineral density (BMD) in both men and postmenopausal women (34, 35). However, the randomized controlled trials (RCTs) of subcutaneous (SC) and transdermal formulations have reported headache as part of the safety profile, with the SC 80 μg dose showing a headache incidence of 16.1%, and the transdermal formulation showing an incidence of 9.9%.
Ledipasvir/sofosbuvir, a key hepatitis C therapy, achieved high sustained virologic response rates in cirrhotic patients, yet its high ROR (5.937) in our study may be linked to reported adverse effects like headache and fatigue (36).
Furthermore, our study findings demonstrated that immunomodulatory drugs, specifically apremilast, treprostinil, and adalimumab were frequently associated with headaches as an ADR. Apremilast, a PDE-4 inhibitor used in psoriasis and psoriatic arthritis (37), demonstrates a notable incidence of headache, particularly in the first two months of treatment, though symptoms often diminish over time (38). Similarly, treprostinil, an oral prostacyclin analogue for pulmonary arterial hypertension, commonly induces headache as a side effect, affecting nearly 70% of patients in clinical trials (39). Adalimumab, a TNF-α antagonist for Crohn's disease, also shows headache as a frequent ADR, though its benefits in maintaining remission often outweigh this risk (40).
The mechanisms underlying headache induction may differ among these drugs. Despite these variations, the consistent prevalence of headache across such therapies suggests that immunomodulatory agents, particularly those targeting chronic inflammatory conditions may inherently elevate headache risk. Prophylactic measures, such as melatonin or triptans for apremilast-associated headaches (38), or NSAIDs for acute cases, could mitigate this burden without compromising treatment efficacy.
ATC classification and risk profiles
4.4
The ATC classification analysis revealed that calcium homeostasis agents exhibited the highest risk ratio for headache (ROR = 6.268), suggesting a strong association between calcium-modulating drugs and headache induction. This finding aligns with existing literature demonstrating that both hypercalcemia (41) and hypocalcemia (42) are linked to headache pathophysiology, possibly due to role of calcium in neuronal excitability and vascular tone regulation. The drugs such as teriparatide, a calcium-regulating agent used in osteoporosis, were frequently associated with headache-related treatment discontinuation (43), further supporting the clinical relevance of this association. Similarly, calcium-based diagnostic tests, such as the calcitonin stimulation test, have been reported to induce headache as a common adverse reaction (44), reinforcing the notion that calcium homeostasis plays a critical role in headache generation. This high signal for calcium homeostasis agents (ROR = 6.268) may relate to their impact on neuronal excitability and vascular tone, as hypocalcemia or hypercalcemia disrupts cerebral blood flow, warranting monitoring in osteoporosis patients (41, 42). It is important to note that RORs indicate reporting disproportions rather than confirmed causal associations, necessitating further clinical validation. Similarly, systemic antivirals' association (ROR = 4.259) could stem from direct neuroinflammatory effects or interactions in chronic infections like HCV, though real-world studies confirm headaches are typically transient (45).
Moreover, systemic antivirals had a significantly higher risk ratio for inducing headaches (ROR = 4.259). This finding aligns with Musialowicz et al. (16), who identified antivirals (e.g., glecaprevir) and pulmonary hypertension medications (e.g., selexipag, epoprostenol) as having the strongest association with headaches (16).
Time-to-onset patterns by drug
4.5
Our findings highlighted that early-onset headaches (within 7 days of treatment initiation) are most frequently associated with ofatumumab, abaloparatide and fingolimod hydrochloride (78.6%, 69.5% and 58.5% of cases, respectively). This aligns with existing literature, as Zhou et al. (46) identified headache as a common adverse event linked to ofatumumab, often occurring within the first 30 days of therapy (46), while case reports describe persistent, new daily persistent headache-like symptoms in patients starting fingolimod (47). Similarly, apremilast and human immunoglobulin G were associated with early headache onset, corroborating studies showing apremilast-induced headaches typically emerging within the first month (48, 49) and IVIg-related cephalalgia often manifesting during or shortly after infusion (50, 51). Fingolimod-associated headaches often persists for months, resembling secondary headache disorders, yet they remain manageable in most cases without discontinuation (47). For IVIg, slower infusion rates and lower baseline blood pressure were identified as risk factors (51), implicating hemodynamic or immunological mechanisms.
On the other hand, drugs such as treprostinil and infliximab-dyyb, which showed a higher frequency of late-onset headache (occurring after more than 90 days of use), point to the possibility of delayed adverse reactions in patients. These patterns suggest the need for intensified early monitoring (≤7 days) for drugs like ofatumumab and fingolimod to mitigate acute risks, while long-term follow-up (>90 days) for agents like treprostinil could prevent delayed ADRs, informing personalized pharmacovigilance strategies. It may reflect distinct pathophysiological mechanisms associated with prolonged drug exposure. Clinical trials has reported that treprostinil, a prostacyclin analogue used in pulmonary arterial hypertension, was associated with persistent headache in 25%–34% of patients, often necessitating dose adjustments or discontinuation due to its vasodilatory effects (52, 53).
Time-to-onset patterns by ATC category
4.6
The ATC classification analysis revealed psychoanaleptics (N06) had the highest headache incidence (79.3% within 7 days of treatment initiation), followed by anti-inflammatory drugs (M01, 72%) and bone disease medications (M05, 70.7%). The psychoanaleptics such as amphetamine and dextroamphetamine are reported to cause headache with frequencies of 4% and 6% (54), respectively, further supporting the observed trend in our study. Similarly, a randomized controlled trial in ADHD children found Amphetamine Mixture—Dextroamphetamine Salts and Amphetamine Salts (Adderall) treatment, particularly at higher doses, increased headache severity per parental BSEQ reports, alongside other dose-dependent side effects like appetite loss and insomnia (55).
The association between anti-inflammatory drugs like ibuprofen and headache as an adverse drug reaction may be explained by medication-overuse headache, a disabling condition that contributes to chronic headache progression (56). The key risk factors for MOH include younger age (<50 years), female sex, anxiety/depression, physical inactivity, metabolic syndrome, and specific medications like tranquilizers and opioids (57–59). While ibuprofen showed a lower individual risk compared to triptans or opioids, dependency-like behaviors in MOH patients occur more frequently with opioid/triptan overuse than with NSAIDs.
Limitations and future directions
4.7
While this study offers valuable insights, it is important to acknowledge several limitations inherent in the use of the FAERS database, including the reliance on spontaneous reporting, which may lead to underreporting, particularly for mild side effects such as headaches compared to more severe ADRs. Additionally, the database lacks critical details such as dosage, duration of use, and patient comorbidities, potentially impacting causality assessment. Drugs indicated for headache treatment, such as CGRP monoclonal antibodies, may inflate reporting rates due to their therapeutic context, this circularity is unlikely to significantly bias results given the large dataset (9,536,756 reports) and diverse drug classes analyzed. Future research could address these gaps through clinical cohort studies or randomized controlled trials to better establish drug-headache associations. Although the study identifies commonly reported medications linked to headaches, the absence of consensus on the optimal data mining algorithm for ADR detection led to the selection of ROR due to its simplicity and higher sensitivity.
Conclusion
5
This comprehensive pharmacovigilance analysis underscores the importance of careful monitoring of drugs associated with headache as an ADR, especially those in high-risk categories such as immunosuppressants and systemic antivirals. The time-to-onset analysis highlights the need for surveillance strategies, with further mechanistic data needed for tailored approaches, particularly for drugs with a high likelihood of early-onset headaches. These findings contribute to a better understanding of the pharmacological profiles of drugs commonly used in clinical practice and inform monitoring strategies based on reporting patterns. Further research into the mechanisms underlying drug-induced headaches and the development of preventive measures is essential to optimize therapeutic outcomes and minimize adverse effects.
The reference list from the paper itself. Each links out to its DOI / PubMed record.
- 1Meng W Sui L. Headache disorders: a persistent public health challenge for the under 50s. Front Neurol. (2024) 15:1501749. 10.3389/fneur.2024.150174939507627 PMC 11538006 · doi ↗ · pubmed ↗
- 2Stovner LJ Hagen K Linde M Steiner TJ. The global prevalence of headache: an update, with analysis of the influences of methodological factors on prevalence estimates. J Headache Pain. (2022) 23:34. 10.1186/s 10194-022-01402-235410119 PMC 9004186 · doi ↗ · pubmed ↗
- 3Murphy C Hameed S. “Chronic Headaches,” in Stat Pearls [Internet]. Treasure Island: Stat Pearls Publishing (2023).32644509 · pubmed ↗
- 4Monteiro C Dias B Vaz-Patto M. Headache as an adverse reaction to the use of medication in the elderly: a pharmacovigilance study. Int J Environ Res Public Health. (2021) 18:2674. 10.3390/ijerph 1805267433799926 PMC 7967518 · doi ↗ · pubmed ↗
- 5Ashina S Terwindt GM Steiner TJ Lee MJ Porreca F Tassorelli C Medication overuse headache. Nat Rev Dis Primers. (2023) 9:5. 10.1038/s 41572-022-00415-036732518 · doi ↗ · pubmed ↗
- 6Beckmann YY Seçkin M Manavgat Aİ Zorlu N. Headaches related to psychoactive substance use. Clin Neurol Neurosurg. (2012) 114:990–9. 10.1016/j.clineuro.2012.02.04122424726 · doi ↗ · pubmed ↗
- 7Samsam M. Central nervous system acting drugs in treatment of migraine headache. Cent Nerv Syst Agents Med Chem. (2012) 12:158–72. 10.2174/18715241280243014722533510 · doi ↗ · pubmed ↗
- 8Kalkman DN Couturier EG El Bouziani A Dahdal J Neefs J Woudstra J Migraine and cardiovascular disease: what cardiologists should know. Eur Heart J. (2023) 44:2815–28. 10.1093/eurheartj/ehad 36337345664 · doi ↗ · pubmed ↗