Epetraborole pharmacokinetics/pharmacodynamics in the hollow fiber system model of Mycobacterium tuberculosis
Sanjay Singh, Megan Devine, Tawanda Gumbo, Shashikant Srivastava

TL;DR
The study finds that high doses of epetraborole may be needed to treat tuberculosis, but these doses could be unsafe for patients.
Contribution
The study identifies an optimal exposure target for epetraborole and evaluates its dosing safety in TB treatment.
Findings
An AUC0-24/MIC ratio of 327.1 is the optimal target for epetraborole against Mycobacterium tuberculosis.
High intravenous doses of epetraborole may not be safe for most patients.
Monte Carlo simulations suggest current dosing regimens may be ineffective for many patients.
Abstract
In the hollow fiber system model of tuberculosis (TB), the ratio of area under the concentration-time curve to MIC (AUC0-24/MIC) of 327.1 was identified as the epetraborole optimal exposure target for Mycobacterium tuberculosis kill. Monte Carlo simulation experiments showed that even the intravenous dose of 1,500 mg/twice daily would fail in the majority of patients, and the dose needed for good efficacy for TB may likely not be safe for patients.
Genes, proteins, chemicals, diseases, species, mutations and cell lines named across the full text — each resolved to its canonical identifier and authoritative record.
Click any figure to enlarge with its caption.
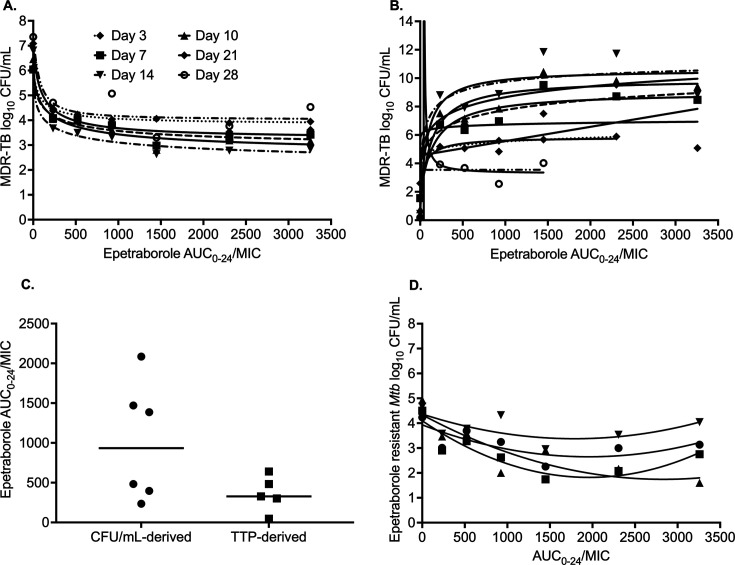 Fig 1
Fig 1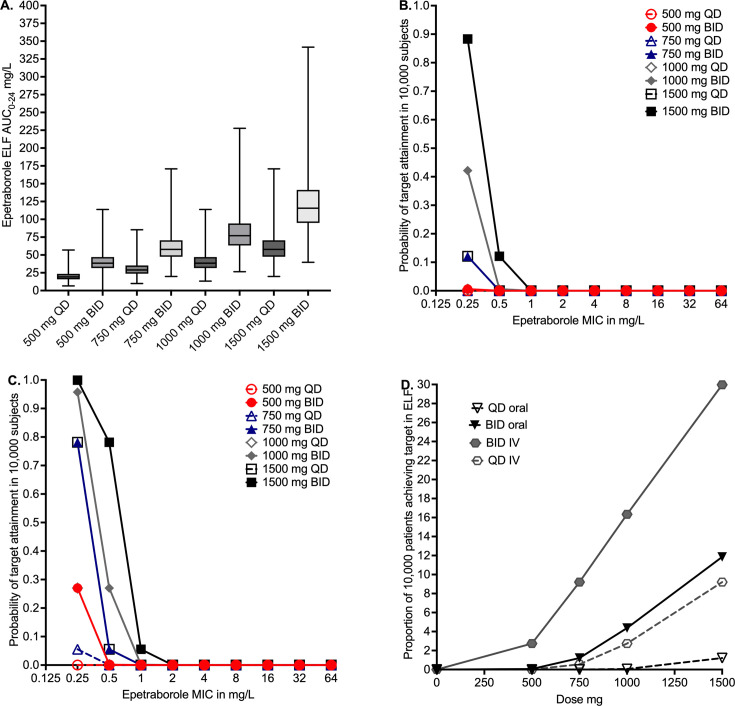 Fig 2
Fig 2| Day 3 | Day 7 | Day 10 | Day 14 | Day 21 | Day 28 | |
|---|---|---|---|---|---|---|
| Log10 CFU/mL
Inhibitory Sigmoid | ||||||
| | 6.12 | 6.04 | 6.46 | 6.81 | 7.08 | 7.35 |
| | 2.30 | 3.22 | 3.97 | 4.94 | 3.86 | 3.33 |
| | 0.84 | 0.61 | 0.58 | 0.41 | 0.85 | 1.16 |
| EC50 (mg*h/L) | 76.02 | 142.8 | 134.7 | 70.23 | 94.49 | 71.13 |
| Corrected AIC | 24.43 | 49.10 | 48.77 | 44.58 | 52.86 | 60.65 |
| | 0.99 | 0.94 | 0.96 | 0.99 | 0.94 | 0.82 |
| TTP Inhibitory Sigmoid
| ||||||
| | 2.60 | 1.56 | 0.78 | 0.45 | No convergence | 0.18 |
| | −94.46 | −12.30 | −16.43 | −11.17 | No convergence | −6.53 |
| | 0.13 | 0.33 | 0.27 | 0.53 | No convergence | ~3.19 × 10⁻⁴ |
| EC50 (mg*h/L) | 3.06 × 10¹² | 957.00 | 1357.00 | 47.35 | No convergence | ~ 3.92e−083 |
| Corrected AIC | Not estimated | 64.93 | 65.33 | 72.84 | No convergence | Not estimated |
| r2 | Not estimated | 0.92 | 0.94 | 0.88 | No convergence | 0.87 |
| TTP 3 parameter agonist versus tesponse | ||||||
| Bottom (TTP, days) | 2.60 | 1.62 | 0.82 | 0.46 | 0.21 | 0.18 |
| Top (TTP, days) | 5.85 | 9.02 | 9.94 | 10.59 | 6.85 | 3.32 |
| Span (TTP, days) | 3.25 | 7.40 | 9.12 | 10.13 | 6.64 | 3.14 |
| EC50 (mg*h/L) | 81.78 | 159.90 | 123.20 | 75.37 | 11.77 | 0.00 |
| Corrected AIC | 26.83 | 23.92 | 24.60 | 31.03 | 33.22 | 26.83 |
| | 0.98 | 0.91 | 0.93 | 0.88 | 0.71 | 0.85 |
| Quadratic function | ||||||
| %
Resistant- | 1.37 | 4.10 | 1.69 | 3.73 | ||
| AUC0–24/MIC for resistance suppression | 30,143.09 | None | 3,104.03 | 3,896.87 | ||
| Corrected AIC | 14.46 | 12.88 | 18.75 | 15.21 | ||
| | 0.90 | 0.44 | 0.52 | 0.78 | ||
- —National Institute of Allergy and Infectious Diseaseshttp://dx.doi.org/10.13039/100000060
- —National Institute of Allergy and Infectious Diseaseshttp://dx.doi.org/10.13039/100000060
- —Eunice Kennedy Shriver National Institute of Child Health and Human Developmenthttp://dx.doi.org/10.13039/100009633
Peer Reviews
No public reviews on file for this paper yet. If you reviewed it on a platform where reviews are public (OpenReview, ICLR, NeurIPS, ICML), you can paste yours below so the community can read it here.
Videos
No videos yet. Explain this paper in a talk, walkthrough, or lecture? Add one.
Taxonomy
TopicsAntibiotics Pharmacokinetics and Efficacy · Innovative Microfluidic and Catalytic Techniques Innovation · Cancer therapeutics and mechanisms
INTRODUCTION
Multidrug-resistant (MDR) tuberculosis (TB) has been declared a global emergency (1). The latest World Health Organization’s (WHO) global TB report estimated a total of 10.8 million people fell ill with TB in 2023, and an estimated 1.25 million died (2). The number of new antibiotics for clinical development to treat TB infections is limited, and the progress is further restricted by the high cost of drug development (3, 4). Therefore, the repurposing of drugs has been suggested to expedite the process to improve the treatment of drug-resistant TB (5). Here, we present the pharmacokinetics/pharmacodynamics (PK/PD) of epetraborole in the preclinical hollow fiber model system of TB (HFS-TB). Epetraborole is an oxaborole compound that inhibits bacterial leucyl transfer RNA synthetase and is currently undergoing clinical development with a focus on non-tuberculous mycobacteria (NTM), namely, Mycobacterium avium and Mycobacterium abscessus (3, 6). This study reports the minimum inhibitory concentration (MIC) distribution of epetraborole in drug-susceptible and drug-resistant clinical isolates of Mycobacterium tuberculosis (Mtb), a PK/PD study in the HFS-TB and in silico clinical trial simulations.
First, we performed MIC studies with 48 clinical isolates of Mtb (27 from Texas, USA, and 21 from Pretoria, South Africa). Twenty-six Mtb isolates were drug-susceptible, four were isoniazid mono-resistant, and 18 isolates were MDR-TB. The epetraborole MIC distribution for the 48 clinical isolates is shown in Table S1, where the MICs ranged between 0.25 mg/L and 64 mg/L, and the cumulative MIC for 50% of isolates (MIC_50_) was 2 mg/L, while the MIC_90_ was 32 mg/L. We observed that the epetraborole MICs were not affected by the pre-existing antimicrobial resistance to the first-line drugs.
Next, we performed an HFS-TB epetraborole PK/PD study using an extensively drug-resistant (XDR)-TB strain that had an epetraborole MIC of 0.5 mg/L. The epetraborole concentration-time profiles of six different doses in HFS-TB and model diagnostics are shown in Fig. S1A through C. The epetraborole clearance rate in the HFS-TB was 0.01 ± 0.00 L/h, the volume of distribution was 0.25 ± 0.04 L, and the half-life was 15.59 ± 1.72 h. The PK models were used to calculate the AUC_0-24_ achieved in each HFS-TB (equivalent to those achieved in the lung) and AUC_0-24_/MIC ratios (Table S2).
Figure S2A through H shows the total Mtb burden (as CFU/mL) and the epetraborole-resistant subpopulation versus time. All epetraborole exposures kept the total bacterial burden below stasis (day 0 or inoculum) for up to 14 days, after which resistance to epetraborole monotherapy emerged. The highest exposure, AUC_0-24_/MIC = 3258.46, had the least epetraborole-resistant subpopulation after 28 days of monotherapy.
The relationship between epetraborole AUC_0–24_/MIC exposure and Mtb burden based on CFU/mL readout was modeled using the inhibitory sigmoid Emax model (Equation 1 in Supplemental methods), with results shown in Fig. 1A and Table 1. Use of peak concentration (C_max_) to MIC and % of time concentration persisted above MIC (%T_MIC_) resulted in poorer corrected Akaike Information Criteria (AICc) score (7), although C_max_/MIC scores were similar in some instances because C_max_/MIC is co-linear with AUC/MIC. As regard the Mycobacteria Growth Indicator Tube liquid culture system-derived culture time-to-positive (TTP), model comparisons for inhibitory sigmoid Emax curve versus three-parameter agonist curves (Equation 2 in Supplemental methods) are shown in Table 1. Table 1 shows that the three-parameter model had better AICc scores each day than the four-parameter model, before even penalizing the four-parameter model for complexity. Therefore, the three-parameter model was chosen, with between-sampling day curves shown in Fig. 1B. The TTP-derived EC_80_ values were compared to those from CFU/mL readout in Fig. 1C. The median EC_80_ for TTP was an AUC_0-24_/MIC of 327.1 (95% confidence interval [CI]: 47.08–639.6) versus CFU-derived AUC_0-24_/MIC of 934.3 (95% CI: 235–2,065), P = 0.049.
Epetraborole exposure-response relationship in the HFS-TB. (A) Curve fitting for each sampling day based on the CFU/mL readouts. (B) Curve fitting for each sampling day based on the MGIT-derived TTP readouts. (C) Comparison of EC80 values calculated using CFU/mL and TTP-derived readouts. (D) Exposure-dependent epetraborole antimicrobial resistance in the HFS-TB. (MGIT, Mycobacteria Growth Indicator Tube).
TABLE 1: Summary of epetraborole PK/PD model parameter estimates across sampling days in the HFS-TBa
Next, modeling of AUC_0–24_/MIC versus effect for the drug-resistant CFU/mL, using the antibiotic resistance arrow of time, revealed the curves shown in Fig. 1D. The use of PK/PD parameters such as C_max_/MIC and %T_MIC_ resulted in poorer AICs and fits. Figure 1D shows a system of U-shaped curves that change with time, consistent with the antibiotic-resistance arrow of time in the HFS-TB and in the patients (8–10). Figure S3 could be more intuitive as it plots the resistant subpopulation as % of the total in each HFS-TB, with parameter estimates shown in Table 1. In Fig. S3, whereby amplification of resistance is defined as mediating a % of resistant subpopulation higher than in non-treated controls, the TTP-derived EC_80_ amplifies drug-resistance minimally to none at all, while the CFU-derived EC_80_ will amplify drug-resistance. The AUC/MIC shutting down all AMR is shown in Table 1.
Finally, we used the recently published Monte Carlo experiments (MCE) for epetraborole in silico dose-finding, using the population PK parameters based on Ganesan et al*.* (11) (S. Singh, G. D. Boorgula, M. H. Nguyen, et al., unpublished data). Figure 2A shows the AUC_0–24_ predicted to be achieved in the epithelial lining fluid (ELF) of doses with oral administration in 10,000 virtual subjects in the MCE. Figure 2B shows that none of the oral doses had a >90% probability of target attainment (PTA) even with twice daily dosing. Figure 2C shows that even with 1,500 mg twice daily intravenous dosing, PTA falls below 90% at an MIC of 0.5 mg/L. Figure 2D shows the cumulative fraction of response (CFR) for the different doses, where the highest intravenous dose achieved a CFR of only 30%.
Monte Carlo experiments. (A) AUC0–24 with four different epetraborole doses with two administration routes, using population PK modeling. Notably, the AUCs with different doses overlap due to PK variability. This means that a dose-response study in patients would likely not yield conclusive results, highlighting the translational utility of the in silico approach. (B) None of the oral epetraborole doses, irrespective of the dosing schedule, showed >90% PTA. (C) Intravenous dosing showed better PTA compared to oral dosing. However, PTA for even the highest dose, 1,500 mg twice a day, falls below 90% at an MIC of 0.5 mg/L. (D) CFR for the different doses showing that none of the tested epetraborole doses achieved EC80 in >90% of patients.
In summary, we showed that epetraborole has efficacy against both drug-susceptible and MDR Mtb, and epetraborole exposures killed XDR-TB in the HFS-TB. However, monotherapy failed due to resistance emergence. The epetraborole PK/PD optimized exposure target for drug-resistant Mtb kill in the HFS-TB model was determined as AUC_0–24_/MIC of 934.3 for CFU/mL readout, while for TTP, readout was an AUC_0–24_/MIC of 327.1, and the MCE found that even a dose of 1,500 mg twice a day (i.e., 3,000 mg/day) would fail to achieve a PTA of >90% beyond epetraborole MIC of 0.25 mg/L. This means that most Mtb isolates were epetraborole-resistant using this PK/PD susceptibility breakpoint. Thus, the epetraborole exposures required for the therapeutic effect likely cannot be achieved with a safe clinical dose.
The reference list from the paper itself. Each links out to its DOI / PubMed record.
- 1John B. 1680. The life and death of Mr Badman. Christian Classics Ethereal Library, Grand Rapids, MI.
- 2World Health Organization. 2024. Global tuberculosis report 2024. Geneva, Switzerland World Health Organization
- 3Butler MS, Henderson IR, Capon RJ, Blaskovich MAT. 2023. Antibiotics in the clinical pipeline as of December 2022. J Antibiot (Tokyo) 76:431–473. doi:10.1038/s 41429-023-00629-837291465 PMC 10248350 · doi ↗ · pubmed ↗
- 4Listed NA. 2024. NCATS drug repurposing. Seeking new treatments using existing drugs. NCATS/NIH. Available from: www.ncats.nih.gov/preclinical/repurpose
- 5Ramón-García S, González Del Río R, Villarejo AS, Sweet GD, Cunningham F, Barros D, Ballell L, Mendoza-Losana A, Ferrer-Bazaga S, Thompson CJ. 2016. Repurposing clinically approved cephalosporins for tuberculosis therapy. Sci Rep 6:34293. doi:10.1038/srep 3429327678056 PMC 5039641 · doi ↗ · pubmed ↗
- 6AN 2 therapeutics, Inc. Amendment no. 1 to form S-1 registration statement under the securities act of 1933. 2022. United states securities and exchange commission. Washington, D.C
- 7Akaike H. 1974. A new look at the statistical model identification. IEEE Trans Automat Contr 19:716–723. doi:10.1109/TAC.1974.1100705 · doi ↗
- 8Deshpande D, Pasipanodya JG, Mpagama SG, Srivastava S, Bendet P, Koeuth T, Lee PS, Heysell SK, Gumbo T. 2018. Ethionamide pharmacokinetics/pharmacodynamics-derived dose, the role of MI Cs in clinical outcome, and the resistance arrow of time in multidrug-resistant tuberculosis. Clin Infect Dis 67:S 317–S 326. doi:10.1093/cid/ciy 60930496457 PMC 6260165 · doi ↗ · pubmed ↗