Genetic Diversity of Fresh Maize Germplasm Revealed by Morphological Traits and SSR Markers
Suying Guo, Xin Zheng, Shuaiyi Wang, Yuran Ai, Rengui Zhao, Jinhao Lan

TL;DR
This study evaluates genetic diversity in fresh maize using both physical traits and DNA markers, finding that DNA markers provide more reliable classification.
Contribution
The study demonstrates that SSR markers are more effective than phenotypic traits for classifying genetic diversity in fresh maize inbred lines.
Findings
Phenotypic analysis grouped 200 maize lines into four clusters with distinct distributions.
SSR markers revealed an average of 5.75 alleles per locus and a mean PIC of 0.70, indicating high genetic diversity.
Molecular clustering showed different group distributions compared to phenotypic grouping, confirming greater genetic divergence.
Abstract
Background: This study aims to systematically evaluate the genetic divergence among 200 fresh maize inbred lines using both phenotypic and molecular markers, and to compare the efficacy of these two approaches for genetic classification. Methods: Phenotypic clustering analysis was conducted based on eight key agronomic traits, including plant height and ear length. Additionally, molecular analysis was performed using 40 Simple Sequence Repeat (SSR) primer pairs, resulting in the generation of 230 polymorphic alleles. The polymorphism information content (PIC) was calculated to evaluate the discriminatory power of the markers. Results: Phenotypic analysis categorized the inbred lines into four groups, comprising 25, 38, 97, and 40 lines, respectively, with benchmark lines distributed across Groups I and III. SSR analysis revealed a high level of genetic diversity, with an average of 5.75…
Genes, proteins, chemicals, diseases, species, mutations and cell lines named across the full text — each resolved to its canonical identifier and authoritative record.
Click any figure to enlarge with its caption.
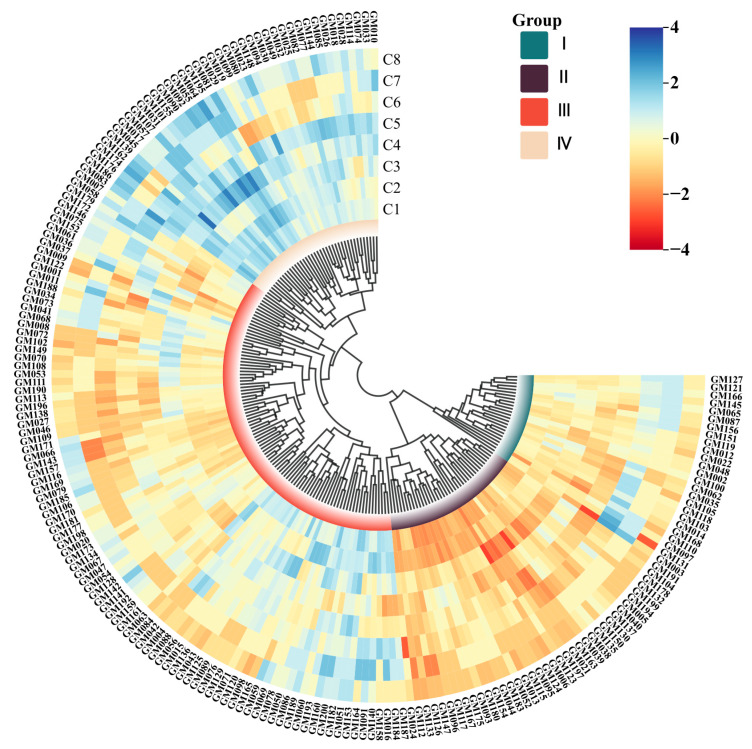 Figure 1
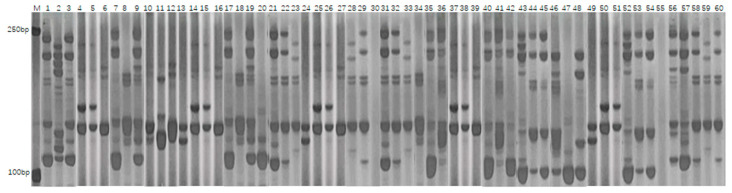 Figure 2
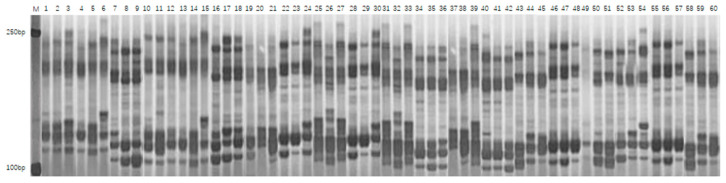 Figure 3
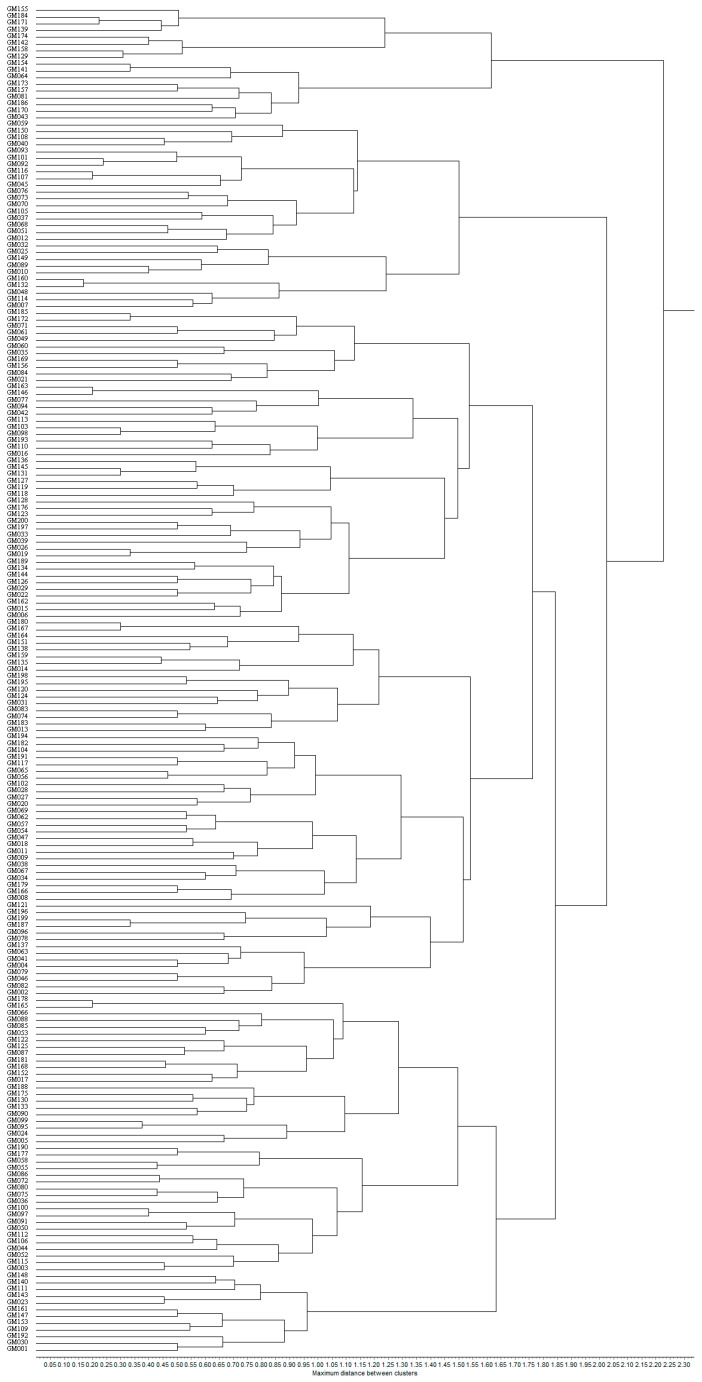 Figure 4
- —Shandong Provincial Key Research and Development Program (Competitive Innovation Platform)
Peer Reviews
No public reviews on file for this paper yet. If you reviewed it on a platform where reviews are public (OpenReview, ICLR, NeurIPS, ICML), you can paste yours below so the community can read it here.
Videos
No videos yet. Explain this paper in a talk, walkthrough, or lecture? Add one.
Taxonomy
TopicsGenetics and Plant Breeding · Genetic Mapping and Diversity in Plants and Animals · Crop Yield and Soil Fertility
1. Introduction
Fresh maize is a specialty type that is highly valued for its unique flavor and nutritional richness. Both its global cultivation area and market demand have experienced remarkable growth. Agricultural restructuring plays a significant role in increasing farmers’ income and meeting consumers’ demands for diverse agricultural products. Fresh maize is primarily categorized into three types: sweet corn, waxy corn, and sweet-waxy corn. From a genetic classification perspective, sweet corn can be further divided into normal sweet maize, super sweet maize (which includes sh2, bt1, and bt2 genotypes), and enhanced sweet maize (se) [1]. Waxy corn, also known as glutinous corn or waxy maize, is characterized by an endosperm starch composed almost entirely of amylopectin. This unique composition imparts a distinctive sticky texture and a soft, chewy consistency when cooked. In comparison to sweet corn, waxy corn exhibits a lower sugar content, typically ranging from 5% to 10%. This type originated from a recessive mutation in the Wx gene located on the short arm of chromosome 9 in common maize (Zea mays L.), which results in its distinct glutinous properties upon cooking. Based on kernel coloration, waxy corn can be classified into several types: white waxy corn, yellow waxy corn, purple waxy corn, black waxy corn, and multicolored waxy corn [2]. Among these, white and yellow waxy corn types are the most commonly consumed in daily life. Sweet-waxy corn is a hybrid type that combines the desirable traits of both sweet corn and waxy corn. This innovative type produces ears that contain both sweet and glutinous kernels on the same cob, thereby satisfying consumer demand for a dual-texture experience that offers both sweetness and chewiness [3,4].
In 2022, the cultivation area of fresh maize in China expanded significantly, reaching over 1.666 million hectares. This growth trajectory has persisted, further solidifying China’s position as the global leader in maize production. This consistent expansion is driven by steadily increasing yields and the maturation of cultivation technologies. Consequently, China has successfully established itself as the world’s largest producer of fresh maize, thereby securing a prominent position in the global fresh maize market [5].
The development of fresh maize types is essential for agricultural advancement. In hybrid breeding programs, the selection of appropriate parental lines is critical. Breeders generally cross elite parental lines that exhibit desirable traits, including early maturity, high yield, and superior quality, to create high-performance hybrid types.
Phenotypic trait evaluation, commonly referred to as morphological markers, serves as a method for assessing plant genetic diversity through the observation and statistical analysis of external morphological characteristics [6]. The investigation and classification of phenotypic traits represent the most intuitive approach. This method has been extensively utilized in preliminary species assessments [7,8,9]. To date, phenotypic studies have been conducted on various crops, including rice [10], wheat [11], maize [12], and mung bean [13,14]. However, phenotypic markers demonstrate significant limitations: the number of measurable traits is restricted, their expression is influenced by environmental factors, leading to genetically unstable manifestations, and they may obscure inherent genetic variation among alleles, as similar phenotypic expressions can arise from different alleles. With the advancements in molecular marker technologies, DNA-based detection methods have increasingly been adopted as standard practices by official institutions, such as the International Union for the Protection of New Varieties of Plants (UPOV). This trend is attributed to their higher detection efficiency, greater polymorphism, and enhanced genetic stability [15].
The relatively limited genetic diversity in Chinese maize germplasm primarily results from a long-term overreliance on four key inbred lines: The repeated utilization of Reid, Lancaster, Tangsipingtou, and Lüda Red Cob in breeding programs has resulted in a narrowed genetic base [16]. This genetic bottleneck not only constrains the discovery and exploitation of favorable alleles, thereby impeding the advancement of maize breeding in China, but it also contributes to cultivar degeneration and reduced stress tolerance. Ultimately, this undermines the resilience of the agricultural system to natural disasters [17]. Consequently, the enrichment and innovation of germplasm through the accumulation of novel genetic resources has emerged as a critical objective for maize breeding research and development in China.
This study systematically evaluates the genetic diversity of fresh maize germplasm resources in China and investigates the difference between morphological markers and SSR molecular marker analyses. This research hypothesizes that, despite a potentially narrow overall genetic base in existing germplasm, strong selection for specific consumer-oriented traits, such as sweetness and waxiness, has driven divergence at key genomic loci. Consequently, we propose that the three flavor types-sweet corn, waxy corn, and sweet-waxy corn-may represent distinct genetic groups, defined more by these selected regions than by overall genetic variability. By integrating both phenotypic and molecular-level data analyses, we aim to establish a comprehensive phenotype-genotype database comprising 200 inbred lines. This initiative will elucidate the characteristics of population structure and genetic relationships, ultimately facilitating the identification of parental materials with breeding potential. Furthermore, it will provide a theoretical foundation for the selection of hybrid combinations in fresh maize.
2. Materials and Methods
2.1. Materials
A total of 200 fresh maize inbred lines, representing a diverse range of genetic backgrounds, were collected from various geographical regions and uniformly designated as GM001 to GM200. This collection includes four benchmark inbred lines: GM002 (Ye478), GM003 (Dan340), GM007 (Mo17), and GM171 (Qi319), which serve as standard testers. The remaining 196 accessions represent newly acquired germplasm materials sourced from various production areas. The experimental materials utilized in this study were procured from the following suppliers: primers from Sangon Biotech (Shanghai) Co., Ltd., Shanghai, China, and other reagents from Yicheng Chemical Reagent Business Department, Tai’an, China.
2.2. Methods
2.2.1. Field Experiment Design, Phenotypic Trait Investigation, and Seed Character Evaluation Methods
In mid-June 2022, all 200 experimental materials were planted at two locations: the Mizhou Seed Industry Experimental Base in Zhucheng, Weifang, Shandong Province (36°23′ N, 119°24′ E) and the experimental field in Pingdu, Qingdao, Shandong Province (36°47′ N, 119°58′ E). The trial employed a non-replicated design, with each plot consisting of two rows containing twenty plants per row. The planting configuration maintained a spacing of 60 cm between rows and 30 cm between plants within each row. Throughout the entire growth cycle of the fresh maize inbred lines, field management practices—including intertillage, irrigation and fertilization regulation, as well as pest and disease control—were strictly implemented in accordance with local commercial production standards. The total experimental area at each site was approximately 800 square meters. From the central area of each accession’s plot, five representative plants exhibiting uniform growth and free from pests or diseases were systematically selected.
During the experimental period, three categories of phenotypic traits were systematically investigated: field performance traits, agronomic traits, and yield component traits. Field performance traits encompass the observable and measurable characteristics of crops during growth in field conditions. These traits are crucial for evaluating plant growth status, yield potential, stress resistance, and quality parameters. These traits serve as fundamental indicators for monitoring crop development and adaptation. Agronomic traits represent measurable characteristics associated with crop growth dynamics, yield formation processes, and quality attributes throughout the production cycle. As critical benchmarks for assessing cultivar performance and the effectiveness of cultivation management, these traits provide essential guidance for agricultural production practices aimed at enhancing both the quantity and quality of yield. Yield-component traits encompass all characteristics that directly or indirectly influence crop productivity. These critical traits predominantly determine the final yield output and thus serve as primary objectives in crop genetic improvement and varietal development programs. The measurement and optimization of these traits are essential for achieving breeding targets and enhancing agricultural productivity. In this study, plant height, ear height, tassel length, and the number of tassel branches are classified as field performance traits. Ear length and ear diameter are categorized as agronomic traits. The number of kernel rows and the number of kernels per row are identified as yield-component traits.
2.2.2. Statistical Methods for Phenotypic Traits
Two hundred fresh maize inbred lines were classified into distinct groups through cluster analysis based on eight key phenotypic traits: plant height, ear height, tassel length, tassel branch number, ear length, ear diameter, kernel row number, and kernel number per row. The analysis was conducted using the Unweighted Pair Group Method with Arithmetic Mean (UPGMA) algorithm, implemented in R software (version 4.2.1). This hierarchical clustering approach facilitated the systematic grouping of inbred lines based on their phenotypic similarities. The resulting dendrogram illustrates the genetic relationships among various accessions.
2.2.3. SSR Analysis and Data Processing Methods
(1)In the analysis of genetic diversity, bands obtained through SSR silver staining were scored using a co-dominant scoring system. Homozygous loci were recorded with their corresponding allele fragment sizes (e.g., “215/215”), while heterozygous loci were recorded with both allele fragment sizes (e.g., “215/221”). Missing data were denoted as “9”. This scoring facilitated the construction of a comprehensive database. The genetic similarity coefficient (GS) and genetic distance (GD) between fresh maize inbred lines were calculated using Nei’s formula [18]. The specific formulas are expressed as follows: GS_ij_ = 2N_ij_/(N_i_ + N_j_) and GD_ij_ = 1 − GS_ij_. Here, N_ij_ represents the number of bands shared between inbred lines i and j, while N_i_ and N_j_ denote the total number of bands present in inbred lines i and j, respectively. These equations are critical for understanding the genetic similarities and differences among various inbred lines. After completing the calculations, a cluster analysis was performed using the UPGMA method to construct a dendrogram. The polymorphism information content (PIC) of each polymorphic locus was calculated according to the formula proposed by Smith et al. [19]: PIC = 1 − ∑f_i_^2^, where fi represents the allele frequency at locus i.(2)The IBM SPSS Statistics software (version 27.0) was employed to compare the phenotypic traits of fresh maize inbred lines for significant differences.
3. Results
3.1. Phenotypic Cluster Analysis
From June to September 2022, eight phenotypic traits were examined in 200 fresh maize inbred lines: plant height, ear height, tassel length, tassel branch number, ear length, ear diameter, kernel row number, and kernel number per row. Statistical analyses of the agronomic traits presented in Table 1 revealed significant genetic diversity across all measured characteristics. For the phenotypic cluster analysis, the average values of the eight traits from both locations were utilized (refer to Appendix A). The results demonstrated substantial variation, thereby providing a robust foundation for further assessments of genetic diversity and breeding applications.
The UPGMA (Unweighted Pair Group Method with Arithmetic Mean) cluster analysis was conducted using the comprehensive data presented in Table A1, with the results illustrated in Figure 1. This analysis demonstrated that the 200 fresh maize inbred lines were categorized into four primary clusters: Cluster I comprised 25 inbred lines, accounting for 12.50% of the total sample; Cluster II included 38 inbred lines, representing 19.00% of the total sample; Cluster III contained 97 inbred lines, constituting the largest proportion at 48.50%; and Cluster IV consisted of 40 inbred lines, making up 20.00% of the total sample. The detailed results of the phenotypic cluster analysis are presented in Table 2. This classification highlights significant phenotypic variation among the fresh maize inbred lines, with Cluster III identified as the most predominant group. The observed distribution patterns indicate potential genetic relationships and phenotypic diversity within the germplasm collection.
The results of the phenotypic cluster analysis indicated that 48.50% of the fresh maize inbred lines were categorized into Cluster III. Notably, the benchmark inbred lines GM002 and GM003 were classified within Cluster I, whereas GM007 and GM171 were assigned to Cluster III. These findings indicate that classification based solely on phenotypic traits has inherent limitations in accuracy, rendering it insufficient for the precise categorization of maize inbred lines. For comprehensive data, please refer to Figure 1.
3.2. Genetic Distance Analysis
Genetic distance analysis of 200 fresh maize inbred lines revealed a range of genetic distances from 0.308 to 0.902, with an average genetic distance of 0.657. This average value suggests that there are relatively distant genetic relationships among these inbred lines overall. Through further analysis of the data, the genetic differences among the research materials are clearly delineated in Table 3 and Table 4. As shown in Table 3, the genetic distance between the inbred lines GM013 and GM021 was only 0.308, the smallest among all pairs of inbred lines, indicating that they share closely related genetic backgrounds. Conversely, Table 4 indicates that the inbred lines GM176 and GM184 exhibited the highest genetic distance of 0.902 among all pairs, thereby demonstrating a significant genetic divergence between these two lines.
3.3. SSR Genetic Diversity and Cluster Analysis
3.3.1. Polymorphism Analysis of SSR Markers
PCR amplification was conducted using 40 SSR primer pairs on 200 fresh maize inbred lines, resulting in the detection of a total of 230 polymorphic alleles. The number of alleles identified per primer pair varied from 2 to 9, with an average of 5.75 alleles per locus. The polymorphism information content (PIC) of the primers ranged from 0.30 to 0.83, yielding an average value of 0.70, which indicates a high level of genetic diversity within the population. Notably, the primers umc2105g1 (PIC = 0.82) and bnlg2305g1 (PIC = 0.83) exhibited the highest levels of polymorphism, each identifying nine distinct alleles. The average heterozygosity rate among the inbred lines was 2.1%, indicating a high degree of genetic homozygosity in the materials. Figure 2 presents the electrophoretic separation patterns of PCR products amplified by the primer umc2105g1 across various inbred lines, whereas Figure 3 illustrates those amplified by the primer bnlg2305g1. The observed clear banding polymorphisms and significant differences in fragment sizes reflect the genetic variation among the materials. These results confirm that SSR markers are effective in revealing allelic diversity within the fresh maize population.
The analysis of the SSR marker polymorphism results indicated that the effective number of alleles per locus ranged from 1.71 to 7.92, with an average value of 4.93. This indicates both an uneven distribution of alleles within the population and substantial genetic diversity among the 200 inbred lines. Notably, primer bnlg2305g1 exhibited the highest level of polymorphism (PIC = 0.83), underscoring its remarkable ability to reveal genetic variations among maize materials. Comprehensive data are presented in Table 5.
3.3.2. SSR Marker-Based Cluster Analysis
The Unweighted Pair Group Method with Arithmetic Mean (UPGMA) was utilized to analyze 200 fresh maize inbred lines, resulting in their classification into four distinct clusters. Cluster I consisted of 53 inbred lines, representing 26.50% of the total samples. Cluster II, the largest group, comprised 102 inbred lines, accounting for 51.00% of the total. Cluster III consisted of 28 inbred lines, representing 14.00%, while Cluster IV included 17 inbred lines, making up 8.50% of the total. The detailed clustering results are illustrated in Figure 4, which demonstrates the genetic relationships and population structure among the fresh maize inbred lines.
As illustrated in Table 6, the benchmark selfing lines GM002, GM003, GM007, and GM171 were categorized into distinct taxa. In the study, GM003 (Dan 340) was classified as the first taxon, GM002 (Ye 478) as the second taxon, GM007 (M017) as the third taxon, and GM171 (Qi 319) as the fourth taxon. The four benchmark inbred lines can be accurately classified into their respective lineage taxa. Among all the fresh maize germplasm, GM013 and GM021 exhibited the shortest genetic distance, resulting in their clustering within the second taxon. In contrast, GM176 and GM184 displayed the greatest genetic distance, leading to their categorization into the second and fourth taxa, respectively. Based on the clustering results, it is evident that the clustering analysis utilizing SSR molecular markers can more accurately reflect the genetic associations among various fresh maize germplasm and elucidate their affinities.
4. Discussion
The SSR molecular marker technique has been extensively utilized in genetic diversity studies of maize germplasm owing to its high polymorphism, co-dominant inheritance, operational simplicity, and relatively low cost [20,21]. Wang et al. [22] analyzed 35 waxy maize inbred lines and 5 common maize types using SSR markers, successfully classifying them into 4 distinct groups consistent with their pedigree origins. Li et al. [23] characterized 144 sweet maize accessions, identifying seven major genetic clusters and 343 allelic variants, with a range of 4 to 17 alleles per locus and a mean of 8.58 alleles. Huang et al. [24] evaluated 54 sweet maize inbred lines using 56 SSR primers, revealing three primary genetic groups and 155 polymorphic loci. Lu et al. [25] assessed 87 fresh-eating maize inbred lines using 29 SSR markers. Their analysis revealed four genetic clusters and identified a total of 180 allelic variants, with a mean of 6 alleles per locus. The PIC ranged from 0.308 to 0.915. Zhao [26] conducted SSR analysis on 100 fresh maize germplasms, classifying them into six major genetic groups.
This study conducted a cluster analysis on eight major agronomic traits across 200 fresh maize inbred lines. The selected traits, consistent with the research of Tan et al. [27], exhibited highly significant variation. Following the methodology established by Marwa et al. [28], phenotypic traits served as critical criteria for germplasm evaluation. The test materials exhibited substantial genetic diversity, with clustering results categorizing them into four major groups. Notably, four benchmark inbred lines were distributed between Cluster I and Cluster III, indicating the limitations of relying solely on phenotypic clustering.
The application of SSR molecular marker technology has become increasingly prevalent in the breeding of fresh maize. SSR molecular markers are characterized by their high accuracy, enabling precise delineation of inbred lines of fresh maize. Qiu et al. [29] utilized molecular and morphological markers to examine the differences in quality and agronomic traits of fresh maize across various genetic backgrounds. Their study analyzed 41 test materials, revealing significant variation in both agronomic and quality traits, along with a high level of genetic diversity in SSR markers. The coefficients of variation for 12 agronomic and quality traits ranged from 1.72% to 36.10%, with a mean value of 14.06%. A total of 321 alleles were detected using 40 SSR markers, exhibiting polymorphic information content that varied from 0.179 to 0.866, with a mean value of 0.658. Additionally, gene diversity ranged from 0.186 to 0.877, with a mean value of 0.687. In this study, we utilized 40 pairs of SSR primers exhibiting high polymorphism and stable banding patterns to analyze the genetic diversity of 200 fresh maize inbred lines. A total of 230 allelic loci were detected, with the number of alleles per primer pair ranging from 2 to 9, averaging 5.75. The mean value of the polymorphism information content (PIC) was found to be 0.70. Among the primers, umc2105g1 and bnlg2305g1 exhibited the highest number of allelic loci. Notably, bnlg2305g1 not only had the highest number of allelic sites but also recorded the highest Polymorphic Information Content (PIC) value. This suggests that SSR molecular marker technology is particularly effective in detecting genetic polymorphisms in maize [30]. In this study, 200 fresh maize inbred lines with diverse genetic backgrounds were classified into four primary clusters through UPGMA cluster analysis. Comparison with phenotypic clustering revealed that SSR molecular marker technology is more accurate in classifying maize inbred line taxa. Additionally, the classification of self-inherited line germplasm using this marker can categorize maize germplasm resources from various sources into distinct lineages, thereby providing a foundation for future hybrid breeding. Numerous studies have demonstrated that SSR marker technology is extensively utilized in the fields of plant genetics and germplasm resource research, providing a valuable reference for subsequent related investigations [31,32,33].
The estimation of genetic distance is a crucial aspect of the comprehensive study of crop type origins and the elucidation of kinship relationships among populations [34,35]. The genetic distance analysis of 200 fresh maize inbred lines revealed that the inbred lines GM013 and GM021 share a closer kinship relationship and genetic background. In contrast, the inbred lines GM176 and GM184 exhibited significant genetic divergence, indicating that they are more distantly related and may serve as effective parental materials for the breeding of new maize types. There are significant genetic differences between the autografts GM176 and GM184, indicating their more distant relationship, enhanced hybrid vigor, and greater genetic diversity. These characteristics suggest that they can serve as parental lines for the cultivation of new maize autograft types [36,37].
5. Conclusions
A clustering analysis was conducted on eight phenotypic traits of 200 fresh maize inbred lines, resulting in the classification of the materials into four major clusters. The first cluster comprised 25 inbred lines, including the benchmark lines GM002 (Ye 478) and GM003 (Dan 340). The second cluster contained 38 inbred lines, while the third cluster encompassed 97 inbred lines, including the benchmark lines GM007 M017 and GM171 Qi 319. The fourth cluster included 40 inbred lines. Notably, the third cluster represented 48.5% of the total inbred lines analyzed.
A total of 230 allelic loci were detected using SSR molecular markers, with an average of 5.75 alleles identified per primer pair. The mean polymorphism information content (PIC) value was found to be 0.70. Genetic distance analysis revealed significant differences among the self-inbred lines, with GM013 and GM021 exhibiting the smallest genetic distance, while GM176 displayed the largest genetic distance from GM184.
SSR clustering divided the materials into four major clusters, with the benchmark inbred lines GM002, GM003, GM007, and GM171 distributed across different clusters. Compared to phenotypic clustering, the SSR clustering results demonstrated a higher reliability in effectively differentiating distinct clusters. Additionally, 200 fresh maize inbred lines exhibited significant genetic diversity.
The reference list from the paper itself. Each links out to its DOI / PubMed record.
- 1Li Y.L. Suo H.C. Research progress on endosperm mutant genes and molecular breeding in waxy maize Chin. Agric. Sci. Bull.2019352127
- 2Zhao J.R. Lu B.S. Shi Y.X. Xu L. Current status of waxy maize breeding and industry development in China J. Maize Sci.2016246771
- 3Song Q.H. Kong L.L. Liu J.F. Zhang Y. Yang Y.H. Creation and identification techniques of sweet-waxy double recessive genotype maize materials China Veg.201852832
- 4Shi Z.S. Zhong X.M. Principles and technical skills for breeding new waxy maize varieties J. Maize Sci.20162415
- 5Guo J.T. Zhang L. Li Y.X. Zhang H. Ping X.M. Development status and countermeasures of fresh maize industry in Yunnan Province Agric. Technol.202444177180
- 6Song X.B. Quantitative Definition of Phenotypic Traits and Genetic Analysis of Chrysanthemum Cultivars Beijing Forestry University Beijing, China 2018
- 7Du Z.Z. Li X.X. Song J.P. Wu Y.H. Zhao Q. Xu T. Zhang X.H. Hellier B. Hu J.G. Wang H.P. Phenotypic diversity analysis and preliminary evaluation of adaptability in 228 introduced garlic resources J. Plant Genet. Resour.20192011861196
- 8Hu B.L. Wan Y. Li X. Lei J.G. Luo X.D. Yan W.G. Xie J.K. Genetic diversity analysis and comprehensive evaluation of phenotypic traits in rice core collections Acta Agron. Sin.20123882983910.3724/SP.J.1006.2012.00829 · doi ↗