Multi-Morbidity at Death and the US Disadvantage in Mortality
Magali Barbieri, Aline Désesquelles, Viviana Egidi, Luisa Frova, Francesco Grippo, France Meslé, Marilena Pappagallo, Sergi Trias-Llimós

TL;DR
The US has higher mortality rates than countries like France, Italy, and Spain, largely due to more people dying from multiple health conditions.
Contribution
This study quantifies how multi-morbidity at death contributes to the US mortality disadvantage compared to peer countries.
Findings
Multi-morbid processes account for 51-75% of the US life expectancy gap with Italy, Spain, and France.
The US has disproportionately high rates of multi-morbidity at death compared to other high-income countries.
Multi-morbidity is concentrated in the 20–85 age range in the US.
Abstract
The US experiences significant excess mortality compared to peer countries. The literature indicates that a similar disadvantage affects morbidity and, more generally, the prevalence of risk factors for major diseases within the US population. In this study, we assess the impact of multi-morbidity at death on the mortality gap between the US and three other high-income countries with comparable data, namely France, Italy, and Spain. The study relies on an analysis of the multiple cause-of-death information available on all death certificates for 2017, used to classify morbid processes leading to death into three categories: simple, multi-morbid, and ill-defined. The results show disproportionately high rates of multi-morbid processes in the US compared with the other three countries. Multi-morbid processes contribute 51% of the US gap in life expectancy at birth with Italy, 73% with…
Genes, proteins, chemicals, diseases, species, mutations and cell lines named across the full text — each resolved to its canonical identifier and authoritative record.
Click any figure to enlarge with its caption.
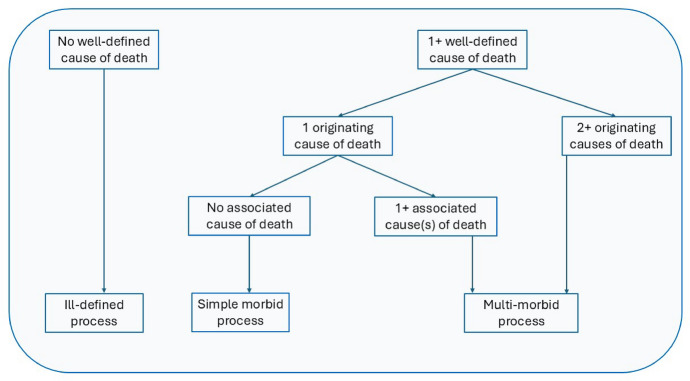 Figure 1
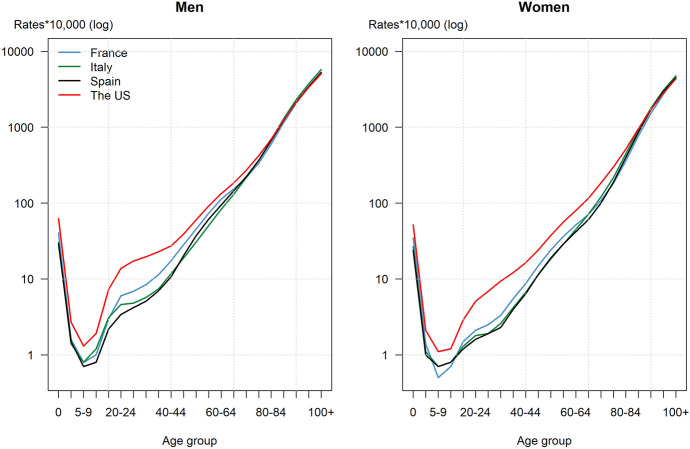 Figure 2
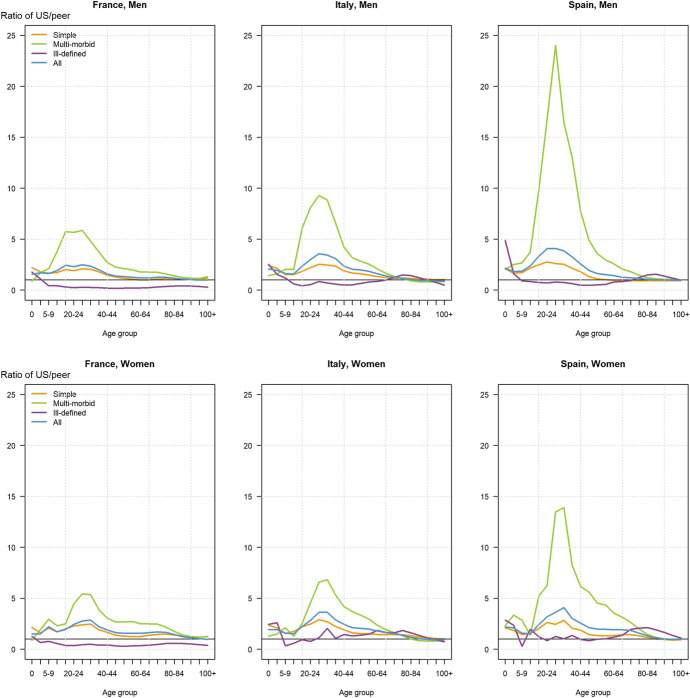 Figure 3
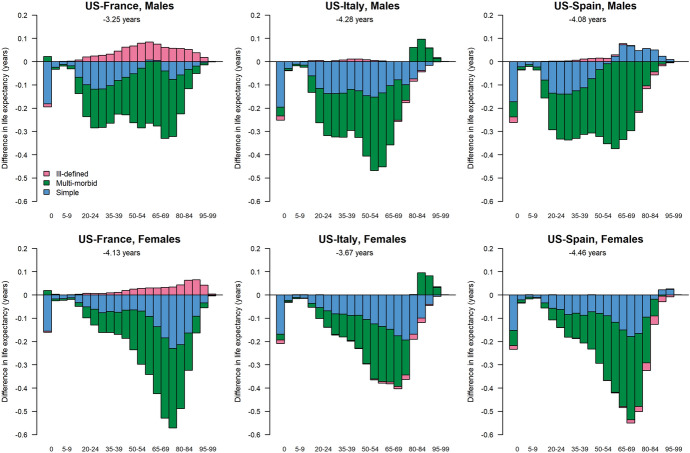 Figure 4
- —Center for the Economics and Demography of Aging, University of California, Berkeley
- —Spanish Ministry of Science and Innovation
Peer Reviews
No public reviews on file for this paper yet. If you reviewed it on a platform where reviews are public (OpenReview, ICLR, NeurIPS, ICML), you can paste yours below so the community can read it here.
Videos
No videos yet. Explain this paper in a talk, walkthrough, or lecture? Add one.
Taxonomy
TopicsChronic Disease Management Strategies · Healthcare cost, quality, practices · Healthcare Policy and Management
Introduction
Progress in survival in the United States (US) has been lagging behind that in peer countries starting around 1980. The phenomenon has generated a large body of literature, including two comprehensive reports by the National Research Council (National Research Council, 2011 and 2013) and a more recent study by the National Academies of Sciences, Engineering, and Medicine (Harris et al., 2021). These and other works have highlighted the characteristics of the US shortfall in survival. They demonstrated that the US experiences higher mortality at every age, though which age group most contributes to the difference with peer countries depends on the indicators used for the comparison. While ages below 65 and, especially, below 50 years most contribute to the divergence in the age-specific mortality rates, older ages (65 years and above) contribute more to the growing gap in life expectancy at birth (Barbieri, 2021; Dowd et al., 2024; Ho, 2013; Ho & Preston, 2010; Manton & Vaupel, 1995). They further showed that the US disadvantage is attributable to all causes of death, with external causes (including drug overdoses) contributing more at younger adult ages and cardiovascular diseases at older ages (Timonin et al., 2024). Thus, no specific age group or disease has been identified as the single culprit for the US disadvantage in mortality, necessitating a global, rather than focused, examination to better understand the situation.
The literature suggests that rates of morbidity for most chronic diseases, major risk factors, and disability, are higher in the US than in most peer countries, with higher prevalences of cardiometabolic diseases, some cancers, digestive diseases, hypertension, diabetes, and obesity (Banks et al., 2006; Chowdhury et al., 2023; Garmany & Terzic, 2024; Ho et al., 2021; Martinson et al., 2022; Murray et al., 2013; Pongiglione et al., 2022; Salive, 2013). The prevalence of multi-morbidity appears to have increased for cohorts born since World War II in the US (Bishop, Haas and Quinones, 2022; Freedman et al., 2013; King et al., 2018; Martin & Schoeni, 2014). The phenomenon is not specific to the US but its acceleration has been faster there than in European countries (Gimeno et al., 2024; Haas et al., 2017; Lafortune & Balestat, 2007). Two factors operate in concert to increase the share of the population with multi-morbidities in low mortality countries, namely medical progress and population aging. Medical progress and the ability to prevent deaths from a range of chronic conditions extends the lives of people affected by these conditions. The situation is exasperated by population aging as older people are more likely to suffer from concomitant chronic diseases and conditions since time and the increased vulnerability with age are major factors in the accumulation of health problems.
In a context of rapidly aging societies and the rising burden of chronic diseases due to improved survival from cancer, cardiovascular diseases, and other conditions, monitoring the prevalence of multi-morbidity is essential for public health. Furthermore, the increasing burden of obesity, diabetes, and hypertension in most populations, together with the expected multiplication of health crises such as pandemics and extreme weather events due to globalization and climate change generate susceptibilities in the population that could further increase the prevalence of multi-morbidity, as exemplified by the prevalence of long COVID, a risk factor for death in people with pre-existing conditions (Frieden et al., 2021; Haileamlak, 2022; Lipski, 2024; Parohan et al., 2020; Zhang et al., 2023). Such crises are known to both weaken individuals affected by chronic diseases, thus precipitating death, and create new fragilities in previously healthy individuals (Ashad-Bishop et al., 2023; Del Rio et al., 2020; Higgins et al., 2021; Hilser et al., 2024; Wang et al., 2023).
It is unclear to which extent the US multi-morbid pattern affects its mortality disadvantage as few studies have reliably assessed the contribution of various morbid processes. However, determining whether some countries exhibit a relative advantage in the prevalence of multi-morbidity is an important step to identify possible mitigating factors and to develop strategies and programs to alleviate the burden of poor health in later life (Navickas et al., 2016). Those who have attempted to conduct comparative analyses all acknowledge major weaknesses in their work due to heterogeneity in the setting of the studies they use for their comparisons. They point to the lack of standard methods for measuring multi-morbidity, the diversity of data sources and population samples, differences in the timing of data collection and in the definition of basic concepts, including multi-morbidity, and variations in the specific diseases and conditions selected for study (Boeckxstaens & Petrovic, 2020; Chua et al., 2021; Ho et al., 2021, 2022; Ricci-Cabello et al., 2015; Wittenberg, 2015).
Our goal is to fill some of the gap in knowledge about the contribution of multi-morbidity to the US disadvantage in mortality by examining the issue from a different angle than has been the case so far. Instead of combining different sources of data on co-morbidities in living populations, we are leveraging routinely collected data on causes of death to look at differences in the prevalence and pattern of multi-morbidity at death in the US and three high-income countries with very low mortality, namely France, Italy and Spain. As further explained below, we measure multi-morbidity strictly from the information available on death certificates. We use these data to compute a range of mortality indicators, each providing a different perspective on mortality patterns. We first compute age-specific and age-standardized mortality rates; we then assess the contribution of mortality in each age group to the US shortfall in life expectancy; and we calculate the number of excess deaths attributable to each process and the years of life that have been lost due to the US higher level of mortality. These calculations are carried out for each type of morbid process.
Data and method
The comparison countries have been chosen based on their low levels of mortality, the availability and accessibility of the complete multiple cause-of-death data, the comparability of their data collection and processing systems, similarly aging populations, and high-quality health care systems. The selected set includes France, Italy, and Spain, which rank among the top countries in the world in terms of life expectancy at birth. Like the US, the three countries are high-income democracies and all four study countries are large enough for statistical analysis. The study relies on the processing of the multiple cause-of-death information coded to the 10th Revision of the International Classification of Diseases (ICD-10) available in the national vital statistics systems of each of the four countries: the National Institute for Health and Medical Research (INSERM) in France, the National Institute of Statistics (ISTAT) in Italy, the National Institute of Statistics (INE) in Spain, and the National Center for Health Statistics (NCHS) at the Centers for Disease Control (CDC) in the US. All four countries implement automatic coding of the death certificates using similar software. We focused on the most recent year (2017) for which data were available in all four countries at the time of this analysis. The total number of deaths reached 424,523 in Spain, 591,530 in France, 650,590 in Italy, and 2,813,374 in the US.1 Death records were available by sex, age, and for all the medical causes reported on the certificate.
The four countries follow the guidelines of the World Health Organization (WHO, 2016) and use the recommended death certificate on which reporting physicians, medical examiners, or coroners list all the causes which have directly or indirectly contributed to death. Causes of death are listed on two different sections of the standard certificate form. Part I records the sequence of diseases or conditions which have ended in death, i.e., all medical causes involved in "the sequence of morbid conditions, lesions or poisoning that led directly to death" (WHO, 2015). This section theoretically includes the "underlying cause of death", that is the disease or injury that initiated the chain of events leading to death. Part 2 records all other causes which were not directly responsible for the sequence listed in Part 1 but which nonetheless "contributed significantly to death" (ibid.) by influencing the course of the morbid process, often designated as the associated or contributing causes. The analysis presented here relies on these multiple causes of death, which include all the causes listed anywhere on the death certificate.
Following an approach developed by Grippo et al., (2020, 2024), all deaths in our study are classified into one of three types of morbid processes: simple causal processes, multi-morbid processes, and ill-defined processes. Among all multiple causes of death, we identified the originating causes for each morbid process, that is the conditions that initiated the sequence of events that led directly to death, using the decision tables embedded in the IRIS system, a software implemented worldwide to automate coding of all causes of death reported on death certificates into ICD-10 and to identify the underlying cause of death (www.iris-institute.org). We define simple processes as those characterizing deaths with a single originating cause and no associated causes listed on Part 2 of the death certificate; multi-morbid processes as those characterizing deaths with associated causes or with more than one originating cause; and ill-defined processes as those characterizing deaths with only ill-defined causes, that is causes listed on the death certificate as unknown or as symptoms, signs or those that are poorly informative.2 Figure 1 summarizes the classification process and we refer the reader to Grippo and colleagues (2024) for additional details on the method.Fig. 1. Classifying deaths according to the morbid process
From the tabulation of deaths in each country by five-year age group, sex, and morbid process, we calculated the corresponding age-specific death rates using exposures from the Human Mortality Database ( Barbieri, 2015; HMD, 2022) for each of the four countries. From the age-specific death rates, we calculated age-standardized death rates, using the US exposures from the HMD as the reference. The rates are used to determine the contribution of the three types of morbid process to the difference in life expectancy between the US and each of the three comparison countries using a decomposition method proposed by Pollard (Pollard, 1988).
We also estimated the total and average number of years of life lost by the US, overall and separately from each type of morbid process, adapting a method developed by Preston and Vierboom (2021). First, we estimated the distribution of excess deaths in the US by sex, age group, and morbid process. We did so by applying the age- and sex-specific death rates for the three morbid processes of each comparison country to the US population in turn, and taking the difference between the actual and the estimated death counts. We then multiplied excess deaths in each age group and for each type of morbid process by the life expectancy at the corresponding age in the 2017 lifetable for the three comparison countries separately for each sex. Adding up all those years provided an estimate of the total number of years of life lost to the US if all these excess deaths could have been averted and had then been subjected to the mortality rates of the comparison countries. Dividing the total number of years of life lost by the overall number of excess deaths provided an estimate of the average number of years lost per excess death.
Results
We successively present the results of our analysis regarding differences in the age-standardized death rates, the age-specific death rates, the life expectancies, the excess death counts and the lost years of life, thus moving from the simplest to the most complex measures of mortality, each providing a different angle to the analysis. We describe the differences between the US and peer countries overall and for each type of morbid process, as well as by sex when the patterns differ for men and for women.
Age-standardized death rates
At 870 per 100,000 population for both sexes and all morbid process combined, the age-standardized death rate in the US is 30–40 percent higher than in the comparison countries. Though rates are much higher for men, both the absolute and the relative differences are larger for women: from 28 percent higher than in Italy to 40 percent higher than in France and Spain, compared with about 20 percent higher for men relative to each of the three peer countries.
We looked at the distribution of deaths across the three types of morbid processes in the four study countries and found that, for men, the age-standardized death rate attributable to simple processes represents 52% of the overall rate in France, 48% in Italy, 60% in Spain, and 49% in the US. The corresponding figures for multi-morbid processes are 37, 48, 37, and 48%. For ill-defined processes, they are 11, 4, 3, and 3%. For women, the shares are 54, 51, 61 and 52% for simple processes in France, Italy, Spain, and the US, respectively; 34, 45, 35, and 44% for multi-morbid processes; and 12, 4, 4, and 4% for ill-defined processes. These values thus show a similar share of multi-morbidity in the US than in Italy and a higher share than in France and Spain, for both males and females (Table 1).Table 1. Total number of deaths and life expectancy at birth by sex in France, Italy, Spain and the United States in 2017 and differences (in years) between each comparison country and the United StatesCountrySexTotal death countLife expectancy at birthDifference in life expectancy (peer-US)FranceMen292,87479.43.2Women298,65685.34.1Both sexes591,53082.43.7ItalyMen310,57580.44.2Women340,01584.93.7Both sexes650,59082.74.0SpainMen214,23680.34.1Women210,28785.74.5Both sexes424,52383.04.3The United StatesMen1,439,02076.2Women1,374,35481.2Both sexes2,813,37478.7Source: Authors’ calculations using cause-of-death data from national vital statistics systems of France (CepiDc-INSERM), Italy (ISTAT), Spain (INE), and the United States (NCHS), and population data from the Human Mortality Database (HMD, 2022)
However, when we look at how each type of process contributes to the difference in the age-standardized death rate between the US and peer countries, we find that the contribution of multi-morbid processes is much larger than for simple processes when comparing the US with France or Spain: the difference reaches 165 per 100,000 in absolute value for both sexes combined in the two countries, versus 83 and 32 per 100,000, respectively, for simple morbid processes (Table 2). When comparing the US with Italy, simple morbid processes contribute a little bit more than multi-morbid processes to the difference (i.e., for 96 and 81 per 100,000 for simple and multi-morbid processes). The pattern is very similar for men and for women though, again, rates are smaller for the latter. Note that the US experiences relatively low mortality from ill-defined processes, especially when compared with France which has the highest share of deaths from ill-defined causes among all four study countries. The age-standardized death rate from ill-defined process for both sexes combined stood at 78 per 100,000 in France compared with 31 in the US, 28 in Italy, and 24 in Spain.Table 2. Age-standardized death rates (all ages) per 100,000 by country, sex, and type of morbid process, 2017Type of morbid processMalesFemalesTotalFranceItalySpainThe USFranceItalySpainThe USFranceItalySpainThe USSimple457.3414.9519.8510.7278.7284.8315.9377.5353.9340.2404.7436.6Multi-morbid324.2417.1314.6506.4173.4255.3181.5319.7235.8320.9236.8401.8Ill-defined95.431.328.530.663.124.319.130.778.027.923.731.2All876.9863.3862.91047.7515.2564.5516.5727.9667.7688.9665.3869.6Source: Authors’ calculations using cause-of-death data from national vital statistics systems of France (CepiDc-INSERM), Italy (ISTAT), Spain (INE), and the United States (NCHS), and population data from the Human Mortality Database (HMD, 2022)
Age-specific death rates
The marked US disadvantage in mortality is not uniformly distributed across the age range (Appendix Tables 4-7). Mortality rates were higher in the US than in the three comparison countries for each sex and all ages up to 85 years for men and 95 years for women, but similar or very slightly lower at older ages (Fig. 2).Fig. 2. Age-specific mortality rates by sex in each country, all morbid processes combined.Source: Human Mortality Database (HMD, 2022)Fig. 3. Age-specific mortality rate ratio of US compared to peer countries by morbid process, for each sex, 2017.Source: Authors’ calculations using cause-of-death data from national vital statistics systems of France (CepiDc-INSERM), Italy (ISTAT), Spain (INE), and the United States (NCHS), and population data from the Human Mortality Database (HMD, 2022)
More specifically, at 6.3 per 1,000 for boys and 5.2 per 1,000 for girls, infant mortality is high in the US compared with France (where these same figures reach 4.0 and 3.5 per 1,000) and even more so compared with Italy (where they stand at 3.1 and 2.7 per 1,000) and Spain (at 2.9 and 2.4 per 1,000). However, the US disadvantage is particularly pronounced at ages 15–40 years. The maximum is reached at 25–29 years, when rates are 2.5 times higher for males than in France, 3.6 times than in Italy, and 4.1 times than in Spain. For that same age group, the ratios for females reach 2.8, 3.6 and 3.6 (though the ratio is higher in the age group 30 to 34 years compared to Spain only, at 4.1). Death rates in the US are also much higher for the surrounding age-groups, that is at 15–29 and 34–39 years for both sexes, especially relatively to Italy and Spain. The US disadvantage disappears at higher ages, that is starting at age 85 years compared with Spain and Italy and 95 compared with France. The US even exhibits a slight advantage compared with Italy at ages 85 years and above for men, 90 years and above for women but far from enough to compensate for the disadvantage at younger ages.
Figure 3 represents the ratio of the US age-specific mortality rates for each of the three morbid processes (simple, multi-morbid, and ill-defined) as well as for all morbid processes combined, in relation to those in each of the three comparison countries, separately for each sex.
At ages 25–29 years, when excess mortality in the US reaches its peak, the age-specific death rate for men from multi-morbid processes is 79 per 100,000 compared with 3 in Spain and 14 in Italy and in France. Thus, the US rate is 5 times higher than in France and Italy and an astonishing 26 times higher than in Spain. The corresponding rate for simple morbid processes in the US is higher, at 90 per 100,000, but closer to that in the three other countries (i.e., 34 in Spain, 42 in France, and 30 in Italy), thus “only” 2–3 times higher. For women, these values follow the same pattern, with US mortality rates from multi-morbid processes also 5–6 times higher than in France and Italy, though the gap with Spain is not as large as for men, with a US rate 14 times higher.
Excess mortality from multi-morbid processes in the US is also marked for the surrounding age groups (20–24 for men and 30–34 years for both men and women), though not as pronounced. The ratios then decline progressively from these age groups to the two extremes of the age distribution. Compared to Italy only, they even reverse at ages 80 years and above for both sexes, when the age-specific mortality rates from multi-morbid processes are about 10% lower in the USA. Except for these higher ages and for children below the age of 5, excess US mortality from multi-morbid processes is systematically higher than excess mortality from simple morbid processes for which the ratios never reach above 2.1 in any age group compared with France, 2.8 compared with Spain, and 3 compared with Italy (Fig. 3).
It is also worth noting that the previously mentioned (and only) relative advantage exhibited by the US as regards mortality from ill-defined processes compared to France and, to a smaller extent, to Italy, is particularly marked at ages below 65 years. The prevalence of deaths from ill-defined causes reflects differing certification practices across countries and variations in the understanding of when it is legitimate to attribute death to an ill-defined cause. Such differences could bias our results since, in practice, selecting an ill-defined cause increases the chance that a death is taken out of the pool of single or multi-morbidity processes. We further discuss the potential impact of these variations on our findings in the limitation section of this article.Table 3. Excess deaths, total number of person-years lost to excess mortality, and average number of years of life lost per excess deaths by sex and morbid process in the United States assuming survival rates of France, Italy, and Spain, 2017Mortality indicatorFranceItalySpainMalesFemalesBoth sexesMalesFemalesBoth sexesMalesFemalesBoth sexesExcess US deaths from- Simple processes102 092204 891314 518145 555162 804311 888 − 1 86499 773100 713- Multi-morbid processes235 469230 755473 918147 99693 359247 943291 307237 366531 708- Ill-defined processes − 84 861 − 61 332 − 145 477 − 71210 7679 8701 05622 89423 849- All processes252 701374 314642 958292 839266 929569 701290 499360 033656 270Total years of life lost to all excess deaths from- Simple processes2 856 3683 749 9576 643 2184 251 1913 706 5348 016 7081 851 8492 999 7114 774 847- Multi-morbid processes5 403 3834 540 23510 100 0785 310 6493 678 0289 130 8617 216 9695 502 29212 888 816- Ill-defined processes − 1 515 750 − 728 042 − 2 297 250 − 66 679185 336102 745 − 89 611224 029116 270- All processes6 744 0017 562 14914 446 0469 495 1627 569 89717 250 3148 979 2078 726 03117 779 933Average years of life lost per excess death from**- Simple processes28.018.321.129.222.825.7NA30.147.4- Multi-morbid processes22.919.721.335.939.436.824.823.224.2- Ill-defined processesNANANANA17.210.4NA9.84.9- All processes26.720.222.532.428.430.330.924.227.1^^ "NA" values are indicated where the United States had no excess deaths compared to peerSource: Authors’ calculations using cause-of-death data from national vital statistics systems of France (CepiDc-INSERM), Italy (ISTAT), Spain (INE), and the United States (NCHS), and population data from the Human Mortality Database (HMD, 2022)
Life expectancy at birth
Life expectancy at birth in 2017 was 78.7 years for both sexes combined in the US (76.2 years for men and 81.2 years for women), thus much lower than in the other three countries (82.4 in France, 82.7 years in Italy, and 83.0 years in Spain for both sexes combined) (Table 1). This means that the US is only now reaching the level of life expectancy at birth already attained by its peers around the turn of the century. The gap in life expectancy at birth with the US reached 3.7 years (compared with France), 4.0 (with Italy) and 4.3 (with Spain) years for both sexes combined, 3.2, 4.2, and 4.1 years for men, and 4.1, 3.6, and 4.5 years for women, respectively.
Overall, multi-morbid processes contributed 51% to the US gap in life expectancy with Italy, 75% with France, and 73% with Spain while simple morbid processes contributed 48, 42, and 26% for both sexes combined for each of the three comparison countries. The contribution of multi-morbid processes tends to be larger for men than for women (Appendix Tables 8 and 9). Our analysis indicates that if the mortality rates from multi-morbid processes had been the same in the US as in the comparison countries, the US would have experienced a smaller gap with other countries. The gap in life expectancy at birth would have been reduced by 2.4 years compared with Italy, 2.9 years with France, and 3.4 years with Spain for men. For women, the gaps would have been reduced slightly less, i.e., by 1.7, 2.7, and 2.8 years, respectively (Fig. 4).Fig. 4. Contribution (in years) of the three morbid processes to the difference in life expectancy at birth between the US and peer countries, each sex.Source: Authors’ calculations using cause-of-death data from national vital statistics systems of France (CepiDc-INSERM), Italy (ISTAT), Spain (INE), and the United States (NCHS), and population data from the Human Mortality Database (HMD, 2022)
The mortality burden of multi-morbid processes varies across the age range. Below age 20 years, the loss in life expectancy in the US from any kind of morbid processes is small, i.e., 0.3 to 0.4 years overall depending on the comparison country and sex, and nearly all of it is attributable to simple processes. This is related to the fact that, though mortality at younger ages, and especially during the first year of life, is more than twice as high in the US than in the comparison countries for simple morbid events, the gap is much smaller for mortality from multi-morbid processes.
The deficit in years lived is disproportionately large in the US for working-age adults compared with peer countries. The loss of years of life at ages 20 to 64 years reaches 1.8 years compared with France (1.9 years for men, 1.6 years for women), 2.5 years compared with Spain (2.9 and 2.1 years for men and women, respectively), and 2.6 years compared with Italy (3.1 and 2.1 years), representing 60 to 75% of the total loss in life expectancy for men and 40 to 55% for women. In this age group, most of the loss is attributable to multi-morbid processes, especially for men for whom this type of processes contributes for 63% in Italy, 77% in Spain and 88% in France. For women, the corresponding proportions reach 59, 66 and 71%, respectively (Appendix Tables 8 and 9).
Between the ages of 65 and 80 years, the US disadvantage is smaller than at younger ages but multi-morbid processes continue to play an overwhelming role in the loss of life years. For men, the US loss attributable to multi-morbid processes reaches 0.8 years compared with France and Spain and 0.5 years with Italy. By contrast, the loss attributable to simple processes is only 0.1 compared with France and 0.3 years with Spain. However, the US actually experiences an advantage compared with Italy, where mortality is higher for simple processes, with the US gaining 0.2 years of life from this type of morbid processes at these higher ages. For women, the US is at a disadvantage compared with all three peer countries and the loss of life is larger for both types of processes: for multi-morbid processes, the loss ranges from 0.6 years compared with Italy to a whole year compared with Spain; for simple processes, it reaches half a year with all three peers.
At age 80 years and above, as previously mentioned, the US disadvantage becomes much smaller with a life expectancy at age 80 years at 8.5 years for men and 9.8 years for women compared with 8.3 and 10.1 years in Italy, 8.6 and 10.5 years in Spain, and 8.9 and 11.0 years in France. The contribution of simple versus multi-morbid processes is much less consistent across countries than at younger ages. Compared with France, both simple and multi-morbid processes are disadvantageous to the US life expectancy for both men and women, though higher mortality from ill-defined processes partly compensates for the loss in years of life incurred by the other types of processes. In Italy, mortality from simple processes results in a very small loss in the US but it is largely compensated by the contribution of multi-morbid processes, explaining the longer life expectancy at age 80 years in the US. In Spain, we observe the reverse pattern, where the US experiences losses in years of life from multi-morbid processes but (minuscule) gains from simple processes.
Excess deaths and lost years of life
Between one fifth and one quarter of all deaths would have been averted in the US if the country had experienced the 2017 mortality rates of Italy (20%), France (23%), or Spain (23%) (Table 3). In France and Spain, a very large proportion of these averted deaths would have been the result of multi-morbid processes. The share of deaths from multi-morbid process in the US was 49% for men and 44% for women, compared with 49% and 52% for deaths from simple processes. Excess US deaths from multi-morbid processes represented, respectively, 17 and 19% of the total number of deaths in the US compared with 11 and 4% for those resulting from simple morbid processes. The total number of deaths averted from simple and multi-morbid processes for the two sexes combined would have represented, respectively, 11 and 9% of all US deaths with the mortality rates of Italy, 11 and 17% with those of France, and 4 and 19% with those of Spain. Americans whose deaths would have been averted if they had experienced the mortality risks of their more advantaged peers could have been expected to live for an additional 23 years with the lifetable values of France (27 years for men and 20 years for women), 27 years with those of Spain (31 years for men and 24 years for women), and 30 years with those of Italy (32 years for men and 28 years for women). These large values reflect the fact that excess US deaths tend to be concentrated at relatively young adult ages, when the potential for additional years of life is high.
Study limitations
We cannot rule out the fact that differences in certifying practices across the four study countries could influence some of the results. An important issue is the previously mentioned high share of deaths coded to ill-defined or unknown causes in France compared to the US, which could mask higher rates of mortality from simple and multi-morbid processes. To evaluate the impact of the differential rate of ill-defined causes on the cross-country comparison, we experimented with different scenarios for the redistributions of deaths from ill-defined and unknown causes for all four countries. We found that all these strategies made no material differences to the results of our analysis because the lower rate of mortality from ill-defined deaths in the US compared to France and Italy is far from sufficient to compensate for its higher rates from simple and multi-morbid processes.
Similarly, we noticed that in Spain, deaths requiring forensic investigations, which are in large part those due to accidents and are relatively more frequent at young ages, are automatically assigned a single cause of death.3 This practice could have resulted in the lower proportion of multi-morbid processes than in the other countries and, consequently, in the much higher ratio of age-specific death rates from this type of processes in the US compared to Spain. Nonetheless, it remains that even in France and Italy, where there is no such practice, the disadvantageous pattern observed in the US as regards multi-morbidity is very similar than in Spain, though more muted for young working-age adults than is found in this latter country.
Unfortunately, we lack additional information to assess the comparability of the multiple cause-of-death data across the four study countries, such as the autopsy rate, the share of certificates that have been filed electronically, or the percentage of deaths for which information on the medical cause of death was provided by a non-physician. Our findings must thus be taken with a grain of salt. However, the plausibility of our results considering the literature on the US disadvantage in health and mortality and the high degree of consistency in the pattern of differences between the US and each of the three peer countries give us reasonable confidence that our overall results are largely grounded on reality.
Discussion
Our results indicate that multi-morbid processes contribute overwhelmingly to the large gap in life expectancy between the US and the three comparison countries, France, Italy, and Spain, for both men and women (though slightly muted for the latter relative to the former). They also show that the disadvantage in the mortality rates from multi-morbid processes operates throughout most of the age range, though it is particularly concentrated among working-age adults. The pattern is very similar across all countries below the age of 85 years, above which the US experience a lower level of mortality from multi-morbid processes compared with Italy only. Within the most disadvantaged age range (20 to 64 years), the gap in mortality rates is largest at 25-29 years while the contribution of multi-morbid processes increases progressively and reaches a peak at ages 55 to 64 years when the share of multi-morbidity to the difference in life expectancy at birth between the US and peers is most pronounced. These results are consistent with the literature, which shows that the US disadvantage in mortality is exceptionally large for working age adults in general, and for young adults in particular (Harris et al., 2021; Ho, 2013; Ho & Preston, 2010). The difference in age pattern in the contributions to life expectancy and in the ratio of the mortality rates is due to the fact that large variations in small rates contribute less to gaps in life expectancy at birth than small variations in large rates. The result remains that all age groups between 20 and 85 years contribute significantly to the US disadvantage in the length of life for men: for young working-age adults this is because the relative differences in rates are large and also because a death averted at young ages results in more years of life expectancy gained than a death averted at older ages, while for older adults, the contribution is due to large absolute differences in the rates.
Because each disease comes with its own risk factors, the disproportionate prevalence of multi-morbidity at death in the US compared with peer countries suggests that no single factor is likely to explain the difference and a broad range of determinants is probably at play in the country excess mortality and lag in life expectancy. An in-depth analysis by the National Research Council conducted in the early 2010s explained the US shortfall in life expectancy as multi-factorial: differences in health systems, individual behaviors, the distribution and impact of education and income on mortality, economic inequalities, the environment, and policies or the lack thereof, in particular as regards social welfare and income redistribution programs, as well as social values and norms all appear to contribute (National Research Council, 2013). Particularly relevant for our findings, this study and other more recent ones have shown that all these determinants operate through proximate factors like higher rates of obesity, hypertension, diabetes, and substance abuse, often identified on death certificates as associated or contributing causes of death (Woolf, 2023). These conditions are best controlled through prevention but a report by the National Academies of Sciences, Engineering, and Medicine found that the primary care system is failing in the US (2021). A recent publication by the Commonwealth Fund which included a range of high-income countries notes that the US ranks last on nearly all indicators of health care system performance (Schneider et al., 2021). According to this study, what more specifically appears to distinguish the top-achieving countries from the US is that "1) they provide for universal coverage and remove cost barriers; 2) they invest in primary care systems to ensure that high-value services are equitably available in all communities to all people; 3) they reduce administrative burdens that divert time, efforts, and spending from health improvement efforts; and 4) they invest in social services, especially for children and working-age adults" (Schneider et al., 2021, p. 2). It is thus unlikely that a unique intervention, program, or policy will be sufficient to close the gap between the US and its peers. In the meantime, the disproportionate burden of multi-morbidity in the US will continue to complicate efforts to sustain progress in life expectancy in this country and to improve health and the quality of life of the general population, and it is very likely to put additional pressure on the already extraordinary cost of health care compared to peers (Papanicolas, Woskie, Jha, 2018).
Indeed, the simultaneous presence of at least two independent diseases or conditions in a single individual creates multiple challenges for the health care system. Fortin and colleagues emphasize how “multi-morbidity affects processes of care and may result in complex self-care needs; challenging organizational problems (accessibility, coordination, consultation time); polypharmacy; increased use of emergency facilities; difficulty in applying guidelines; and fragmented, costly, and ineffective care”, thus leading to “decreased quality of life, psychological distress, longer hospital stays, more postoperative complications, and a higher cost of care” (Fortin et al., 2007, p.1016). More recent studies have confirmed that multi-morbidity is associated with increased mortality risks, disability, reduced functional status, poor quality of life, complicated treatment options, and adverse drug events due to incompatibilities, calling for coordinated and comprehensive care (Brettschneider et al., 2013; Calderon-Larranaga et al., 2012; Chowdhury et al., 2023; Forman et al., 2018; Wolff et al., 2005). Multi-morbidity is associated with more health care use and longer hospitalizations (Ofosi-Asenso et al., 2019). Multi-morbidity also poses particular challenges to the health care system which, in most countries, is still designed to manage a single disease with a highly segmented system of care (Barnett et al., 2012; DuGoff et al., 2014; Marengoni et al., 2011; Wallace et al., 2015).
Our study has confirmed that an approach based on the multiple cause-of-death information available on death certificates is a very valuable complement to the analysis of multi-morbidity in living populations, especially for international comparisons. The approach we followed overcomes many of the shortcomings from observational studies or from survey data because it relies on routinely collected vital statistics based on a standard data collection instrument (the WHO recommended death certificate with all causes of death coded to the International Classification of Diseases) and unified definitions. It therefore provides widespread, systematic, low cost, and highly comparable information on multi-morbidity at death. In addition to international comparisons, this approach is easily amenable to additional studies of changes in the prevalence of multi-morbidity at death over time or within-population variations by geographic location, race/ethnicity, or social group. Death certificates are not a substitute to survey data because the type of multi-morbidity reported does not neatly overlap with the multi-morbidity measured with survey data or in observational studies: certifiers are indeed only expected to report those causes that might have contributed either directly or indirectly to the death while, in living populations, multi-morbidity is typically defined as the co-occurrence of two or more chronic conditions, including some which can reduce quality of life but do not necessarily have life threatening consequences. Our approach should thus be considered as a useful complement, rather than as an alternative, to the measurement of multi-morbidity in living populations.
The reference list from the paper itself. Each links out to its DOI / PubMed record.
- 1Barbieri, M. (2021). COVID-19 and the growing disadvantage in US life expectancy. BMJ, 373.
- 2Boeckxstaens, P., & Petrovic, M. (2020). Multimorbidity: Definition, assessment, measurement and impact. In Encyclopedia of biomedical gerontology. 455–460. Elsevier.
- 3HMD–Human Mortality Database (2022). Max Planck institute for demographic research (Germany), University of California, Berkeley (USA), and French Institute for Demographic Studies (France). Retrieved December 6, 2022, from www.mortality.org
- 4HMD–Human Mortality Databaser (2002). Max Planck Institute for Demographic Research (Germany), University of California, Berkeley (USA), and French Institute for Demographic Studies (France). Retrieved December 19, 2022, from www.mortality.org
- 5World Health Organization (WHO). (2015). Cause of death on the death certificate in line with ICD. Quick reference guide. Retrieved February 20, 2024, from https://cdn.who.int/media/docs/default-source/classification/icd/cause-of-death/causeofdeathflyer_2015.pdf?sfvrsn=9ec 05f 86_1