Prediction of Immunotherapy Response and Prognostic Outcomes for Patients With Ovarian Cancer Using PANoptosis-Related Genes
Lei Zhang, Bo Yang, Huiting Xiao, Lu Sun, Wenting He, Ying Chen

TL;DR
This study builds a model using PANoptosis-related genes to predict ovarian cancer patient outcomes and immunotherapy response.
Contribution
A novel risk model using eight PANoptosis-related genes is developed to assess prognosis and immunotherapy response in ovarian cancer.
Findings
The model accurately predicts survival outcomes and immunotherapy response in ovarian cancer patients.
High-risk patients show lower immune cell infiltration and reduced immunotherapy responsiveness.
Key genes like PIK3CG show increased expression and are functionally linked to cancer progression in cell lines.
Abstract
Ovarian cancer (OC) is a lethal malignancy often diagnosed at a late stage with frequent recurrence and immunotherapy resistance. PANoptosis is a novel programmed cell death regulating tumors and immunity. We constructed a prognostic model based on PANoptosis-related genes (PRGs) and evaluated its value for predicting immunotherapy response and survival in OC. PRGs linked to OC prognosis were identified from public databases, followed by using the STRING database to develop a protein–protein interaction (PPI) network. The LASSO and multivariate Cox regression analyses were used to construct a risk model, and its predictive value was verified by survival analysis, receiver operator characteristic (ROC) curve, and nomogram. Next, we analyzed the immune microenvironment by combining CIBERSORT, MCP-counter, and ssGSEA algorithms and assessed the response of patients in different risk…
Genes, proteins, chemicals, diseases, species, mutations and cell lines named across the full text — each resolved to its canonical identifier and authoritative record.
Click any figure to enlarge with its caption.
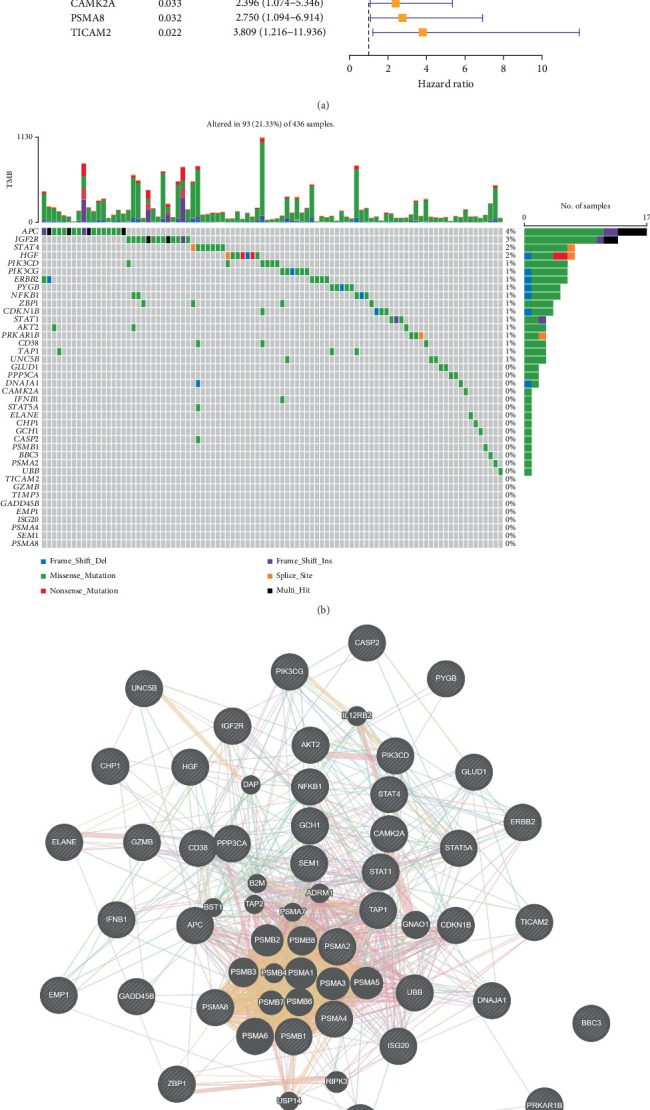 Figure 1
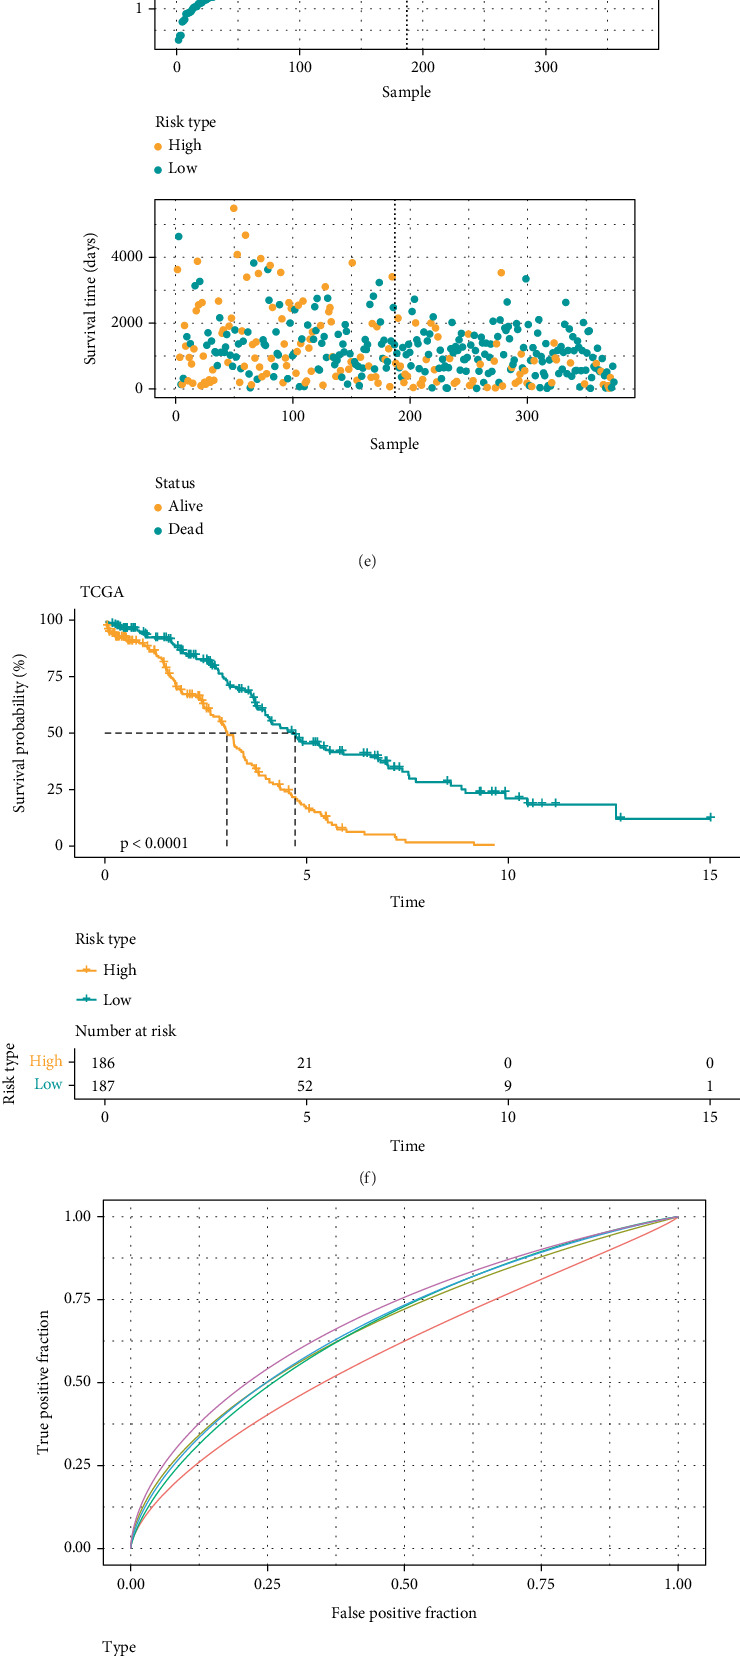 Figure 2
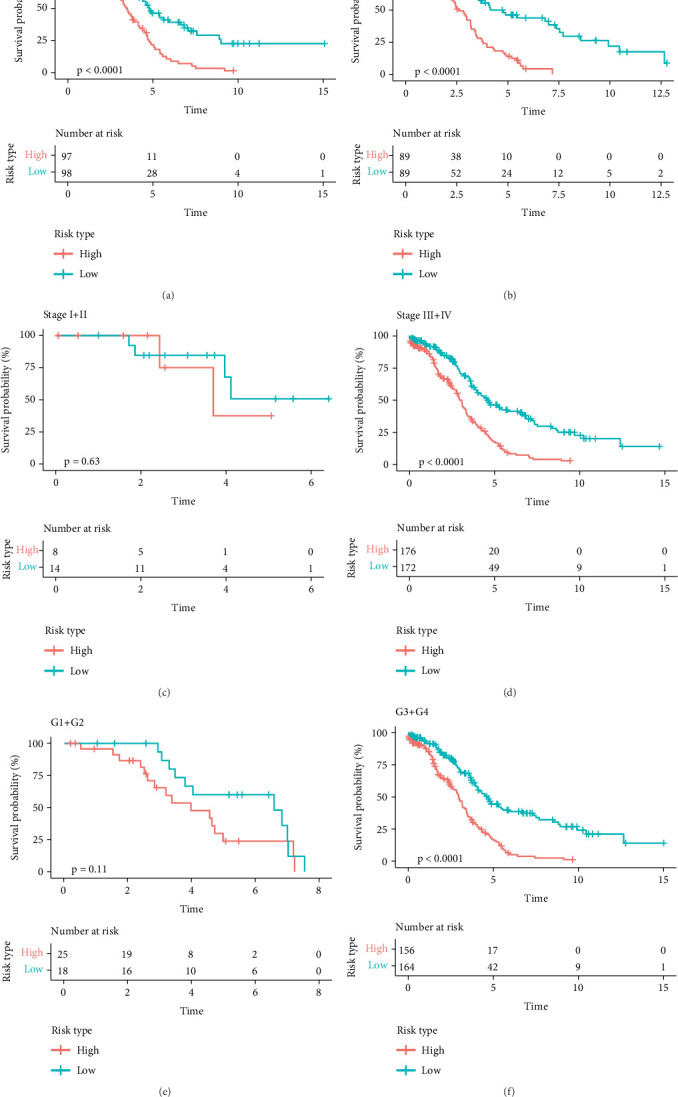 Figure 3
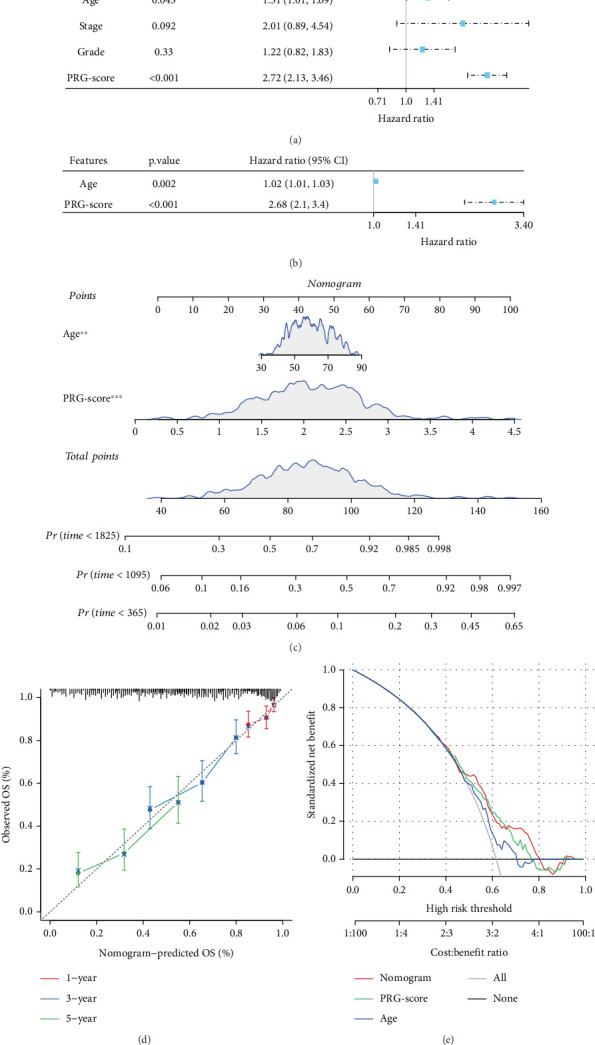 Figure 4
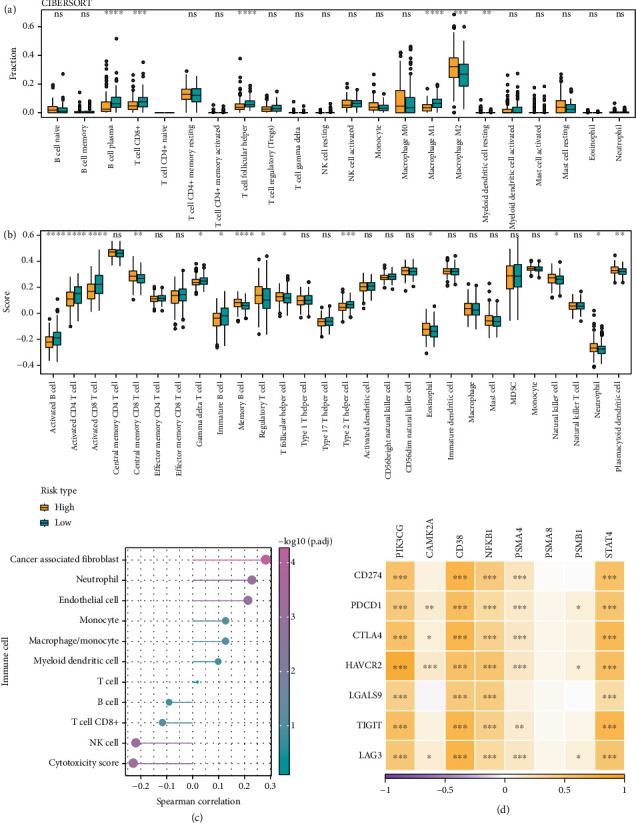 Figure 5
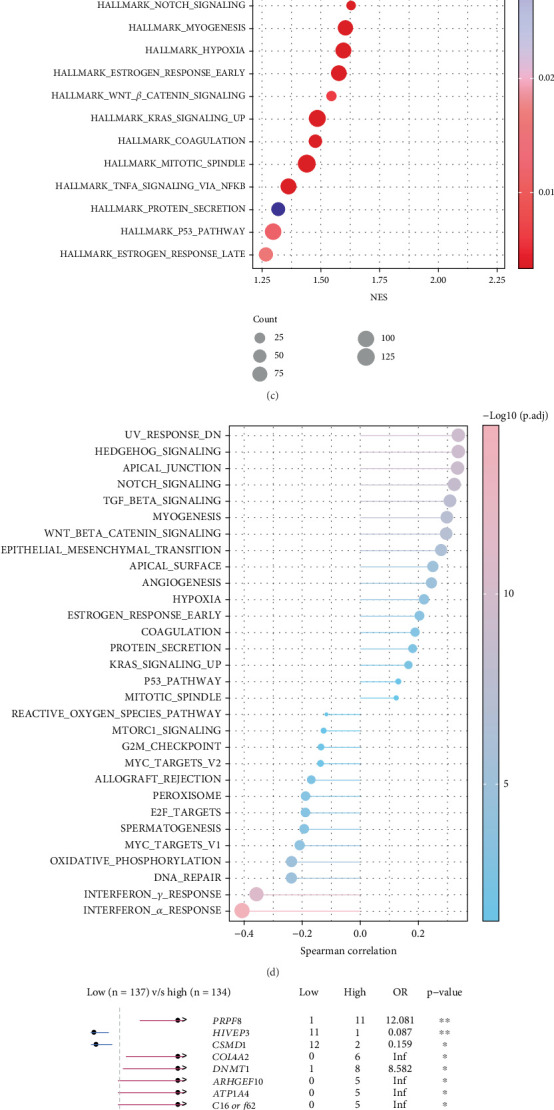 Figure 6
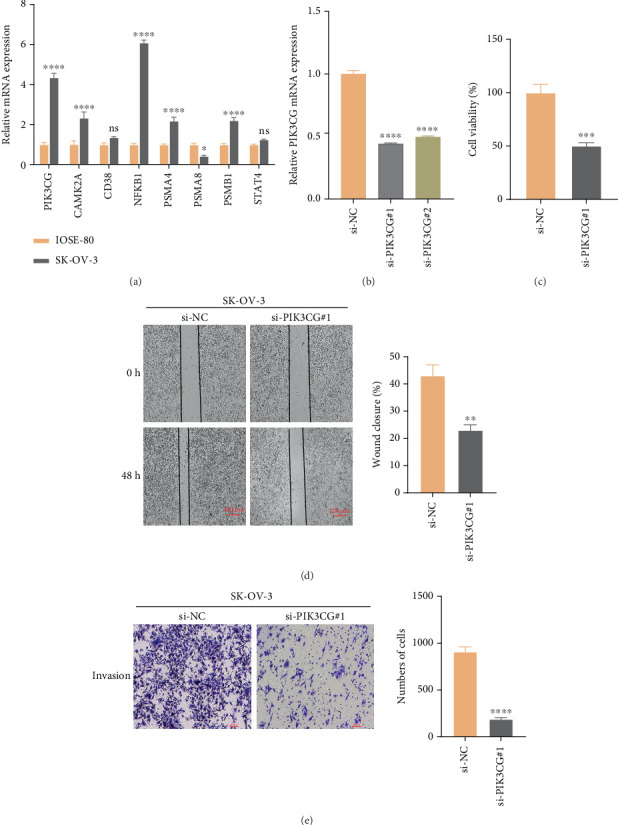 Figure 7
- —Tianjin Key Medical Discipline Construction Project
- —Research on AI-Based Auxiliary Diagnosis System for Endometrial Cancer
Peer Reviews
No public reviews on file for this paper yet. If you reviewed it on a platform where reviews are public (OpenReview, ICLR, NeurIPS, ICML), you can paste yours below so the community can read it here.
Videos
No videos yet. Explain this paper in a talk, walkthrough, or lecture? Add one.
Taxonomy
TopicsMicroRNA in disease regulation · Circular RNAs in diseases · RNA modifications and cancer
1. Introduction
Ovarian cancer (OC) is the third most frequent and lethal malignancy of the female reproductive system [1, 2]. Due to nonspecific symptoms, approximately 70% of OC patients are diagnosed with metastases, leading to a dismal 5-year overall survival (OS) rate of only 30% [3]. High-grade serous OC, which represents 70% of all epithelial OC cases, is recognized as the most prevalent and deadly subtype [4]. A significant challenge is that numerous patients with high-grade serous OC are detected at advanced stages, primarily due to the nonspecific symptoms of OC [5]. Optimal debulking surgery and platinum-based chemotherapy are currently the standard treatment for OC. However, up to 70% of patients eventually relapse [5]. Unlike other cancers, OC survival rates have seen minimal improvement in recent decades [6], which underscores an urgent need to explore alternative therapies to improve the outcome of OC.
Previous research focuses on the particular regulation of necroptosis, apoptosis, and pyroptosis in OC. Subsequent studies revealed extensive interactions between different cell death forms [7–9]. In 2019, Malireddi et al. [10] proposed the novel concept of “PANoptosis,” demonstrating that its activation requires coordinated involvement of pyroptosis, apoptosis, and necroptosis. PANoptosis exhibits unique biochemical characteristics. Research indicated a close correlation between PANoptosis and the onset of multiple systemic disorders, such as neurodegenerative, inflammatory, and infectious diseases [11]. Based on public databases, bioinformatics analysis screened various PANoptosis-related genes (PRGs) associated with the immunological responses of cancer patients, cancer bioprocesses, and OS. These genes were integrated to establish a PANoptosis signature to accurately evaluate the immunotherapy responsiveness and prognosis of pancreatic, gastric, prostate, and stomach cancers [9, 12–14]. It has been found that PANoptosis can improve antitumor immune responses and influence the efficacy of tumor immunotherapy [15]. Pan et al. [9] established a PAN score system in gastric cancer, where low PAN score patients showed higher immunotherapy response rates and better prognosis. However, the exact role of PANoptosis in OC remained unexplored.
Through computational analyses based on public databases, prognosis-related PRGs and predictive features related to PANoptosis for OC were discovered. We subsequently developed a PAN score to stratify patients into high- and low-risk groups based on the median risk score. The predictive utility of this model was further validated through a comprehensive assessment of prognostic differences across risk groups, including analyses of clinical parameters (e.g., grade, age, and stage), immune microenvironment characteristics, biochemical pathways, and somatic mutations. Collectively, our study established a novel PANoptosis-related risk model to predict the prognosis and immune checkpoint inhibitor (ICI) treatment response for patients with OC, providing novel insights and understanding for the clinical management of OC.
2. Methods
2.1. Data Acquisition
The gene expression profiles and clinical data for the OC patients were sourced from GEO (https://www.ncbi.nlm.nih.gov/geo/) and TCGA (https://portal.gdc.cancer.gov/) databases. TCGA-OC FPKM values were log2-transformed and converted to transcripts per kilobase million (TPM). A total of 373 samples in TCGA-OC cohort (training cohort) and 260 OC samples in the GSE32062 dataset (validation cohort) with full survival data were included. In addition, we downloaded the gene sets of five related pathways from the MSigDB database (https://www.gsea-msigdb.org/gsea/msigdb/index.jsp), including map 04217 (KEGG_NECROPTOSIS), KEGG_APOPTOSIS, REACTOME_PYROPTOSIS, REACTOME_APOPTOSIS, and HALLMARK_APOPTOSIS, and defined their combined gene set as the PANoptosis gene set.
2.2. Characterization and Interaction Analysis of PANoptosis Genes in OC
First, the OC somatic mutation data acquired from TCGA database were analyzed by the R package “maftools” to characterize the mutation patterns of PANoptosis genes in OC. Next, functional associations were explored through GeneMANIA (http://www.genemania.org), which integrated comprehensive genomic and proteomic data to identify functionally similar genes and predict their roles [16]. Furthermore, we built a protein–protein interaction (PPI) network based on the functionally similar genes using the STRING database (https://cn.string-db.org/) with a confidence score threshold of 0.7. The network was visualized using Cytoscape (v3.8.0) for further topological analysis [17].
2.3. Development of a Risk Model and Validation
PANoptosis genes closely linked to the prognosis of OC were filtered by univariate Cox regression analysis, followed by LASSO Cox regression using the R package “glmnet” [18, 19] to reduce gene number and prevent overfitting [20]. Stepwise regression analysis determined key genes for developing a PANoptosis-related gene score (PRG score), which was computed as follows: PRG score = Σβi × Expi. The PRG score of each patient in the training and validation cohorts was calculated, based on which the high-risk group (zscore > 0) and low-risk group (zscore < 0) were classified. After standardizing the risk scores to zscore, survival analyses for the two risk groups were conducted utilizing the R software package “survminer” [21]. We performed time-dependent receiver operator characteristic (ROC) analysis to assess 1-, 3-, and 5-year area under ROC curve (AUC) values through the “timeROC” package [22].
2.4. Correlation Between Immune Checkpoint Genes and PRGs
The relationship between the immune checkpoint–associated genes and eight PRGs screened by above analysis was analyzed using the “GGPUBR,” “ggplot2,” and “ggExtra” R packages [23], with statistical significance set at p < 0.05.
2.5. Analysis of Immune Microenvironment and Immunotherapy
The immune microenvironment of OC tissues was comprehensively evaluated applying multiple computational methods. CIBERSORT and MCP-counter algorithms were used to quantify the infiltration of diverse immune cell types [24]. The immune activity of each sample was further assessed using ssGSEA [25]. To predict immunotherapy response, we employed the tumor immune dysfunction and exclusion (TIDE) algorithm to evaluate T cell dysfunction and exclusion based on gene expression profiles, with higher TIDE scores indicating lower responses to immune checkpoint inhibitors (ICIs) [26]. Additionally, the immune phenotype score (IPS) was calculated using TCIA data to estimate potential responses to PD-1 and CTLA-4 blockade therapies [27, 28].
2.6. Pathway Analysis
We performed pathway analysis of the HALLMARK pathway gene sets acquired from the MSigDB database (https://www.gsea-msigdb.org/gsea/msigdb/) using the GSEA method [25]. HALLMARK enrichment scores calculated by ssGSEA were used to compare pathway activity among different groups.
2.7. Culture of Cells and Temporary Transfection
Human normal ovarian cell line IOSE-80 (YS2273C, RRID: CVCL_5546) was purchased from Yaji Bio (Shanghai, China), and OC cell line SK-OV-3 (BNCC310551, RRID: CVCL_0532) was purchased from BeNa Culture Collection (Xinyang, China). The cells were cultured in Roswell Park Memorial Institute (RPMI) 1640 medium (11875093, Gibco, Waltham, MA, United States of America) supplemented with 10% fetal bovine serum (FBS, 10099141, Gibco, United States of America), 100 μg/mL streptomycin, and 100 μg/mL penicillin G (15140122, Gibco, United States of America). All these cells were cultured in an incubator at 37°C and 5% CO_2_. Following the instructions, the transfection of si-PIK3CG into the cells was conducted applying Lipofectamine 3000 transfection reagent (L3000-001, Thermo Fisher Scientific, Waltham, MA, United States of America). The sequence of si-PIK3CG is as follows: si-PIK3CG#1: 5′-GGCTAGATTATCTGAAACTGTTG-3′ and si-PIK3CG#2: 5′-TCGGTTCTTGAGATGATACTACC-3′. After cell transfection, quantitative reverse transcription–polymerase chain reaction (qRT-PCR) was conducted validate the knockdown efficiency of PIK3CG at the mRNA level.
2.8. qRT-PCR
According to the instruction, total RNA was extracted from IOSE-80 and SK-OV-3 cells employing RNAiso Plus reagent (9108Q, Takara Bio, Shiga, Japan). The PrimeScript RT reagent Kit (RR037Q, Takara Bio, Japan) was used to synthesize the relevant cDNA [29]. Quantitative real-time PCR was performed using ChamQ SYBR qPCR Master Mix (Q711-02, Vazyme, Nanjing, China), with GAPDH as the internal control. Each reaction was carried out in triplicate, and gene expressions were calculated using the 2^−ΔΔCt^ method. See Table 1 for primer sequences used for qPCR.
2.9. Cell Counting Kit 8 (CCK-8) Determination
SK-OV-3 cells in the logarithmic growth phase were harvested and seeded into 96-well plates at a density of 3 × 10^4^ cells/mL (100 μL/well, approximately 3000 cells per well). After incubation at 37°C with 5% CO_2_ for 48 h, 10 μL of CCK-8 solution (CK04, Dojindo, Kumamoto, Japan) was added to each well (medium: CCK‐8 = 10 : 1), followed by incubation for 3 h. The absorbance was measured at 490 nm using a microplate reader to assess the cell viability [30].
2.10. Wound Healing Test
Assessment of collective cell movement in wound healing experiments was conducted using a six-well plate. Briefly, cells in the logarithmic growth phase were digested, resuspended in cell suspension, and then seeded into the six-well plate at a density of about 5 × 10^5^ cells/well. Once the cell density exceeded 90%, artificial wounds were created using a sterile 100 μL pipette tip, and the healing of the “injured” monolayer was evaluated after 48 h.
2.11. Transwell Assay
Transwell chambers (8 μm pore size; Corning, Inc., Corning, NY, United States of America) were used to assess the migration of SK-OV-3 cells. 36 hours post transfection, 200 μL of SK-OV-3 cells (2 × 10^4^ cells/mL) in serum-free medium were seeded into the upper chamber, while 700 μL of medium containing 10% FBS was added to the lower chamber. Nonmigrated cells were removed after incubation for 48 h at 37°C, while migrated cells were fixed by 4% paraformaldehyde and colored with 0.1% crystal violet. Cells were photographed under a microscope from six random fields and quantified by ImageJ software [31].
2.12. Statistical Analyses
Analysis and visualization of all statistical data were realized using R (Version 3.6.0) and GraphPad Prism (version 10.0.4). Wilcoxon's rank-sum test was used to compare the difference between continuous variables in two groups, and Spearman's method was used to assess the correlation. Log-rank test was utilized to compare survival differences between the two risk groups. For the experimental data, the one-way/two-way analysis of variance and unpaired t test was applied. A p < 0.05 was established as the threshold of statistical significance.
3. Result
3.1. Mutations and Interactions of Prognosis-Related PANoptosis Genes in OC
A total of 486 genes related to OC prognosis were extracted from TCGA database. Univariate Cox regression analysis screened 40 genes associated with PANoptosis (Figure 1). The somatic mutation incidence of these genes in TCGA-OC samples was analyzed and visualized using the “maftools” package. Our analysis revealed generally low mutation frequencies among the examined genes, with detectable mutations only observed in APC (4%), IGF2R (3%), STAT4 (2%), HGF (2%), PIK3CD (1%), PIK3CG (1%), and ERBB2 (1%) (Figure 1). Subsequently, the GeneMANIA website was used to identify functionally similar genes and construct an interaction network for these genes. It was found that these genes were mostly associated with the proteasome core complex and related biological activities, including the presentation of antigen processing (Figure 1). By setting the minimum required interaction score to 0.7, further analysis using the STRING database identified 22 genes (including CD38, PSMA8, PSMA4, PSMA2, PSMB1, NFKB1, STAT4, ERBB2, and PIK3CG) that were involved in the crosstalk of pyroptosis, necroptosis, and apoptosis (Figure 1).
3.2. Establishment of PANoptosis-Related Prognostic Features and Validation
We selected characterized genes with stable prognostic value (optimal λ value = 0.0341) from 22 candidate PRGs based on LASSO regression and cross-validation (Figure 2a,b). The final risk model contained eight key genes, namely, PIK3CG, CAMK2A, CD38, NFKB1, PSMA4, PSMA8, PSMB1, and STAT4 (Figure 2c,d). Subsequently, using the formula of PRG score = (0.573∗PIK3CG + 1.402∗CAMK2A − 0.464∗CD38 + 0.171∗NFKB1 − 0.288∗PSMA4 + 0.739∗PSMA8 + 0.436∗PSMB1 − 0.428∗STAT4), each OC patient in TCGA cohort was assigned with a risk score. Next, high- and low-risk groups were stratified by median PRG score. Notably, high-risk OC patients had shorter OS than those characterized as having a low risk (Figure 2e). Consistently, survival curve analysis showed that in comparison to patients in the high-risk group, the low-risk group had a considerably higher OS (p < 0.0001, Figure 2f). The PRG risk model demonstrated a high accuracy in the prognostic assessment of OC, reaching an AUC of 0.59, 0.67, 0.66, 0.67, and 0.69 for 1-, 2-, 3-, 4-, and 5-year survival prediction, respectively (Figure 2g). Subsequently, validation in the GSE32062 dataset yielded consistent results, with low-risk patients showing better outcomes (Figure 2h,i), reaching an AUC of 0.70, 0.69, 0.60, 0.56, and 0.60 for 1-, 2-, 3-, 4-, and 5-year survival prediction, respectively (Figure 2j).
3.3. Association Between the Prognostic and Clinical Features
We evaluated the association between clinical characteristics (age, stage, and grade) and risk score and found a substantial correlation between age and risk score. Specifically, older patients (> 59 years) in the high-risk group demonstrated worse prognosis compared to younger patients (≤ 59 years) (Figure 3). High-risk patients with advanced clinical stages (Stages III + IV, p < 0.0001) or clinical grades (Grades G3 + G4, p < 0.0001) showed poorer OS than those in the low-risk group (Figure 3). This suggested that our risk groupings were strongly independent and less susceptible to the interference from other clinical factors.
3.4. Establishment of a Clinical Nomogram for Survival Prediction in OC
Univariate analysis revealed that age and PRG score were significant predictors (Figure 4a). Multivariate analysis further confirmed the significance of the two independent predictors in OC (Figure 4b). We created a nomogram (Figure 4c) integrating age and PRG score to assess the 1-, 3-, and 5-year OS for OC patients. The nomogram showed a high agreement between the predicted and actual 1-, 3-, and 5-year OS (Figure 4d). Furthermore, decision curve analysis (DCA) results further validated the superior predictive performance of the nomograms and PRG score when compared to other clinicopathologic features (Figure 4e).
3.5. Comparison of Tumor Microenvironment (TME) Differences Between Risk Subgroups
We assessed immune cell infiltration in the risk subgroups in TCGA cohort to characterize and compare their immune microenvironment. According to CIBERSORT analysis, the low-risk group showed higher infiltration of T cell follicular helper, M1 macrophages, plasma B cells, and CD8^+^ T cells. The high-risk group exhibited markedly higher infiltration of M2 macrophages, indicating that these OC patients might have an immunosuppressive TME (Figure 5a). The result of ssGSEA demonstrated increased infiltration of neutrophil, eosinophil, and regulatory T cell in the high-risk group (Figure 5b). The PRG score was positively linked to cancer-associated fibroblast, neutrophil, and endothelial cell but negatively linked to cytotoxicity score, NK cells, and CD8^+^ T cells. Also, the correlation between the PRG score and MCP-counter immunity score was explored (Figure 5c). Notably, PIK3CG, CD38, NFKB1, and STAT4 were the model genes that showed a positive correlation with immune checkpoint genes (Figure 5d). These data suggested that the low-risk OC group had lower infiltration of immune cells and higher immunoreactivity in their TME.
3.6. Characterization of Genomic Changes and Enrichment Pathways in the PANoptosis Model
The TIDE result demonstrated notably higher TIDE scores in patients in the high-risk group (p < 0.05), indicating greater immune escape potential and lower treatment efficacy in this group (Figure 6a). The low-risk group responded more actively to PD-1 and CTLA-4 blockers, as evidenced by their higher IPS scores (p = 3.6e − 10, Figure 6b). This indicated that the low-risk group may benefit more from immunotherapy. GSEA showed that pathways associated with disease aggressiveness and progression, including “HALLMARK_ANGIOGENESIS,” “HALLMARK_HEDGEHOG_SIGNALING,” and “HALLMARK_EMT,” were significantly activated in the high-risk group (Figure 6c). Further analysis of the Spearman correlation between PRG score and HALLMARK pathway revealed that PRG score was inversely linked to the immune-related pathways (INTERFERON_ALPHA_RESPONSE, INTERFERON_GAMMA_RESPONSE) but was positively linked to several pathways (UV_RESPONSE_DN and HEDGEHOG_SIGNALING) (Figure 6d). Somatic mutation analysis detected a higher PRPF8 mutation rate in the high-risk group (Figure 6e). Collectively, high-risk OC patients may have lower immunoreactivity in their TME and a higher possibility of immune escape during immunotherapy.
3.7. Expression and Functional Validation of Key Genes Screened
The results of qPCR showed that PIK3CG, CAMK2A, NFKB1, PSMA4, and PSMB1 were significantly highly expressed in SK-OV-3 cells (Figure 7). Considering that the role of PIK3CG in the progression of OC remained unclear, this gene was further explored. First, the qRT-PCR confirmed effective knockdown of PIK3CG by two siRNAs, with si-PIK3CG#1 showing a higher inhibition efficiency (Figure 7). Hence, si-PIK3CG#1 was used for subsequent functional experiments. The results from CCK-8 (Figure 7), scratch assay (Figure 7), and transwell assay (Figure 7) showed that PIK3CG knockdown (si-PIK3CG#1) markedly inhibited the viability, migration, and invasion of SK-OV-3 cells. These results demonstrated that the lowly expressed PIK3CG played a crucial role in repressing the proliferation, migratory, and invasive capabilities of OC cells.
4. Discussion
OC is one of the most lethal gynecological malignancies [5, 32], showing an urgent need for novel prognostic biomarkers and treatment targets. PANoptosis, which arises from the interplay between pyroptosis, apoptosis, and necrotic apoptosis, is a newly identified cell death form essential for controlling the advancement of tumors [33, 34]. This study established an eight-gene PANoptosis-based risk model (PRG score) integrating PIK3CG, CAMK2A, CD38, NFKB1, PSMA4, PSMA8, PSMB1, and STAT to help effectively predict the prognosis of OC patients. Notably, the PRG score showed high stability in both TCGA and GEO datasets. It was found that OC patients in the high-risk group had lower immune cell infiltration and poorer immunotherapy responsiveness, suggesting that PANoptosis characteristics were closely related to the tumor immune microenvironment. Additionally, in vitro experiments verified the expression of the screened genes and the proinvasive and proproliferative potential of PIK3CG in OC. This study was the first to systematically reveal the potential value of PANoptosis in OC prognosis and immunotherapy.
Previous studies reported a close relationship between these eight genes and tumor initiation, progression, and therapy. In particular, PIK3CG activation is intimately linked to tumor cell proliferation in non–small cell lung cancer, and its mutation may result in drug resistance [35]. Among the eight identified genes, PIK3CG showed a particularly high expression in OC cells. We also discovered that PIK3CG can notably enhance the migration, invasion, and proliferation of SK-OV-3 cells. CAMK2A, with low expression, is linked to a favorable prognosis in gliomas, but it also paradoxically correlates with reduced efficacy of immunotherapy [36]. Both hematopoietic and nonhematopoietic cells have high levels of the transmembrane glycoprotein CD38. CD38 has been found to improve the prognostic outcomes of OC patients through promoting immune infiltration and antitumor immunity in the TME [37, 38]. NFKB1, a key component of the NF-κB pathway, can be overexpressed and regulated by norepinephrine to promote the development of OC [39]. Numerous cancers are linked to the PSMA family genes, which influence cell proliferation, ubiquinone breakdown, oxidative damage, and immune response signaling. High-expressed PSMA family genes (e.g., PSMA2, PSMA3, PSMA4, PSMA6, and PSMA7) in breast cancer tissues are reported to be linked to a poor OS of the cancer, but higher levels of PSMA5 and PSMA8 are indicative of better clinical outcomes [40]. By promoting proteasome-dependent oncoprotein degradation, PSMB1 is regarded as a possible biomarker and a treatment target for colorectal cancer [41]. By generating signals from compounds, cytokines, growth factors, and their receptors, the STAT family proteins have been found to control tumor progression and treatment resistance [42]. These genes are therefore considered possible therapeutic targets that influence the metabolic reprogramming in cancers. The current model PRG score combines these genes, offering novel understanding of the mechanisms of OC and showing the potential to be used as a unique OC biomarker.
At present, the interaction between the immune environment and tumors has been widely studied as a result of the continuous breakthroughs in ICIs [43–45]. According to earlier research, PANoptosis affects the expression of immune checkpoint genes, the quantity of immune cells in the TME, and the response of these cells to immunotherapy [12, 46]. For instance, researchers discovered a strong correlation between immune cell abundance and PRG score. When colon tumors undergo PANoptosis, there is a notable increase in immunosuppressive cells (M2 macrophages) and a decrease in immune-activating cells (T cells and M1 macrophages) [12, 47]. Another study reported that in addition to effector T cells and other antitumor immune cells, the migration of Tregs is elevated in typical tumors with high PANoptosis [13]. It is commonly known that Treg cells release cytokines, prevent effector T cell growth, and facilitate immune escape in some malignancies [48]. This study evaluated the immunological infiltration landscape in OC. CIBERSORT analysis showed higher infiltration of macrophage M1, CD8^+^ T cells, plasma B cells, and T cell follicular helper in the TME of the low-risk patients. According to Raja et al. [49], OC patients with higher infiltration of CD8^+^ T cells, NK cells, and CD4^+^ T cells tend to have a better OS. The antitumor effect of a higher infiltration of M1 macrophages is consistent with our findings [50]. Interestingly, we also found that the high-risk group had higher M2 macrophage abundance, and that high M2 macrophage expression was significantly associated with immunosuppression.
In recent years, several studies constructed different types of immunotherapy prediction models for guiding the prediction of patients' responses to ICIs. For low-grade gliomas, Zou et al. created a risk score model based on glycosylation-related genes to assess patient survival; notably, their model was correlated with the immune profile, TIDE score, and treatment sensitivity, providing a new therapeutic target for gliomas [51]. In bladder cancer, Teng et al. constructed a risk score based on tumor-infiltrating immune cell (TIIC) characteristics by using multiple machine learning algorithms together with single-cell data to evaluate patients' responses to PD-L1 therapy and their prognosis [52]. In addition, in metastatic melanoma, a risk score model constructed by liquid biopsy detection of circulating soluble immune checkpoint molecules (e.g., sCTLA-4 and sCD74) has also demonstrated an accurate immune response prediction and is applicable to long-term responsive populations [53]. In contrast, this study was the first to focus on PANoptosis, a novel cell death mechanism. We constructed an eight-gene PRG score, which provided a stable and effective prognostic stratification of OC patients. The PRG score was closely linked to the TIDE and IPS scores and can reflect the state of the TME and potential immunotherapeutic response of OC patients, showing strong generalization ability and clinical adaptability. Hence, the PANoptosis signature represented an integrated scoring system that combined tumor cell death features with immune characteristics, demonstrating significant potential for identifying OC patients who may benefit from immunotherapy. However, the study also had some limitations. First, the robustness of the models may be affected by the inherent selection bias as we used retrospective datasets from public databases. Second, except for CD38, NFKB1, and STAT4, the underlying mechanisms of the other five genes in OC progression and the tumor immune microenvironment remained largely unknown and required further investigation. Therefore, the relationship between the eight model genes and TME during OC advancement and the underlying molecular mechanisms should be examined by in vivo and in vitro studies.
5. Conclusion
To conclude, this work established a PRG score, which can accurately identify high-risk OC patients and predict patients' prognostic outcomes. Correlation between high- and low-risk groups with different clinicopathological features, immune infiltration, immune response, and somatic mutations was revealed. Our study was the first to propose the potential value of PANoptosis in OC, contributing to the prognosis and clinical evaluation of targeted therapies.
The reference list from the paper itself. Each links out to its DOI / PubMed record.
- 1Ma L. Shao W. Zhu W. Exploring the Molecular Mechanisms and Potential Therapeutic Strategies of Ferroptosis in Ovarian Cancer Biocell 202448337938610.32604/biocell.2024.047812 · doi ↗
- 2Du L. Dou K. Liang N. Sun J. Bai R. U. Mi R-194-5p Suppresses the Warburg Effect in Ovarian Cancer Cells Through the IGF 1R/PI 3K/AKT Axis Biocell 202347354755410.32604/biocell.2023.025048 · doi ↗
- 3Menon U. Karpinskyj C. Gentry-Maharaj A. Ovarian Cancer Prevention and Screening Obstetrics and Gynecology 2018131590992710.1097/AOG.00000000000025802-s 2.0-8505442181529630008 · doi ↗ · pubmed ↗
- 4Chen S. F. Wang L. Y. Lin Y. S. Chen C. Y. Novel Protein-Based Prognostic Signature Linked to Immunotherapeutic Efficiency in Ovarian Cancer Journal of Ovarian Research 2024171 p. 19010.1186/s 13048-024-01518-w 39342345 PMC 11437962 · doi ↗ · pubmed ↗
- 5Lheureux S. Braunstein M. Oza A. M. Epithelial Ovarian Cancer: Evolution of Management in the Era of Precision Medicine CA: A Cancer Journal for Clinicians 201969428030410.3322/caac.215592-s 2.0-8506599758531099893 · doi ↗ · pubmed ↗
- 6Siegel R. L. Miller K. D. Wagle N. S. Jemal A. Cancer Statistics, 2023 CA: A Cancer Journal for Clinicians 2023731174810.3322/caac.2176336633525 · doi ↗ · pubmed ↗
- 7Chen W. Gullett J. M. Tweedell R. E. Kanneganti T. D. Innate Immune Inflammatory Cell Death: PA Noptosis and PA Noptosomes in Host Defense and Disease European Journal of Immunology 20235311 e 225023510.1002/eji.202250235 PMC 1042330336782083 · doi ↗ · pubmed ↗
- 8Karki R. Sharma B. R. Lee E. Interferon Regulatory Factor 1 Regulates PA Noptosis to Prevent Colorectal Cancer JCI Insight 202051210.1172/jci.insight.136720 PMC 740629932554929 · doi ↗ · pubmed ↗