Comparison of suansun fermentation methods based on SBSE-GC-MS combined with SVM machine learning
Jianwen Wu, Yizhao Li, Mi Qiu, Jihua Guan

TL;DR
This study compares three Suansun fermentation methods using chemical and microbial analysis combined with machine learning to determine which produces the best flavor profile.
Contribution
The study introduces a novel combination of SBSE-GC-MS, electronic nose, 16S rRNA, and SVM machine learning for comprehensive discrimination of Suansun fermentation methods.
Findings
Natural water-sealed fermentation produced the highest concentration of key flavor compounds.
The SVM model achieved a 100% discrimination rate among the three fermentation methods.
Weissella was found to significantly contribute to the production of p-cresol in natural water-sealed fermentation.
Abstract
This study aimed to analyze the flavor profile and microbial community structure of 54 Suansun samples, fermented using three different methods: direct fermentation, natural water-sealed fermentation, and natural fermentation. The combination of SBSE-GC-MS, electronic nose, 16S rRNA, and SVM machine learning was used for comprehensive discrimination. The flavor components and microbial community structure were analyzed using SBSE-GC-MS, electronic nose, and 16S rRNA sequencing. SVM machine learning was employed to classify the samples based on their characteristics. A total of 114 common aroma components were identified, including esters, alcohols, hydrocarbons, ketones, acids, aldehydes, heterocyclic compounds, phenols, halogenated hydrocarbons, amides, and others. Using a p < 0.05 and VIP > 1 threshold, 27 key characteristic flavor compounds were identified, with the highest…
Genes, proteins, chemicals, diseases, species, mutations and cell lines named across the full text — each resolved to its canonical identifier and authoritative record.
Click any figure to enlarge with its caption.
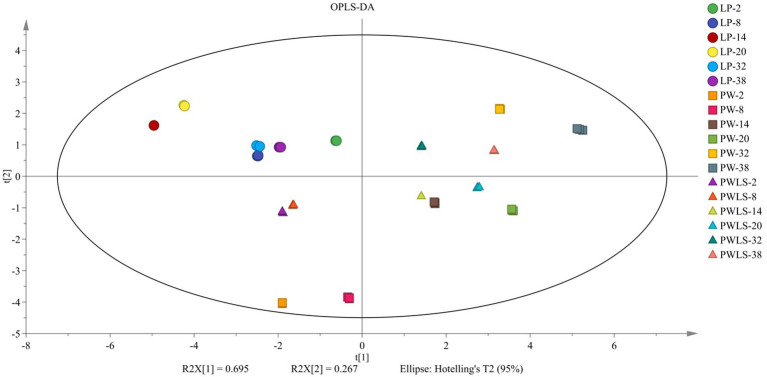 Figure 1
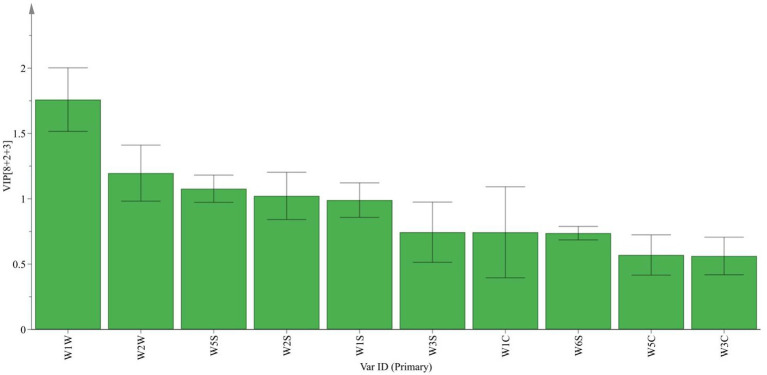 Figure 2
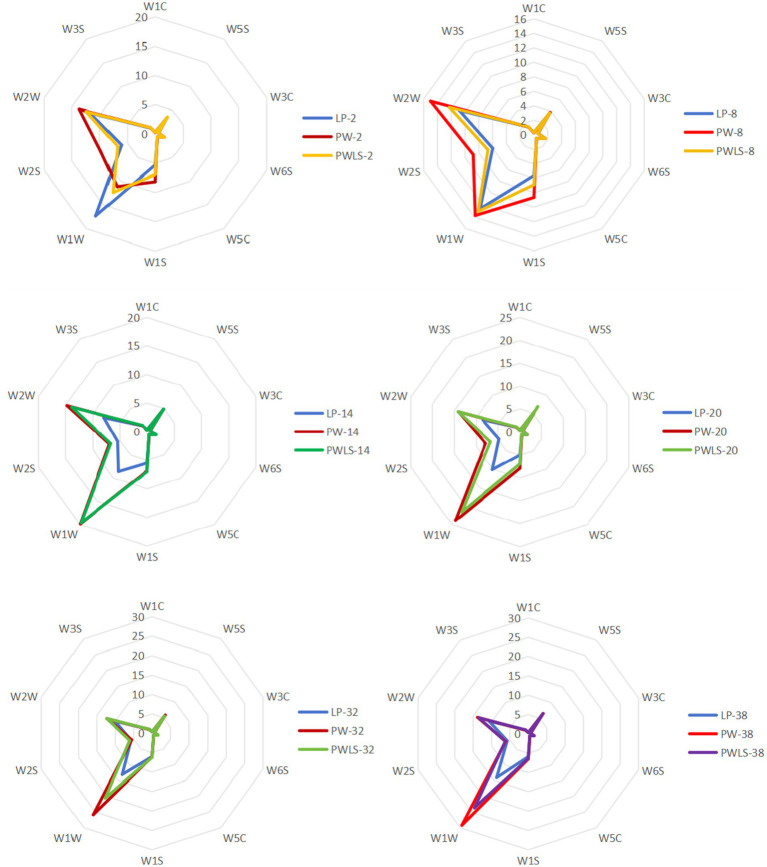 Figure 3
 Figure 4
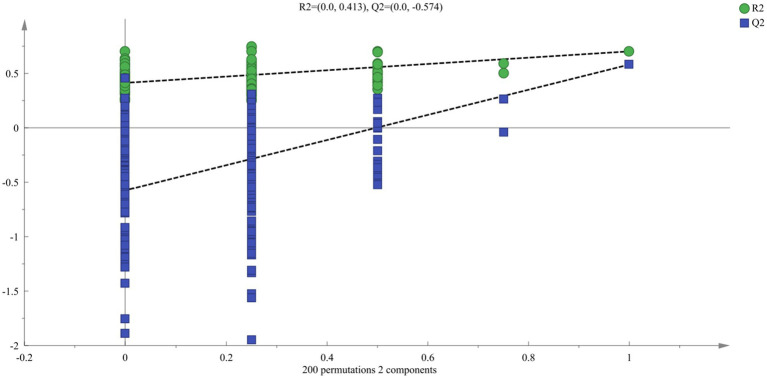 Figure 5
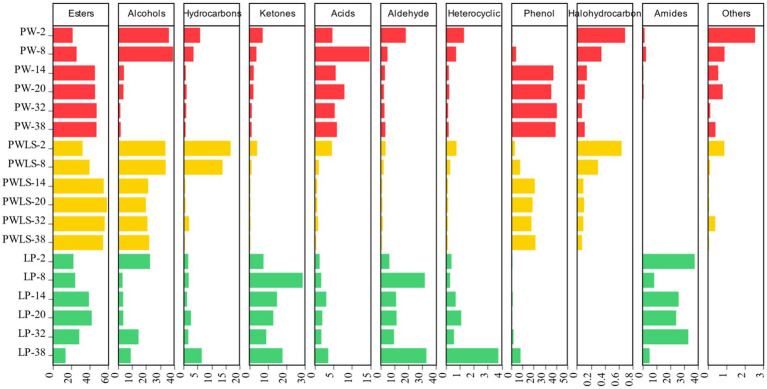 Figure 6
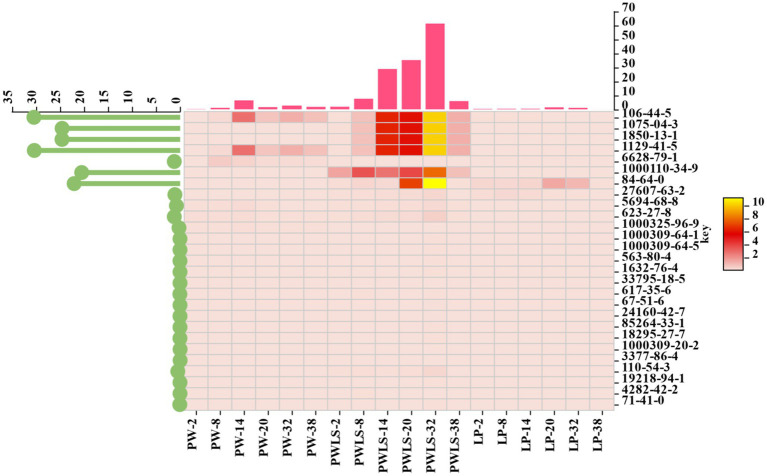 Figure 7
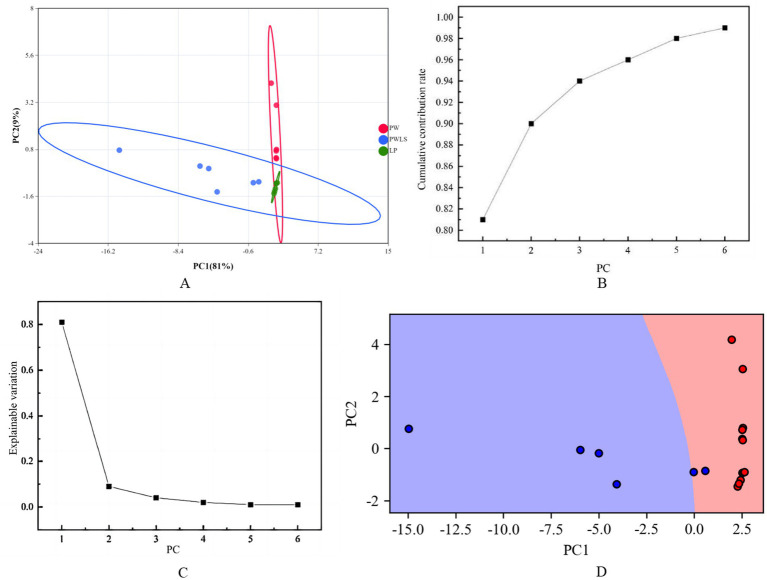 Figure 8
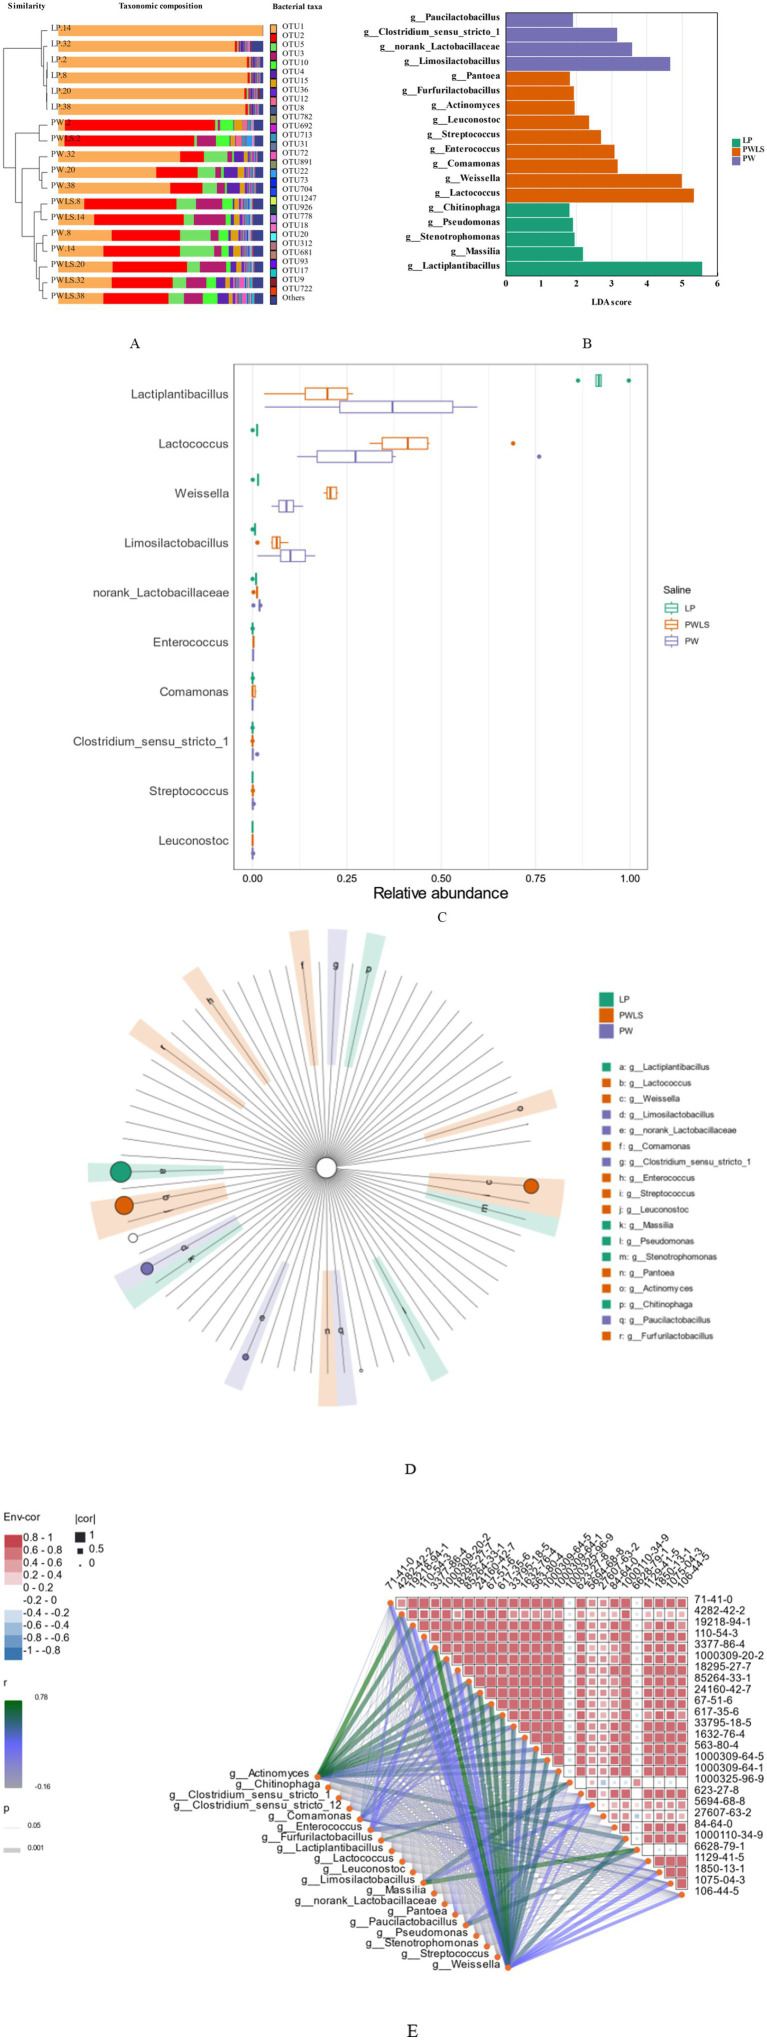 Figure 9
| Array serial number | Sensor name | Sensors respond to sensitive substances | Response value | ||
|---|---|---|---|---|---|
| LP-38 | PW-38 | PWLS-38 | |||
| 1 | W1C | Aromatic components, benzene derivatives | 0.35 ± 0.00023 | 0.34 ± 0.0011 | 0.34 ± 0.00046 |
| 2 | W5S | Nitrogen oxides, high sensitivity | 3.67 ± 0.0039 | 6.53 ± 0.044 | 6.46 ± 0.0062 |
| 3 | W3C | Aromatic components, ammonia compounds | 0.63 ± 0.00026 | 0.69 ± 0.00069 | 0.64 ± 0.00083 |
| 4 | W6S | Hydrogenated compounds, hydrogen gas | 1.56 ± 0.00035 | 1.53 ± 0.00050 | 1.59 ± 0.00042 |
| 5 | W5C | Aromatic components of short chain alkanes | 0.65 ± 0.0035 | 0.71 ± 0.0017 | 0.65 ± 0.00035 |
| 6 | W1S | Methyl group | 5.86 ± 0.0019 | 6.47 ± 0.018 | 6.31 ± 0.0056 |
| 7 | W1W | sulfide | 13.93 ± 0.031 | 29.23 ± 0.11 | 23.69 ± 0.0048 |
| 8 | W2S | Alcohols, aldehydes and ketones | 5.73 ± 0.00052 | 6.15 ± 0.029 | 6.26 ± 0.0055 |
| 9 | W2W | Aromatic components, organic sulfides | 10.69 ± 0.0038 | 13.82 ± 0.059 | 13.51 ± 0.0099 |
| 10 | W3S | Long chain alkanes | 1.29 ± 0.00025 | 1.15 ± 0.00046 | 1.27 ± 0.00064 |
| No | Category | CAS No | Compound name | Formula |
|---|---|---|---|---|
| 1 | Esters | 1850-13-1 | Carbamic acid- | C8H9NO2 |
| 2 | Esters | 1129-41-5 | 3-Methylphenyl- | C9H11NO2 |
| 3 | Esters | 1000309-64-1 | Oxalic acid, monoamide, n-propyl, propyl ester | C8H15NO3 |
| 4 | Esters | 1000309-64-5 | Oxalic acid, monoamide, n-propyl, hexyl ester | C11H21NO3 |
| 5 | Esters | 617-35-6 | Pyruvic acid ethyl ester | C5H8O3 |
| 6 | Esters | 1000325-96-9 | (3 | C18H17ClO4 |
| 7 | Esters | 84-64-0 | 1,2-Benzenedicarboxylicacid-1-butyl 2-cyclohexyl ester | C18H24O4 |
| 8 | Alcohols | 1075-04-3 | 1-phenylpropane-1,2-diol | C9H12O2 |
| 9 | Alcohols | 5694-68-8 | 1,3-Dioxolane-2-methanol | C4H8O3 |
| 10 | Alcohols | 85264-33-1 | 1H-Pyrazole-1-methanol,3,5-dimethyl- | C6H10N2O |
| 11 | Alcohols | 71-41-0 | n-Amyl alcohol | C5H12O |
| 12 | Alcohols | 1000110-34-9 | 1,2-Diphenylethanol | C18H20O |
| 13 | Halogenated Hydrocarbons | 18295-27-7 | Butane, 2-iodo-3-methyl- | C5H11I |
| 14 | Halogenated Hydrocarbons | 3377-86-4 | Hexane, 2-bromo- | C6H13Br |
| 15 | Halogenated Hydrocarbons | 4282-42-2 | 1-Iodononane | C9H19I |
| 16 | Halogenated Hydrocarbons | 19218-94-1 | Tetradecane, 1-iodo- | C14H29I |
| 17 | Heterocyclic Compounds | 1632-76-4 | 3-Methylpyridazine | C5H6N2 |
| 18 | Heterocyclic Compounds | 67-51-6 | 3,5-Dimethylpyrazole | C5H8N2 |
| 19 | Heterocyclic Compounds | 24160-42-7 | β-Methyl-1H-imidazole-4-ethanamine | C6H11N3 |
| 20 | Acids | 6628-79-1 | Pentanoic acid-3-methyl-4-oxo- | C6H10O3 |
| 21 | Acids | 33795-18-5 | Phosphonic acid- | C6H7O4P |
| 22 | Ketones | 27607-63-2 | 5-Ethyl-4-methyl-3-heptanone | C10H20O |
| 23 | Ketones | 563-80-4 | 3-Methyl-2-butanone | C5H10O |
| 24 | Phenols | 106-44-5 | C7H8O | |
| 25 | Aldehydes | 623-27-8 | 1,4-Phthalaldehyde | C8H6O2 |
| 26 | Hydrocarbons | 110-54-3 | Hexane | C6H14 |
| 27 | Sulfonate Esters | 1000309-20-2 | Propanoic acid, 2-methyl-3-hydroxy-2,2,4-trimethylpentyl ester | C14H30O3S |
| No | RI | Compound name | Formula | CAS No | Genus |
|
|
|---|---|---|---|---|---|---|---|
| 1 | 753 | 7-Hydroxy-7,8,9,10-tetramethyl-7,8-dihydrocyclohepta[d,e]naphthalene | C18H20O | 1000110-34-9 |
| 0.51 | 0.001 |
| 2 | 859 | Oxalic acid, monoamide, n-propyl, propyl ester | C8H15NO3 | 1000309-64-1 |
| 0.51 | 0.001 |
| 3 | 859 | Oxalic acid, monoamide, n-propyl, hexyl ester | C11H21NO3 | 1000309-64-5 |
| 0.54 | 0.001 |
| 4 | 859 | 2-Butanone, 3-methyl- | C5H10O | 563-80-4 |
| 0.54 | 0.001 |
| 5 | 2126 | 3-Methylpyridazine | C5H6N2 | 1632-76-4 |
| 0.49 | 0.001 |
| 6 | 2126 | Phosphonic acid, (p-hydroxyphenyl)- | C6H7O4P | 33795-18-5 |
| 0.57 | 0.001 |
| 7 | 1327 | Propanoic acid, 2-oxo-, ethyl ester | C5H8O3 | 617-35-6 |
| 0.64 | 0.001 |
| 8 | 1493 | 3,5-Dimethylpyrazole | C5H8N2 | 67-51-6 |
| 0.63 | 0.001 |
| 9 | 1493 | 1H-Imidazole-4-ethanamine, beta.-methyl- | C6H11N3 | 24160-42-7 |
| 0.61 | 0.001 |
| 10 | 1493 | 3,5-Dimethylpyrazole-1-methanol | C6H10N2O | 85264-33-1 |
| 0.58 | 0.001 |
| 11 | 786 | Butane, 2-iodo-3-methyl- | C5H11I | 18295-27-7 |
| 0.39 | 0.001 |
| 12 | 999 | Sulfurous acid, 2-ethylhexyl hexyl ester | C14H30O3S | 1000309-20-2 |
| 0.50 | 0.001 |
| 13 | 879 | Hexane, 2-bromo- | C6H13Br | 3377-86-4 |
| 0.71 | 0.001 |
| 14 | 924 | n-Hexane | C6H14 | 110-54-3 |
| 0.40 | 0.001 |
| 15 | 1718 | Tetradecane, 1-iodo- | C14H29I | 19218-94-1 |
| 0.39 | 0.001 |
| 26 | 1718 | Nonane, 1-iodo- | C9H19I | 4282-42-2 |
| 0.44 | 0.001 |
| 17 | 1217 | 1-Pentanol | C5H12O | 71-41-0 |
| 0.35 | 0.001 |
| 18 | 1185 | Pentanoic acid, 3-methyl-4-oxo- | C6H10O3 | 6628-79-1 |
| 0.70 | 0.001 |
| 19 | 1327 | Propanoic acid, 2-oxo-, ethyl ester | C5H8O3 | 617-35-6 |
| 0.62 | 0.001 |
| 20 | 1493 | 3,5-Dimethylpyrazole | C5H8N2 | 67-51-6 |
| 0.63 | 0.001 |
| 21 | 1493 | 3,5-Dimethylpyrazole-1-methanol | C6H10N2O | 85264-33-1 |
| 0.60 | 0.001 |
| 22 | 879 | Hexane, 2-bromo- | C6H13Br | 3377-86-4 |
| 0.67 | 0.001 |
| 23 | 1718 | Nonane, 1-iodo- | C9H19I | 4282-42-2 |
| 0.78 | 0.001 |
Peer Reviews
No public reviews on file for this paper yet. If you reviewed it on a platform where reviews are public (OpenReview, ICLR, NeurIPS, ICML), you can paste yours below so the community can read it here.
Videos
No videos yet. Explain this paper in a talk, walkthrough, or lecture? Add one.
Taxonomy
TopicsProbiotics and Fermented Foods · Food Quality and Safety Studies · Fermentation and Sensory Analysis
Introduction
1
Sour bamboo shoots (suansun) are a fermented vegetable product with a unique flavor. Suansun are used in many local dishes, such as Liuzhou Luosifen, Laoyou powder, Guilin rice noodles, and other traditional dishes, including northern Guangdong roast duck. Suansun are also popular among ethnic minorities in India, Southeast Asia, regions south of the Himalayas, Nepal, Bhutan, Thailand, and Taiwan in China (Choudhury et al., 2012). In 2023, the sales revenue of the whole industrial chain of Luosifen in Liuzhou, China reached 66.99 billion yuan, up 11.5% year on year. In particular, during the COVID-19 pandemic, Luosifen became even more popular as a home food. The daily average production of Luosifen alone has reached 5.06 million bags. Bagged products produced by the industry have been sold all over the world, leading to a huge demand for suansun. Fresh bamboo shoots are prone to lignification after harvesting, which leads to deterioration of edibility and processing quality. Lignification is characterized by the accumulation of cellulose, hemicellulose, and lignin, resulting in increased firmness, decreased water content, and reduced porosity of the tissue. The process is associated with transcriptional activation of lignin biosynthesis genes such as PAL, CCR, and CAD. These changes not only limit microbial access to intracellular substrates but also reduce the efficiency of fermentation, leading to weaker aroma profiles and less favorable texture in the final pickled products (Zhang et al., 2020). However, the traditional natural fermentation cycle is long, overly dependent on experience, not standardized, and far from being able to meet the surging industrial demand.
The main raw material for suansun is bamboo shoots. The traditional method for obtaining suansun is to peel, wash, and cut fresh bamboo shoots, soak them in mountain spring water or cold boiled water, and place them in a kimchi jar. Spontaneous fermentation at room temperature takes 15–30 days (Guan et al., 2020b). Direct inoculation with various fermentation agents is the main method used for making modern suansun. Screening functional strains can ensure the safety, stability, and flavor consistency of the product, and achieve targeted fermentation. Lactobacillus plantarum is one of the most commonly used strains in inoculation fermentation. It can effectively inhibit nitrite and pathogenic bacteria, while also enhancing the overall flavor of the product (Yu et al., 2023; Zhang et al., 2022). While pursuing production efficiency, maintaining the flavor of suansun is also a key focus of research. The structure of the microbial community of suansun varies depending on the region and fermentation method. The characteristic flavors of suansun include acidic substances such as acetic acid and lactic acid, p-cresol, and volatile substances such as valeraldehyde and ethyl acetate.
Electronic nose technology (E-nose) is a new type of artificial intelligence olfactory device for rapid and non-destructive testing, but it cannot separate and identify the aroma components of samples. Headspace solid-phase microextraction (HS-SPME) enables automation in the aroma enrichment process, with advantages such as convenience and speed. HS-SPME-gas chromatography-mass spectrometry (HS-SPME-GC-MS) is commonly used for detecting and identifying aroma components (Lin et al., 2013; Liu et al., 2020). SPME uses the chromatographic stationary phase on the surface of quartz fibers to extract components from the sample through adsorption for analysis. Unlike SPME, the adsorption layer of SBSE (stir bar adsorbent extraction) relies on van der Waals forces for the extraction of compounds, rather than surface adsorption. It not only requires lower thermal energy to release compounds, avoiding the loss of thermosensitive compounds, but also lacks surface competitiveness and has a larger linear range. Therefore, in this study, SBSE-GC-MS and electronic nose were used to systematically analyze the key flavors that affect direct fermentation and natural fermentation of suansun. An SVM algorithm was used to identify fermentation methods, and 16sRNA was used to explore the changes in bacterial structure during fermentation and the correlation with key flavor compounds.
Materials and methods
2
Sample preparation and collection of suansun
2.1
Fresh bamboo shoots of Dendrocalamus latiflorus harvested from Liucheng County, Liuzhou City, Guangxi Province were stored at 4°C and transported to the laboratory within 24 h. After removing the bamboo shoot shell, rinsing with sterile water, cutting it into 10 cm × 0.5 cm × 0.5 cm thin filaments, they were placed in ceramic jars with a capacity of 1 L. Each jar contained 800 g of bamboo shoot filaments, which were immersed in pure water (PWLS) and Lactobacillus plantarum solution (LP) for water sealed fermentation, as well as in pure water soaking without water sealed fermentation (PW). The inoculation amount of LP is 2% of the mass of bamboo shoots. Samples were taken on the 2nd, 8th, 14th, 20th, 32nd, and 38th days of fermentation, with three replicates for each sample, totaling 54 samples. Unopened samples were randomly selected for sterile sampling and stored at −80°C for further analysis.
Lactobacillus plantarum was purchased from Weihai Haixi (Shandong) Bioengineering Co., Ltd. Normal alkanes and 2,4,6-trimethylpyridine were purchased from Shanghai Anpu Company. The SBSE gas chromatography-mass spectrometer (8890-5977B) was from Agilent Technologies. The PEN3 portable electronic nose was from Airsense, a German company.
SBSE-GC-MS
2.2
Extraction conditions for flavor compounds
2.2.1
Extracts from suansun samples stored at −80°C were obtained by physical extrusion using a round headed glass rod, and diluting 250 times with saturated saline solution. Then, 6 mL of the diluted solution was placed in a headspace vial along with Twisters that have been aged and 100 μL of internal standard substance (2,4,6-trimethylpyridine, 1 ng/mL), which was shaken and extracted at 50°C for 1.5 h. After extraction, the Twisters were rinsed with ultrapure water and the surface was cleaned with a dust-free tissue before placing them in a hot desorption sample tube for testing.
MPS conditions
2.2.2
Thermal desorption (TDU) program: at a rate of 50°C/min, from an initial temperature of 10–250°C then held for 15 min without shunting; cold inlet (CIS) program: at a rate of 12°C/s, from an initial temperature of 10–250°C held for 10 min with a shunt ratio of 3:1.
GC conditions
2.2.3
Agilent DB Wax capillary gas chromatography column (60 m × 0.25 mm × 0.25 μm), heating program: initial temperature of 40°C, held for 4 min; then raised to 140°C at a rate of 6°C/min, held for 5 min; then raised to 150°C at a rate of 3°C/min, held for 1 min; then raised to 197°C at a rate of 5°C/min and maintained for 2 min; then raised to 205°C at a rate of 1°C/min and maintained for 0 min; then raised to 240°C at a rate of 7°C/min and maintained for 15 min. The flow rate of the chromatographic column was 1.7 mL/min, with no split injections; the carrier gas was high-purity helium (He).
MS conditions
2.2.4
Ionization method: EI, Electronic energy: 70 EV, transmission line temperature: 250°C, ion source temperature: 230°C, quadrupole temperature: 150°C, full scan mode (SCAN), scanning range: 25–250 da.
E-nose
2.3
Sample pretreatment: 5 g of solid suansun was weighed into a 100 mL beaker, sealed with cling film, and heated at a constant temperature water bath at 40°C for 10 min until the headspace gas reached equilibrium.
Test method: Under the conditions of a carrier gas flow rate of 400 mL/min, the carrier gas carried the sample headspace gas through the sensor array and into contact with the sensor array to generate a response signal. The sampling interval was 1 s, the signal detection time was set to 120 s, and the cleaning time was set to 60 s. Each sample was measured in parallel three times, and the average of the test data was taken for statistical analysis.
DNA extraction
2.4
Total community genomic DNA was extracted using the E.Z.N.A™ MagBind Soil DNA Kit (M5635-02, Omega Bio-Tek, Norcross, GA, USA) following the manufacturer’s instructions. The DNA concentration was quantified using a Qubit 4.0 fluorometer (Thermo Fisher Scientific, Waltham, MA, USA) to ensure that adequate amounts of high-quality genomic DNA had been extracted.
16S rRNA gene amplification
2.5
The target was the V3–V4 hypervariable region of the bacterial 16S rRNA gene. The region was amplified by PCR immediately upon DNA extraction. The 16S rRNA V3–V4 fragment was amplified using two universal bacterial 16S rRNA gene amplicon PCR primers (PAGE purified): the amplicon PCR forward primer (CCTACGGGNGGCWGCAG) and amplicon PCR reverse primer (GACTACHVGGGTATCTAATCC). The reaction mixture composition was as follows: 2 μL microbial DNA (10 ng/μl), 1 μL amplicon PCR forward primer (10 μM), 1 μL amplicon PCR reverse primer (10 μM), and 30 μL 2 × Hieff®Robust PCR Master Mix (Yeasen, 10105ES03, Shanghai, China). The plate was sealed and the PCR performed in a thermal-cycling instrument (Applied Biosystems 9700, Foster City, CA, USA) using the following program: 1 cycle of denaturation at 95°C for 3 min; 5 cycles of denaturation at 95°C for 30 s, annealing at 45°C for 30 s, and elongation at 72°C for 30 s; 20 cycles of denaturation at 95°C for 30 s, annealing at 55°C for 30 s, and elongation at 72°C for 30 s; and a final extension at 72°C for 5 min. The PCR products were checked by electrophoresis in 2% (w/v) agarose gels in TBE buffer stained with ethidium bromide and visualized under ultraviolet light.
16S gene library construction, quantification, and sequencing
2.6
Hieff NGS™ DNA Selection Beads (Yeasen, 10105ES03) were used to purify the free primers and primer dimer species in the amplicon product. Samples were delivered to Sangon BioTech (Shanghai, China) for cDNA library construction using universal Illumina adaptors and indices. Before sequencing, the DNA concentration of each PCR product was determined using a Qubit 4.0 Green double-stranded DNA assay and quality control was performed with a bioanalyzer (Agilent 2100, Santa Clara, CA, USA). Depending on the coverage requirement, all libraries could be pooled for one run. The amplicons from each reaction mixture were pooled in equimolar ratios based on their concentration. Sequencing was performed using the Illumina MiSeq system (Illumina, San Diego, CA, USA) in accordance with the manufacturer’s instructions.
Sequence processing, OTU clustering, representative tags alignment, and taxonomic classification
2.7
After sequencing, the two short-read Illumina datasets were assembled with PEAR software (version 0.9.8) based on overlap in the short reads. The FASTQ files were processed to generate individual FASTA and QUAL files, which could then be analyzed by standard methods. The effective tags were clustered into operational taxonomic units (OTUs) of ≥97% similarity using Usearch software (version 11.0.667). Chimeric sequences and singleton OTUs (with only one read) were removed, after which the remaining sequences were sorted into each sample based on the OTUs. The tag sequence with the highest abundance was selected as a representative sequence within each cluster. Bacterial and fungal OTU representative sequences were classified taxonomically by conducting a BLAST search against the RDP database and the UNITE database, respectively.
Statistical analysis
2.8
Partial least squares discriminant analysis was performed using SIMCA 14.1 software and SVM discriminant analysis was performed in R language. Qualitative analysis: NIST23 spectral library and Aroma Office 2D flavor library were used to search and compare, combined with the retention index (RI) for qualitative analysis, screening compounds with a match of more than 70, and at the same time, a mixture of C7–C40 n-alkanes was injected into the sample individually, and the warming procedure was consistent with the conditions of the GC-MS assay, so as to calculate the RI of each volatile compound. The RI of each volatile was calculated and compared with the RI values in the literature. Quantitative analysis: Using 2,4,6-trimethylpyridine as internal standard, the content of each component in the sample was calculated based on the concentration of the internal standard and the ratio of the peak area of each component in the sample to the peak area of the internal standard.
RI is the retention index; n is the number of carbons; t_i_ is the retention time of the volatile component to be measured; t_n_ is the retention time of the n-alkanes; t_n + 1_ is the retention time of the (n + 1) carbon n-alkanes.
C_1_ is the concentration of the compound to be tested (μg/mL), C_0_ is the concentration of the internal standard (2,4,6-trimethylpyridine; μg/mL), A_1_ is the peak area of the compound to be tested, A_0_ is the peak area of the internal standard, V_1_ is the volume of the extracted sample (i.e., 6.0 mL), and V_0_ is the volume of the internal standard (i.e., 100 μL).
To identify key aroma compounds that contributed to the differentiation among fermentation methods, partial least squares discriminant analysis (PLS-DA) was conducted using SIMCA 14.1 software. Compounds were selected as potential discriminative markers if they met two criteria: (1) a variable importance in projection (VIP) score greater than 1.0 from the PLS-DA model, indicating a strong contribution to sample separation, and (2) a statistically significant difference among groups (p < 0.05), as determined by one-way ANOVA.
Results and discussion
3
Analysis of quality differences in suansun based on E-nose technology
3.1
As shown in Figure 1, the suansun treated with three different fermentation methods were separated on both the horizontal and vertical axes of the score scatter plot, with an independent variable fitting index (R^2^X) of 1 and a dependent variable fitting index (R^2^X) of 0.568. The LP scores throughout the fermentation process were concentrated in one quadrant, achieving a clear distinction from the PW and PWLS treatments. As fermentation progressed, PW and PWLS were divided into three groups in the horizontal and vertical axes, namely on the 2nd and 8th days, 14th and 20th days, and 32nd and 38th days of fermentation, evenly distributed in the other three quadrants. Adding Lactobacillus plantarum stabilized the fermentation flavor of suansun without significant fluctuations due to prolonged fermentation time. In summary, there is a clear distinction between direct fermentation and natural fermentation in both the horizontal and vertical axes.
OPLS-DA scatter plot of suansun electronic nose treated with different fermentation methods.
Based on the data in Table 1, a VIP map of electronic nose characteristic odor (Figure 2) and a radar fingerprint map (Figure 3) were plotted. It can be seen that the response values of 10 sensors to the volatile components of suansun obtained by three different fermentation methods are different. Among the 10 sensors, W1W, W2W, W5S, W2S, and W1S made significant contributions to the OPLS-DA model in this experiment. Among them, W1W was sensitive to sulfides, and on the second day of fermentation, the response value of W1W sensor to direct injection fermentation was significantly higher than that of the two natural fermentations. When a watershed appeared on the 8th day of fermentation, the response value of W1W sensor to LP was slightly lower than that of PW and PWLS. As fermentation continued, the response value of LP was significantly lower than that of PW and PWLS. In addition, there was no significant difference in the response values of WIW to PW and PWLS, and from the 8th day of fermentation, the response values of PW were slightly higher than those of PWLS. Sensor W2S was sensitive to alcohols, aldehydes, and ketones, and the response value of LP is significantly lower than PW. As fermentation progressed, the gap continued to narrow until the response was comparable on the 38th day of fermentation. Overall, the response values of LP to the five key sensors were lower or comparable to PW and PWLS. The difference between PW and PWLS was mainly reflected in the first 8 days of fermentation, with significant differences in response to three sensors: W1S, W2S, and W2W. W1S was sensitive to methyl groups, while W2W was sensitive to aromatic components and organic sulfides. After 14 days of fermentation, PW and PWLS had comparable responses to the five sensors.
VIP of suansun electronic nose treated with different fermentation methods.
Radar chart of suansun electronic nose treated with different fermentation methods.
Analysis of aroma component characteristics
3.2
To study the changes in aroma of suansun produced by the three different fermentation methods during the fermentation process, SBSE-GC-MS was used to analyze and identify the aroma components and contents of 54 suansun samples, and a total of 148 common aroma components were detected. Using 148 common aroma components as dependent variables and different fermentation methods as independent variables, OPLS-DA (Figure 4) can effectively distinguish different fermentation methods. The independent variable fitting index (R^2^x) in this analysis was 0.884, the dependent variable fitting index (R^2^y) was 0.746, and the model prediction index (Q^2^) was 0.617. If R^2^ and Q^2^ exceeded 0.5, the model fitting results were acceptable. After 200 replacement tests, as shown in Figure 5, the intersection point between the Q^2^ regression line and the vertical axis was less than 0, indicating that the model did not exhibit overfitting and the model validation was effective. It is believed that this method can be used for the identification and analysis of aroma components in suansun treated with different fermentation methods.
OPLS-DA plots of suansun treated with different fermentation methods.
Permutation test.
Based on 148 common aroma components, further removal of substances that did not have any more information in the NIST 23.LT and Aroma Office 2D flavor libraries (Equations 1, 2) resulted in the screening of 114 compounds (as shown in Figure 6), including up to 31 esters, 16 alcohols, 16 hydrocarbons, 16 ketones, 9 acids, 7 aldehydes, 6 heterocyclic compounds, 4 phenols, 4 halogenated hydrocarbons, 3 amides, and 2 others. The main volatile flavor compounds in the early stage of fermentation (the 2nd day of fermentation) using two natural fermentation methods were alcohols, consistent with existing literature reports (Guan, 2023). Alcohol compounds account for 36.29 and 33.8% of the total volatile substance content in PW and PWLS, respectively. As fermentation continued, esters, alcohols, and phenols were the main volatile flavor compounds in the later stages of fermentation, consistent with the sensitivity of W2S, one of the five sensors that contributed significantly to electronic nose detection, to alcohols, aldehydes, and ketones. From the 14th to the 38th day of fermentation, the main flavor compounds in PW remained stable, mainly esters (45.32–46.98%) and phenols (35.65–40.66%), while PWLS mainly consisted of esters (54.14–58.19%), alcohols (19.77–22.11%), and phenols (17.78–21.38%). Direct fermentation was completely different from natural fermentation. Amides (37.49%) were the main flavor compounds in the early stages of LP, while esters, ketones, aldehydes, and amides were the main compounds in the later stages of fermentation. Direct fermentation consistently exhibited high levels of esters and aldehydes, as well as low levels of phenols, through the Ehrlich route, which Lactobacillus plantarum uses to transform free amino acids in suansun into aldehydes (Xue et al., 2025). By using L-histidine and L-phenylalanine, this procedure lessens astringency and bitterness (Cai et al., 2019). In summary, starting from 14 days of natural fermentation, there is a significant change in the main categories of flavor compounds, such as esters, alcohols, and phenols, with a noticeable increase or decrease in their content. This is consistent with the results from the electronic nose, which showed significant changes in response after 14 days of fermentation, an important time point for natural fermentation. The p-cresol in phenolic compounds is the main characteristic flavor substance in suansun, with a unique “odor” (Guo et al., 2021). In natural fermentation samples, p-cresol reached its peak on the 32nd day, while PW samples increased from 0.0065 μg/mL to 1.24 μg/mL, with a content increase of 190.77 times. The PWLS sample increased from 0.017 μg/mL to 10.22 μg/mL, which was also the flavor substance with the highest content detected. The results were consistent with the literature (Li et al., 2022), with a content increase of 601.17 times. It is worth noting that on the second day of direct fermentation, the highest concentration of p-cresol was 0.023 μg/mL. As fermentation progressed, the concentration gradually decreased to 0.0022 μg/mL, a decrease of 10.45 times. From the 8th day onwards, the p-cresol content was significantly lower than that of natural fermentation. Guan et al. collected 50 samples of bamboo shoots from 23 regions in Guangxi, Guangdong, Yunnan, and Fujian provinces and found that the content of p-cresol increased by 64.5 times throughout the fermentation process (Guan, 2023).
Bar chart of 11 flavor compounds in suansun treated with different fermentation methods.
The pronounced accumulation of p-cresol observed during the water-sealed fermentation (PWLS) is likely attributable to enhanced microbial tyrosine metabolism under strictly anaerobic conditions. Previous studies have identified tyrosine metabolism as one of the most enriched functional pathways in naturally fermented bamboo shoots (Yu et al., 2006), underscoring its pivotal role in amino acid transformation during fermentation. In this pathway, tyrosine is first converted to p-hydroxyphenylpyruvate via tyrosine aminotransferase, followed by decarboxylation to p-hydroxyphenylacetate and subsequent conversion to p-cresol, catalyzed by p-hydroxyphenylacetate decarboxylase (4-HPA decarboxylase), as reported in Clostridium difficile (Yu et al., 2006). This enzymatic process is highly oxygen-sensitive and is typically activated under anaerobic conditions.
Metagenomic annotations have further confirmed the presence of key genes encoding these enzymes in Lactiplantibacillus plantarum and Lacticaseibacillus fermentum, both of which were found to dominate the later stages of PWLS. In addition, recent studies have suggested an alternative route for p-cresol biosynthesis via S-adenosylmethionine (SAM)-dependent methylation of tyrosine in certain lactic acid bacteria (Chen et al., 2023). Collectively, these findings provide a mechanistic basis for the observed 600-fold surge in p-cresol under PWLS and highlight the synergistic effects of microbial composition and the unique anaerobic environment on phenolic compound accumulation.
Analysis of differences in aroma components of different suansun
3.3
In order to further analyze the contribution of different aroma components to distinguishing different fermentation methods, 27 different aroma substances from three different fermentation methods were screened based on the criteria of p < 0.05 and VIP > 1 (Figure 7), including 7 esters, 5 alcohols, 4 halogenated hydrocarbons, 3 heterocyclic compounds, 2 acids, 2 ketones, 1 phenol, 1 aldehyde, 1 hydrocarbon, and 1 sulfonate ester. Please refer to Table 2 for details. From the lollipop chart on the left side of the heatmap in Figure 7, it can be seen that 6 out of the 27 key flavor compounds showed outstanding performance, namely p-cresol, 1-phenylpropane-1,2-diol, carbamic acid, p-tolyl ester, 3-methylphenyl-N-met, 1,2-diphenylethanol, 1,2-benzenedicarboxylicacid, 1-butyl 2-cyclohexyl ester. Throughout the fermentation period (2–38 days), three key flavor substances, 1-phenylpropane-1,2-diol, 1,2-diphenylethanol, and carbamic acid, p-tolyl ester, were present only in PWLS. The bar graph above the heat map shows the sum of the variables in each column, showing that the sum of the key core flavor components in PWLS was significantly different from the other two treatments, reaching its highest value at day 32 of fermentation. Throughout the metabolic processes of microorganisms, macromolecular compounds were oxidized and hydrolyzed during suansun fermentation, producing a high number of taste precursors and causing a rapid increase in volatile chemicals (Raghuvanshi et al., 2019).
Thermogram of different aroma composition combinations of suansun processed by different fermentation methods.
Discriminant analysis of fermentation mode based on differential aroma components
3.4
In order to obtain more accurate and intuitive classification results, based on the 27 aroma components screened with intergroup differences, the aroma data of suansun treated with three different fermentation methods were analyzed by fermentation method discrimination. Differential aroma data were downscaled using PCA to obtain scatter plots of suansun scores for different fermentation treatments for the first 2 PCs (Figure 8A). As shown in Figure 8B, the closer the PC cumulative ratio to 1, the more reliable the PCA model. As shown in Figure 8C, the explainable variance of each PC is PC1 > PC2 > PC3 > PC4 > PC5 > PC6, in which the variance contribution rates of PC1 and PC2 are 81 and 9% respectively, and the cumulative variance contribution rate reaches 90%, which demonstrates that the artificial selection of PC1 and PC2 analysis samples has good reliability. The SVM model was based on the first 2 PCs, and the samples were randomly divided into a training set (70%) and a test set (30%), and the SVM model discrimination rate reached 100% (Figure 8D).
PCA plot of differential aroma of suansun treated with different fermentation methods. (A) Scatter plot of suansun scores for the first two PCs. (B) Cumulative variance ratio of the first two PCs. (C) Explained variance of each principal component. (D) SVM model discrimination rate using the first two PCs.
Association analysis of dominant colonies with characteristic flavor substances
3.5
Figure 9A shows the structure of the three acid shoot bacterial communities at the genus level (only the top 30 bacteria in terms of mean relative abundance are listed; other bacterial genera are denoted by “other”). The sum of the abundances of the genera listed in the figure accounted for more than 94.2% of the total bacterial genus abundance in each sample, which reflects the main genus information of each sample. Some researchers have designated genera with average relative abundance ≥1% as dominant genera (Tang et al., 2022, 2024). Lactiplantibacillus was the bacterial genus with the highest mean relative abundance (48.52%) in the suansun samples, with a range of relative abundance from 3.04 to 99.69% in the different samples, and was the dominant genus in all samples. This is inconsistent with some reported findings, which showed that the dominant genus was Lactobacillus (Darmayanti et al., 2014; Guan et al., 2020a; Thakur et al., 2015). This may be due to the renaming of the bacterial genus. In 2020, the International Commission on Bacteriological Nomenclature undertook a comprehensive review and update of the classification of wild forking bacteria. Among the most notable changes was the renaming of a portion of the genus Lactobacillus as Lactiplantibacillus. The reclassification of Lactobacillus plantarum to Lactiplantibacillus plantarum was part of a comprehensive taxonomic revision based on whole-genome sequencing (Zheng et al., 2020). This study systematically reassigned multiple plant-associated strains, including L. plantarum, into the newly proposed genus Lactiplantibacillus. Earlier literature (Luo et al., 2020; Raghuvanshi et al., 2019; Romi et al., 2015; Thakur et al., 2015) still refer to Lactobacillus plantarum, whereas more recent research (Botthoulath et al., 2024; Jian et al., 2024; Qian et al., 2024; Qin et al., 2024; Wu et al., 2025; Xue et al., 2025) employs the updated Lactiplantibacillus nomenclature. Despite the change in genus name, functional roles such as acid production, amino acid metabolism, and flavor compound generation remain highly consistent across both nomenclatures. Therefore, we believe our results align with both legacy and current studies, and adopting the updated classification enhances consistency with contemporary microbial ecology frameworks. Similar to most vegetable fermentations, the fermentation process of suansun is significantly influenced by lactic acid bacteria (Das et al., 2023). The main lactic acid bacteria strain contained Weissella sp., Lactobacillus plantarum, Lactobacillus curvatus, Pediococcus pentosaceus, and Leuconostoc sp., (Chen et al., 2022; Guan et al., 2020b; Li et al., 2023).
(A) Bacterial community structure of different suansun at the genus level; (B–D) LDA value distribution bar chart, abundance difference chart, and classification tree chart of different bacterial colonies in suansun at the genus level; (E) Correlation network heatmap between 19 dominant bacterial genera and 27 key flavor compounds.
The abundance of Lactiplantibacillus in LP increased rapidly on day 2 of fermentation (92.03% relative abundance) and peaked on fermentation day 14 (99.69% relative abundance), which was significantly higher than that of the PW and PWLS treatment groups, and then began to decline gradually to a minimum on day 32 of fermentation (86.17% relative abundance). Similar to the findings of Botthoulath et al. (2024) who used Lactiplantibacillus plantarum BBS13 as a fermenter, the strain counts reached a maximum at approximately 9 log CFU/g during the first 3 days of fermentation, with a sharp decline occurring between day 7 and the end of fermentation (Botthoulath et al., 2024). Xue et al. showed that, in the inoculation of Lactobacillus plantarum DACN768-fermented suansun, the content of 56 volatile flavor compounds peaked at 14 d (Xue et al., 2025). The natural fermentation, on the other hand, started to show a sharp increase in flavor content only on day 14, which peaked on fermentation day 32. This suggests that inoculation with Lactobacillus plantarum can improve on the effects of the natural microflora present in the raw material and has the potential to greatly enhance the production cycle. In addition, this study also found that Lactococcus (24.86%), Weissella (7.68%), and Limosilobacillus (5.52%) have relatively high average relative abundance, making them the dominant bacterial genera in suansun. Similarly, water sealed fermentation is used, but Lactobacillus and Lactobacillus were dominant at the genetic level in suansun soaked in mountain spring water (Chen et al., 2022). Weissella, Lactococcus, and Lactobacillus were the predominant genera in the fermentation process, as demonstrated by the natural fermentation of suansun (Romi et al., 2015). These are similar to our natural water-sealed fermentation results. There are few reports on Limonolobacillus as the dominant bacterial genus in naturally fermented (non-water sealed) suansun, and this difference may be caused by factors such as sampling location, suansun production process, and fermentation time (Jian et al., 2024; Tang et al., 2024).
Figure 9B shows the characteristics of microorganisms at different taxonomic levels under various fermentation conditions, and identifies biomarkers with significant differences between different suansun samples through linear discriminant analysis effect size (LEfSe) analysis. Overall, the linear discriminant analysis score (LDA) scores of different bacterial genera in different samples showed a clear discrete distribution, indicating significant differences in microbial community composition among different samples. Each sample had unique distribution characteristics of bacterial genera, and a total of 18 dominant bacterial genera were identified. In the LP fermentation system, Lactiplantibacillus, which may have been added due to the advantage of direct injection fermentation, can reproduce in large numbers and become the dominant microbial community, with an abundance range of 86.17–99.69%, resulting in a high LDA value and a single bacterial species composition, becoming a key microbial marker for distinguishing other samples. In the PWLS and PW fermentation systems, the dominant bacterial genera include Lactococcus, Weissella, and Limosilobacillus. The selected biomarkers include not only bacterial genera with high average relative abundance mentioned above, but also Clostridiumsensustricto1 with an average relative abundance of 0.008%. Figure 9C provides a visual representation of the differences in average relative abundance of different bacterial genera in the various fermentation systems. The classification tree diagram in Figure 9D shows the hierarchical classification, evolutionary relationships, and significantly different species of microorganisms during the suansun fermentation process. It can be seen from Figure 9D that Lactiplantibacillus, Lactococcus, Weissella, Limosilactobacillus, Leuconostoc, Paucilactobacillus, Furfurilactobacillus, and other bacterial genera, although belonging to the larger group of lactic acid bacteria, have evolutionary differences which may lead to differences in their functions and metabolic pathways during the suansun fermentation process. Lactobacillus, Weissella, and Lactococcus were the main genera in suansun (Chen et al., 2023; Hu et al., 2023), which is similar to our research findings. Lactobacillus plantarum and Limosilactobacillus reuteri can increase the sourness of bamboo shoots and reduce bitterness respectively (Wang et al., 2023).
In order to further understand the influence of microbial communities in suansun on the production of key flavor compounds, a correlation network heatmap was drawn based on the Mantel test correlation test results, showing the correlation between 18 dominant bacterial genera and the content of 27 key flavor compounds (Figure 9E). The correlation analysis showed that a total of 23 key flavor compounds were highly significantly correlated with Weissella (17), Limonolobacillus (1), and Actinmyces (5), with p ≤ 0.001 (Table 3). Weissella and Actinomyces, which are both biomarkers of PWLS, significantly correlated with 22 key flavor compounds, accounting for 95.65%. For values p ≤ 0.01 to p > 0.001, there were five bacterial genera highly correlated with key flavor compounds, namely Actinomyce, Weissella, Enterococcus, Limosilactobacillus, and Paucilactobacillus. In addition to Limonolobacillus, Paucilactobacillus is a key biomarker for PW samples, while the remaining three belong to the PWLS treatment group. For values p < 0.05 to p > 0.01, there were five bacterial genera significantly associated with key flavor compounds, namely Comamonas, Enterococcus, Weissella, Actinomyce, and Furfurilactobacillus, all key microbial markers from PWLS. In addition, this study also found a positive correlation between the absolute dominant bacterial genus Weissella and p-cresol (r = 0.32, p = 0.018). Sun et al. also found that Weissella and Lactococcus were substantially linked to flavoring substances such hexanol, acetic acid, and p-cresol (Sun et al., 2023). Weissella is not only the dominant bacterium in the fermentation of suansun, but may also be the main genus of bacteria that produces key flavors in suansun. On the contrary, Lactiplantibacillus, which has the highest average relative abundance, has no statistically significant correlation with the 27 key flavor compounds, which may be one of the drawbacks of direct inoculation of a single strain. According to reports, the sensory quality of fermented foods, which are often treated with microorganisms, is altered by changes in the microenvironment (Liu et al., 2021). Additionally, scientists found that using several strains for synergistic fermentation results in a more robust flavor profile in addition to improving the fermentation process’ safety (Huang et al., 2021; Luo et al., 2020).
In summary, PWLS treatment is the most optimal of the three fermentation methods. Direct fermentation of plant lactobacilli can play an important role in accelerating the maturation of suansun, which may be beneficial for commercial production. In subsequent direct fermentation studies, inoculation with composite lactic acid bacteria may be a better exploration model for achieving commercial production.
Conclusion
4
Using SBSE-GC-MS combined with electronic nose technology, a comparative analysis was conducted on 54 aroma components of suansun prepared by natural fermentation and direct fermentation. The results showed significant differences in the types and amounts of aroma components among the three types of suansun, and exhibited distinct fermentation mode characteristics. A total of 114 common aroma compounds were isolated and identified, including 31 esters, 16 alcohols, 16 hydrocarbons, 16 ketones, 9 acids, 7 aldehydes, 6 heterocyclic compounds, 4 phenols, 4 halogenated hydrocarbons, 3 amides, and 2 others. Esters, alcohols, and phenols contribute more to flavor formation in natural fermentation, while esters, aldehydes, ketones, and amides in direct-pitch fermentation. Based on the p-value and VIP value, 27 characteristic flavor compounds related to the aroma quality of suansun were further screened. Based on PCA analysis of 27 characteristic aroma compounds, the cumulative variance contribution rate of the first two PCs reached 90%. Based on the SVM model constructed by the first two PCs, a discriminant analysis was conducted on the fermentation method of suansun. The samples were randomly divided into a training set (70%) and a testing set (30%), with a discrimination rate of 100%. This indicates that the model is reliable and provides new ideas for the selection of fermentation methods for suansun.
The SBSE-GC-MS detection results showed that the main flavor compound categories increased nearly exponentially from natural fermentation day 14, reaching their peak at the fermentation 32 day, which is consistent with the changes in the electronic nose. The 27 key flavor compounds showed the most significant response under PWLS treatment, with p-cresol content increasing the most during the entire fermentation process, reaching over 600 times. The changes in colony structure during the fermentation process of bamboo shoots were analyzed using 16sRNA, and the results showed that the main dominant bacterial genus for the three fermentation methods were Lactiplantibacillus, Lactococcus, Weissella, and Limosilactobacillus. The abundance of the absolute dominant bacterial genus Lactiplantibacillus during direct fermentation rapidly increased on the 2nd day, reached a peak on fermentation day 14, significantly higher than with natural fermentation, then gradually decreased, reaching its lowest point on fermentation day 32. This indicates that direct fermentation of plant lactobacilli can play an important role in accelerating the maturation of bamboo shoots. However, among the 23 matched pairs where the dominant bacterial genera of the three fermentation methods were significantly positively correlated with key flavor compounds, PWLS accounted for 95.65%, of which 17 key characteristic flavor compounds were significantly positively correlated with Weissella. Weissella is not only the dominant bacterium in the fermentation of bamboo shoots, but also the main genus of bacteria that produces key flavors in bamboo shoots. There is no statistically significant correlation between Lactiplantibacillus and the 27 key flavor compounds. Therefore, using direct injection and inoculating with composite lactic acid bacteria may be an optimal model for achieving commercial production.
The reference list from the paper itself. Each links out to its DOI / PubMed record.
- 1Botthoulath V.Dalmacio I. F.Elegado F. B. (2024). Physico-chemical and functional properties of the lao fermented bamboo shoots (Nor Mai Som) inoculated with potential probiotic bacteria, Pediococcus pentosaceus BBS 1 and Lactiplantibacillus plantarum BBS 13. Food Chem. Adv. 5:100803. doi: 10.1016/j.focha.2024.100803 · doi ↗
- 2Cai W.Tang F.Zhao X.Guo Z.Zhang Z.Dong Y.. (2019). Different lactic acid bacteria strains affecting the flavor profile of fermented jujube juice. J. Food Process. Preserv. 43:e 14095. doi: 10.1111/jfpp.14095 · doi ↗
- 3Chen C.Cheng G.Liu Y.Yi Y.Chen D.Zhang L.. (2022). Correlation between microorganisms and flavor of Chinese fermented sour bamboo shoot: roles of Lactococcus and Lactobacillus in flavor formation. Food Biosci. 50:101994. doi: 10.1016/j.fbio.2022.101994 · doi ↗
- 4Chen C.Li J.Cheng G.Liu Y.Yi Y.Chen D.. (2023). Flavor changes and microbial evolution in fermentation liquid of sour bamboo shoots. J. Food Compos. Anal. 120:105273. doi: 10.1016/j.jfca.2023.105273 · doi ↗
- 5Choudhury D.Sahu J. K.Sharma G. D. (2012). Value addition to bamboo shoots: a review. J. Food Sci. Technol. 49, 407–414. doi: 10.1007/s 13197-011-0379-z, PMID: 23904649 PMC 3550903 · doi ↗ · pubmed ↗
- 6Darmayanti L. P. T.Duwipayana A. A.Putra I. N. K.Antara N. S. (2014). Preliminary study of fermented pickle of Tabah bamboo shoot (Gigantochloa nigrociliata (Buese) Kurz). Int. J. Biol. Vet. Agric. Food Eng. 8, 999–1004.
- 7Das R.Tamang B.Najar I. N.Thakur N.Mondal K. (2023). First report on metagenomics and their predictive functional analysis of fermented bamboo shoot food of Tripura, North East India. Front. Microbiol. 14:1158411. doi: 10.3389/fmicb.2023.1158411, PMID: 37125168 PMC 10130461 · doi ↗ · pubmed ↗
- 8Guan Q. (2023). Microbial community flora in Chinese traditional suansun and its influence on the formation of characteristic flavors. Nanchang: Nanchang University.