MEAanalysis: an open-source R package for downstream visualization of AxIS navigator multi-electrode array burst data at the single-electrode level
Emily A Gordon, David L Bennett, Georgios Baskozos, Maddalena Comini

TL;DR
MEAanalysis is an open-source R package that helps visualize MEA data at the single-electrode level, improving understanding of cell network activity.
Contribution
It introduces single-electrode-level visualization of burst data after AxIS Navigator processing.
Findings
The package enables detailed spatiotemporal analysis of excitable cell networks.
It improves reproducibility and understanding of MEA data.
User feedback will guide future development.
Abstract
Multi-electrode array (MEA) generate electrophysiological data that can be used to functionally characterize excitable cells. MEA data can be complex to analyse in a reproducible manner, with current data analysis tools often calculating parameters at the whole-well level. Here we present MEAanalysis, an open-source R package [GPL (≥2)] able to visualize burst parameters at the single electrode level downstream of AxIS Navigator software (Axion BioSystems) processing, thus increasing our understanding of an excitable cell network’s spatiotemporal variability. The package is hosted on and can be installed from the following GitHub repository: https://github.com/egordon2/MEA-analysis-package. User feedback provided via email or the GitHub issues tab will inform cycles of development.
Genes, proteins, chemicals, diseases, species, mutations and cell lines named across the full text — each resolved to its canonical identifier and authoritative record.
Click any figure to enlarge with its caption.
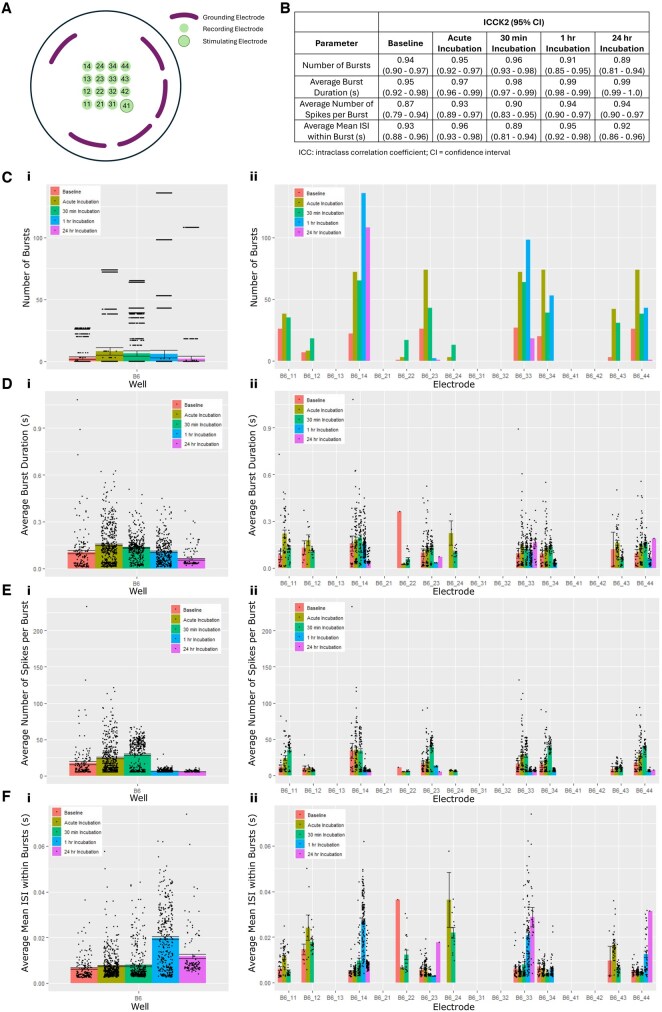 Figure 1
| Tool | Summary | Burst analysis | Data visualization | Time window comparison |
|---|---|---|---|---|
| MEAanalysis | R package to calculate and visualize burst parameters downstream of MEA data processing by AxIS Navigator. | Burst parameter calculation, automatic data export and visualization at both whole-well and single-electrode level. | Workflows available to visualize burst parameters in bar chart format at both the single-electrode and whole-well levels. | Functions contain argument to filter by time window for burst analysis. Workflows enable bar chart visualization by time window for easy comparison of results. |
| MultiElec | MATLAB-based tool. Determine activation-time and calculate local conduction velocities for MEA recordings. | Out of scope. | GUI. Activation time heatmaps, conduction velocity vector maps. | Able to specify analysis time window using GUI. |
| MEA Viewer | Application for MEA data visualization. | Out of scope. | Spike timestamp superimposed on extracellular potentials, interactive raster plot. | Time window for visualization can be specified by the user. |
| MEA Tools | MATLAB-based software for analysis of MEA recordings, extracellular spikes, and local field potentials | Out of scope. | GUI. Spike and LFP visualization. | Limit analysis to specific time window using data range limit. |
| meaRtools | R package to enable spike train and statistical analysis, as well as visualization of MEA of MEA recordings. | Burst parameter calculation at both whole-well and single-electrode level. | Burst parameters displayed in histogram format enabling easy comparison of experimental conditions. | User-defined time window. |
| MEAnalyzer | Spike train analysis software for statistical, periodicity, and functional connectivity analysis of MEA data. | Burst parameter calculation at network level. | GUI. Range of visualizations including raster plots and connectivity graphs. | User-defined time segment. |
| MEA-ToolBox | MATLAB-based tool for MEA data processing, spike detection, burst and connectivity analysis. | Burst parameter calculation at both whole-well and single-electrode level. | Range of visualizations including connectivity maps and raster plots. Single channel burst visualization available with statistics in report format. | User able to set interval for spike detection. |
| Axon Biosystems Software | AxIS Navigator: MEA data acquisition and analysis (spike and burst detection). Neural Metric Tool: utilizes .spk files from AxIS Navigator to calculate burst and synchrony metrics. | Burst parameter calculation at both whole-well and single-electrode level. | GUI. Bursting visualizations available but none at single electrode level, requires manual extraction of information from CSV file. | Set specific time window for analysis using neural metric tool. Results exported as separate CSV files for each time window requiring manual extraction for comparison. |
| Electrode | Number of bursts | Average burst duration (S) | Average number of spikes per burst | Mean burst ISI (S) | ||||
|---|---|---|---|---|---|---|---|---|
| MEA analysis | Axion | MEA analysis | Axion | MEA analysis | Axion | MEA analysis | Axion | |
| B6_11 | 141 | 141 | 0.154547 | 0.154627 | 26.049645 | 26.049645 | 0.007170579 | 0.007177 |
| B6_12 | 70 | 70 | 0.1212651 | 0.121345 | 11.2 | 11.2 | 0.012609743 | 0.012619 |
| B6_13 | 1 | 1 | 0.09216 | 0.09224 | 17 | 17 | 0.00576 | 0.005765 |
| B6_14 | 189 | 189 | 0.1930743 | 0.193154 | 41.910053 | 41.910053 | 0.004879648 | 0.004884 |
| B6_21 | 1 | 1 | 0.08424 | 0.08432 | 22 | 22 | 0.004011429 | 0.004015 |
| B6_22 | 46 | 46 | 0.1168209 | 0.116901 | 7.173913 | 7.173913 | 0.018208933 | 0.018223 |
| B6_23 | 181 | 181 | 0.1468888 | 0.147533 | 26.524862 | 26.541436 | 0.006349683 | 0.00637 |
| B6_24 | 17 | 17 | 0.1649647 | 0.165045 | 7.529412 | 7.529412 | 0.028800437 | 0.028814 |
| B6_31 | 1 | 1 | 0.08328 | 0.08336 | 22 | 22 | 0.003965714 | 0.00397 |
| B6_32 | 1 | 1 | 0.11192 | 0.112 | 24 | 24 | 0.004866087 | 0.00487 |
| B6_33 | 201 | 201 | 0.1455781 | 0.145659 | 30.427861 | 30.427861 | 0.005327455 | 0.005334 |
| B6_34 | 185 | 185 | 0.1440069 | 0.144087 | 26.313514 | 26.313514 | 0.006119163 | 0.006126 |
| B6_41 | 1 | 1 | 0.1028 | 0.10288 | 19 | 19 | 0.005711111 | 0.005716 |
| B6_42 | 4 | 4 | 0.09752 | 0.0976 | 9.75 | 9.75 | 0.018117636 | 0.018133 |
| B6_43 | 87 | 87 | 0.1481968 | 0.148277 | 11.298851 | 11.298851 | 0.014456641 | 0.014467 |
| B6_44 | 211 | 211 | 0.1491685 | 0.149249 | 29.753555 | 29.753555 | 0.005202875 | 0.005208 |
Peer Reviews
No public reviews on file for this paper yet. If you reviewed it on a platform where reviews are public (OpenReview, ICLR, NeurIPS, ICML), you can paste yours below so the community can read it here.
Videos
No videos yet. Explain this paper in a talk, walkthrough, or lecture? Add one.
Taxonomy
TopicsElectrochemical Analysis and Applications · Analytical Chemistry and Sensors · Neural dynamics and brain function
1 Introduction
Multi-electrode array (MEA) generate high-throughput electrophysiological data relating to an excitable cell network’s spatiotemporal activity (McCready et al. 2022). MEA consists of microelectrodes embedded within a specialized tissue culture plate, which detect extracellular potentials referred to as ‘spikes’ (Johnstone et al. 2010). ‘Bursts’ describe multiple spikes occurring within a short time period (Johnstone et al. 2010). Burst and spike parameters, including mean firing rate (MFR), number of spikes per burst, and burst duration, can represent a cellular network’s functional phenotype in vitro.
MEA’s ability to characterize excitable cells functionally makes it a useful model for disease and drug toxicity assessment. For example, human induced-pluripotent stem cell (hiPSC) derived sensory neurons cultured within MEAs have increased our understanding of electrophysiological mechanisms underlying neurological diseases such as autism, amyotrophic lateral sclerosis, and pain disorders (Wainger et al. 2014, Deneault et al. 2019, Mossink et al. 2021, Lv et al. 2023). MEA models assessing the seizurogenic and nociceptive potential of compounds offer an in vitro alternative to in vivo drug screening (Bradley et al. 2018, Ojima and Miyamoto 2018, Tukker et al. 2018, Tukker et al. 2020, Eaton et al. 2021). MEA data therefore provide insights into neurological disease mechanisms and drug-induced changes in cell excitability.
Despite MEA’s advantages, the data produced can be complex to analyse reproducibly (Mahmud and Vassanelli 2019). Data analysis tools have been developed to address these issues (Table 1). Open-source applications such as MultiElec, MEA Viewer, and MEA tools, calculate activation-time parameters, visualize extracellular potentials, and analyse local field potentials, respectively (Egert et al. 2002, Georgiadis et al. 2015, Bridges et al. 2018). Additionally, meaRtools and MEAnalyzer can conduct spike train analyses (Gelfman et al. 2018, Dastgheyb et al. 2020). These software greatly aid MEA data analysis for their specified purposes.
On a broader scale, a multiparametric approach is recommended to phenotype cellular networks holistically (McCready et al. 2022). Through calculation of burst parameters, MEA-ToolBox (Hu et al. 2022) and Axion Software (Axion BioSystems) provide a comprehensive understanding of network activity. These software can calculate parameters at the single-electrode level, increasing our ability to understand spatiotemporal variability in a network’s cell excitability. However, presentation of this information in a report format means that manual time-consuming data extraction is often required to compare time periods.
MEAanalysis is an open-source R package which can extract and visualize burst parameters at the single electrode level, utilizing electrode burst list comma-separated values (csv) files produced by AxIS Navigator software (Axion BioSystems). In contrast to existing tools, specification of MEA recording time periods in the MEAanalysis function arguments enables easy comparison between individual electrodes and experimental conditions, without the need for manual data extraction, offering a quick and convenient readout in a user-friendly bar chart format. Burst parameters included are the number of bursts, average mean inter-spike interval (ISI) within a burst, average burst duration, and average number of spikes per burst. This offers additional functionality and complementary information to whole-well network burst parameters. MEAanalysis is hosted at: https://github.com/egordon2/MEA-analysis-package. Example workflows on using MEAanalysis to read and analyse other datasets are available at: https://egordon2.github.io/MEA-analysis-package/.
As a proof-of-concept, we utilized MEAanalysis package functions to visualize AxIS Navigator electrode burst files obtained from MEA recordings of hippocampal neuron cultures at the single-electrode level.
2 Methods
2.1 Hippocampal neuron culture
Schedule 1 (overdose of anaesthetic) of wild-type male and female mice was performed between postnatal days 0 and 3 in accordance with UK home office regulations. As previously described, hippocampi were isolated and placed in ice-cold HBSS (Beaudoin et al. 2012, Moutin et al. 2020). Hippocampi were then transferred to a solution containing Glutamax-supplemented DMEM, L-cysteine (1.6 mM), CaCl2 (1 mM), and EDTA (0.5 mM), before being digested enzymatically through a 20-min incubation (37°C, 5% CO_2_) with fresh papain (10–13 units). Hippocampi were then transferred to a solution containing Glutamax-supplemented DMEM, heat-inactivated Foetal Bovine Serum (10%), Bovin Serum Albumin (2.5%), and Trypsin inhibitor (2.5%), and incubated for 5 min at 37°C (5% CO_2_). Hippocampal tissue was then mechanically triturated and centrifuged. The supernatant was diluted in a plating medium consisting of Neurobasal medium, B27, Glutamax, and penicillin/streptomycin. PDL-coated 24-well MEA plates (Cytoview MEA 24, Axion Biosystems, 16 electrodes per well) were seeded with 40–50K cells per well. Following a 2-h incubation (37°C, 5% CO_2_), cells were flooded with plating medium. Half medium was replaced every 3 days. Hippocampal neurons were maintained in culture for the experiment duration.
2.2 MEA recordings
MEA recordings were conducted on mature hippocampal neurons cultured in a 24-well MEA plate at 22 days in vitro (DIV) and measured using the Axion Maestro Edge multi-well plate recording platform (Axion BioSystems). To assess changes in neuronal electrical properties in response to incubation with 10 mM KCl, extracellular action potentials were acquired continuously (37°C, 5% CO_2_), sampled at 12.5 kHz per electrode, and digitally filtered using a Butterworth low pass filter at 3 kHz and high pass filter at 200 Hz.
2.3 Data processing
MEA recordings were processed using AxIS Navigator 3.6.2 software (Axion BioSystems). The adaptive threshold for spike detection was set at 6x standard deviation. Single electrode bursts were defined as having a minimum of 5 spikes with a maximum ISI of 100 mS. Electrode burst list csv files were exported from the AxIS Navigator burst detector and used as input for MEAanalysis package functions to calculate burst parameters for specific time intervals (https://github.com/egordon2/hippocampal_data_analysis/blob/main/hippocampal_data_processing.R). Burst parameters were then visualized at the whole well and single electrode for a representative well (https://github.com/egordon2/hippocampal_data_analysis/blob/main/hippocampal_analysis_script.R).
2.4 Software implementation
MEAanalysis was created using RStudio version 4.3.3. The package has been published on the Comprehensive R Archive Network. It can be installed from the following GitHub repository: https://github.com/egordon2/MEA-analysis-package. MEAanalysis contains functions which calculate the number of bursts, average mean ISI within a burst, average burst duration, and average number of spikes per burst, detected by individual electrodes within a given time period, downstream of AxIS Navigator processing. These burst parameters align with the descriptions provided in the Axis Navigator User Guide (Axion Biosystems). MEAanalysis will be maintained for the foreseeable future. User feedback provided via email or the GitHub issues tab (https://github.com/egordon2/MEA-analysis-package/issues), regarding possible bugs or conflicts, will inform cycles of development; updates will be completed on the MEAanalysis_development branch before being merged into the main.
Example workflows and instructions on how a user may apply MEAanalysis to read and analyse other datasets are available at: https://egordon2.github.io/MEA-analysis-package/.
As a proof-of-concept, functions from the MEAanalysis package were applied to AxIS Navigator electrode burst files from hippocampal neuron MEA recordings using the following code: https://github.com/egordon2/hippocampal_data_analysis.
3 Results
MEA recordings were conducted to assess KCl’s impact on hippocampal neuron electrical properties. MEAanalysis facilitated examination of these effects at the single-electrode level, through analysing the associated electrode burst list files generated by AxIS Navigator. With this tool, we efficiently extracted and directly plotted single-electrode data for easy visualization (https://github.com/egordon2/hippocampal_data_analysis/blob/main/hippocampal_analysis_script.R). Figure 1 illustrates a representative analysis of one well over time, comparing both whole-well and single-electrode burst parameters. This demonstrates the identification of well network variability using MEAanalysis, which was also observed in analysis of other wells (https://github.com/egordon2/hippocampal_data_analysis/blob/main/supplementary_analysis_script.R). Notation used to describe individual electrodes refers to their well position, e.g. electrode B6_24 is in column 2 row 4 of well B6 (see Fig. 1A for visual representation).
MEAanalysis package example outputs. Continuous MEA recordings were conducted on hippocampal neurons in response to 10 mM KCl incubation. Associated electrode burst datasets were produced by AxIS Navigator software and analysed using the MEAanalysis R studio package. Burst parameters were calculated for 2-min time windows at the indicated time points. (A) Schematic illustration of an Axion Biosystems CytoView M384-tMEA-24W MEA plate electrode arrangement within a well (Axion Biosystems). As per the associated datasheet, electrodes have a diameter of 50 µm and are spaced 350 µm apart. (B) Average raters intraclass correlation coefficient (ICC2k) calculated between single-electrode mean results. (C) Average number of bursts detected (i) within an MEA well and (ii) by single electrodes. (D) Average burst duration (sec) detected (i) within an MEA well and (ii) by single electrodes. (E) Average number of spikes per burst detected (i) within an MEA well and (ii) by single electrodes. (F) Average mean burst inter-spike interval (ISI) detected (i) within an MEA well and (ii) by single electrodes. Error bars represent ±SEM.
To validate the tool’s accuracy, single electrode burst parameters calculated using MEAanalysis functions (https://github.com/egordon2/hippocampal_data_analysis/blob/main/MEAanalysis_validation_script.R) were compared to those manually extracted from the associated AxIS navigator advanced metrics file for a whole baseline hippocampal neuron recording (Table 2). These results matched to at least 3 decimal places for all parameters, with variation likely due to software rounding differences.
Single-electrode analysis enabled the investigation of systematic bias relating to electrode location within an MEA well. As demonstrated in Fig. 1, electrodes near stimulating and grounding electrodes did not detect above threshold bursts (electrodes B6_32, B6_42, B6_21, B6_31, and B6_41). In contrast, electrodes B6_14, B6_23, B6_33, and B6_44, located further from the stimulating and grounding electrodes, detected bursts in all time periods analysed. This trend was not observed in other wells, suggesting this bias may be a result of an uneven cell distribution in this well as opposed to a systematic effect of well/electrode design.
Additionally, the average raters intraclass correlation coefficient (ICC2k) was calculated for each burst parameter at each KCl (10 mM) incubation time period. Consistency between single-electrode mean results were analysed to decipher well variability (Fig. 1B). The high ICC2k values demonstrate single-electrode consistency within a well, suggesting the well average reliably portrays network activity. Single-electrode analysis using the MEAanalysis package will therefore serve as a complementary approach to whole-well analyses, providing additional insights to network variability.
KCl incubation transiently increased the average number of bursts detected by electrodes within a representative well (Fig. 1. Ci). This parameter peaked 2 min post-KCl addition (acute response) before gradually declining following 30 min, 1 h, and 24 h incubation. This trend was reflected in 5/16 electrodes (Fig. 1. Cii; electrodes: B6_11, B6_23, B6_34, B6_43, B6_44). In contrast, electrodes B6_14 and B6_33 detected the highest number of bursts following 1-h KCl incubation (Fig. 1. Cii). These single-electrode level results indicate spatial variability in KCl’s temporal effects on network bursting behaviour which could not be detected at the whole-well level.
The average burst duration for an MEA well increased transiently during acute KCl incubation before gradually decreasing to below baseline following 24 h incubation (Fig. 1. Di). Similarly, single-electrode analysis revealed transient increases in burst duration during acute KCl incubation for electrodes B6_11, B6_12, B6_24, and B6_43 (Fig. 1. Dii). The highest burst duration was detected after 30 min KCl incubation for electrodes B6_14 and B6_34, and after 24 h for electrode B6_33 (Fig. 1. Dii), again highlighting variability in hippocampal neuronal network electrical properties.
KCl incubation transiently increased the average number of spikes per burst at the whole-well level; this parameter peaked at 30 min KCl incubation then declined to below baseline at 1- and 24-h incubation (Fig. 1. Ei). This trend was observed in 7/10 active electrodes in the representative well (Fig. 1. Dii; electrodes: B6_11, B6_14, B6_23, B6_33, B6_34, B6_43, B6_44). These results demonstrate coherence between single-electrode and whole-well MEA analyses for this network excitability metric.
At the whole-well level, KCl incubation transiently increased average mean burst ISI (Fig. 1. Fi). The peak average mean burst ISI occurred 1-h post-KCl addition and declined by 24-h. This trend was only observed for electrode B6_14 in the single-electrode analysis (Fig. 1. Fii). In contrast, for 4/10 active electrodes the highest average mean burst ISI occurred following acute KCl incubation (Fig. 1. Fii; electrodes B6_11, B6_12, B6_24, B6_43). These results highlight variability within the neuronal network’s electrical properties which could be detected by single-electrode but not by whole-well analysis, demonstrating the increased granularity of MEAanalysis.
4 Discussion
Here, we present MEAanalysis, an open-source R package to visualize burst parameters at the single-electrode level for a given time period, downstream of AxIS Navigator processing. Application of MEAanalysis to hippocampal neuron electrode burst files highlights its ability to reveal electrical properties variability within neuronal networks that might be overlooked in whole-well analyses or identify effects previously masked by whole-well summarization. The increased granularity of the MEAanalysis provides complementary information to whole-well network burst parameters, which can further inform conclusions drawn from MEA data.
Furthermore, MEAanalysis can be used to determine the homogeneity of neuronal network electrical properties throughout an MEA well. An even cell distribution results in more robust synchronous burst detection by individual MEA electrodes compared with an uneven distribution (Mossink et al. 2021). Single-electrode analysis using the MEAanalysis package can provide an important insight into the spatial network activity variability, indicative of homogenous cellular distribution. This tool can therefore help assess the comparability of neuronal network data acquired through MEA, especially when working with multiple cell lines, as is common with hiPSC cells. This approach ultimately proves advantageous when comparing primary cultures, where achieving a homogeneous cell distribution can be difficult to evaluate through visual inspection alone.
5 Future developments
The MEAanalysis package currently contains functions to calculate the number of bursts, average mean ISI within a burst, average burst duration, and average number of spikes per burst, detected by individual electrodes within a given time period. The scope of this tool could be expanded to calculate additional burst and spike parameters, such as number of spikes and weighted MFR, to provide further insights into network functionality. Implementation of single-electrode statistical analysis would also improve the tool’s utility. The MEAanalysis functions were developed using csv files produced by the Axion Maestro Edge multi-well plate recording platform. Therefore a limitation of the package is that it is only compatible with CSV/XLS exported from AxIS navigator. It would be beneficial to improve this code’s generalizability so that it is compatible with other MEA data acquisition systems. Analysing data with the MEAanalysis functions currently requires basic R Studio programming knowledge. Development of an R Shiny or graphical user interface (GUI) will further improve accessibility of this resource for non-experienced coders.
Author Contributions
Emily A. Gordon (Formal analysis, Software, Writing—original draft, Visualizsation), David L. Bennett (Conceptualizsation, Funding aquisition, Resources, Supervision, Writing—review & editing), Georgios Baskozos (Software, Supervision, Writing—review & editing), and Maddalena Comini (Conceptionalizsation, Resources, Supervision, Writing— review & editing)
The reference list from the paper itself. Each links out to its DOI / PubMed record.
- 1Beaudoin GMJ , Lee S-H, Singh D 3rd et al Culturing pyramidal neurons from the early postnatal mouse hippocampus and cortex. Nat Protoc 2012;7:1741–54.22936216 10.1038/nprot.2012.099 · doi ↗ · pubmed ↗
- 2Bradley JA , Luithardt HH, Metea MR et al In vitro screening for seizure liability using microelectrode array technology. Toxicol Sci 2018;163:240–53.29432603 10.1093/toxsci/kfy 029 · doi ↗ · pubmed ↗
- 3Bridges DC , Tovar KR, Wu B et al MEA viewer: a high-performance interactive application for visualizing electrophysiological data. P Lo S One 2018;13:e 0192477.29425223 10.1371/journal.pone.0192477 PMC 5806868 · doi ↗ · pubmed ↗
- 4Dastgheyb RM , Yoo SW, Haughey NJ. ME Analyzer—a spike train analysis tool for multi electrode arrays. Neuroinformatics 2020;18:163–79.31273627 10.1007/s 12021-019-09431-0 · doi ↗ · pubmed ↗
- 5Deneault E , Faheem M, White SH et al CNTN 5-/+or EHMT 2-/+human i PSC-derived neurons from individuals with autism develop hyperactive neuronal networks. e Life 2019;8:e 40092.30747104 10.7554/e Life.40092 PMC 6372285 · doi ↗ · pubmed ↗
- 6Eaton M , Que Z, Zhang J et al Multi-Electrode array of sensory neurons as an in vitro platform to identify the nociceptive response to pharmaceutical buffer systems of injectable biologics. Pharm Res 2021;38:1179–86.34244893 10.1007/s 11095-021-03075-z · doi ↗ · pubmed ↗
- 7Egert U , Knott T, Schwarz C et al MEA-Tools: an open source toolbox for the analysis of multi-electrode data with MATLAB. J Neurosci Methods 2002;117:33–42.12084562 10.1016/s 0165-0270(02)00045-6 · doi ↗ · pubmed ↗
- 8Gelfman S , Wang Q, Lu Y-F et al mea Rtools: an R package for the analysis of neuronal networks recorded on microelectrode arrays. P Lo S Comput Biol 2018;14:e 1006506.30273353 10.1371/journal.pcbi.1006506 PMC 6181426 · doi ↗ · pubmed ↗