Comparison of postoperative outcomes following endoscopic third ventriculostomy or shunt in a propensity score matched pediatric cohort
Paulo Castro, Loren Berman, Joseph Piatt

TL;DR
This study compares outcomes of two hydrocephalus treatments in children and finds that younger patients have more complications with one procedure.
Contribution
The study provides age-specific insights into postoperative outcomes of ETV versus shunt surgery in pediatric hydrocephalus patients.
Findings
ETV in infants ≤6 months had higher rates of seizures, readmission, and reintervention compared to shunts.
ETV in older children (≥2 years) showed shorter hospital stays and lower mortality than shunts.
Short-term outcomes suggest ETV may be less favorable for younger patients despite long-term benefits.
Abstract
Thirty-day readmission and reoperation are widely used quality metrics. Endoscopic third ventriculostomy (ETV) is favored when feasible, but may compare unfavorably with shunt in the short-term. This study analyzes 30-day outcomes of ETV and shunt surgery in comparable populations. Data regarding patients undergoing ETV or initial shunt insertion were extracted from the National Surgical Quality Improvement Program – Pediatric for 2013–2020. Patients were stratified into three age groups: ≤ 6 months (N = 5,906), 6 months-2 years (N = 2,364), and ≥ 2 years (N = 4,408). Characteristics were compared before and after propensity-score matching. Outcome comparisons included CNS complications, mortality, readmission, and reinterventions. There were 10,135 shunt insertions and 2,543 ETVs. After matching, patients ≤ 6 months undergoing ETV had more seizures (ETV 6.3% vs shunt 0.4%, p <…
Genes, proteins, chemicals, diseases, species, mutations and cell lines named across the full text — each resolved to its canonical identifier and authoritative record.
Click any figure to enlarge with its caption.
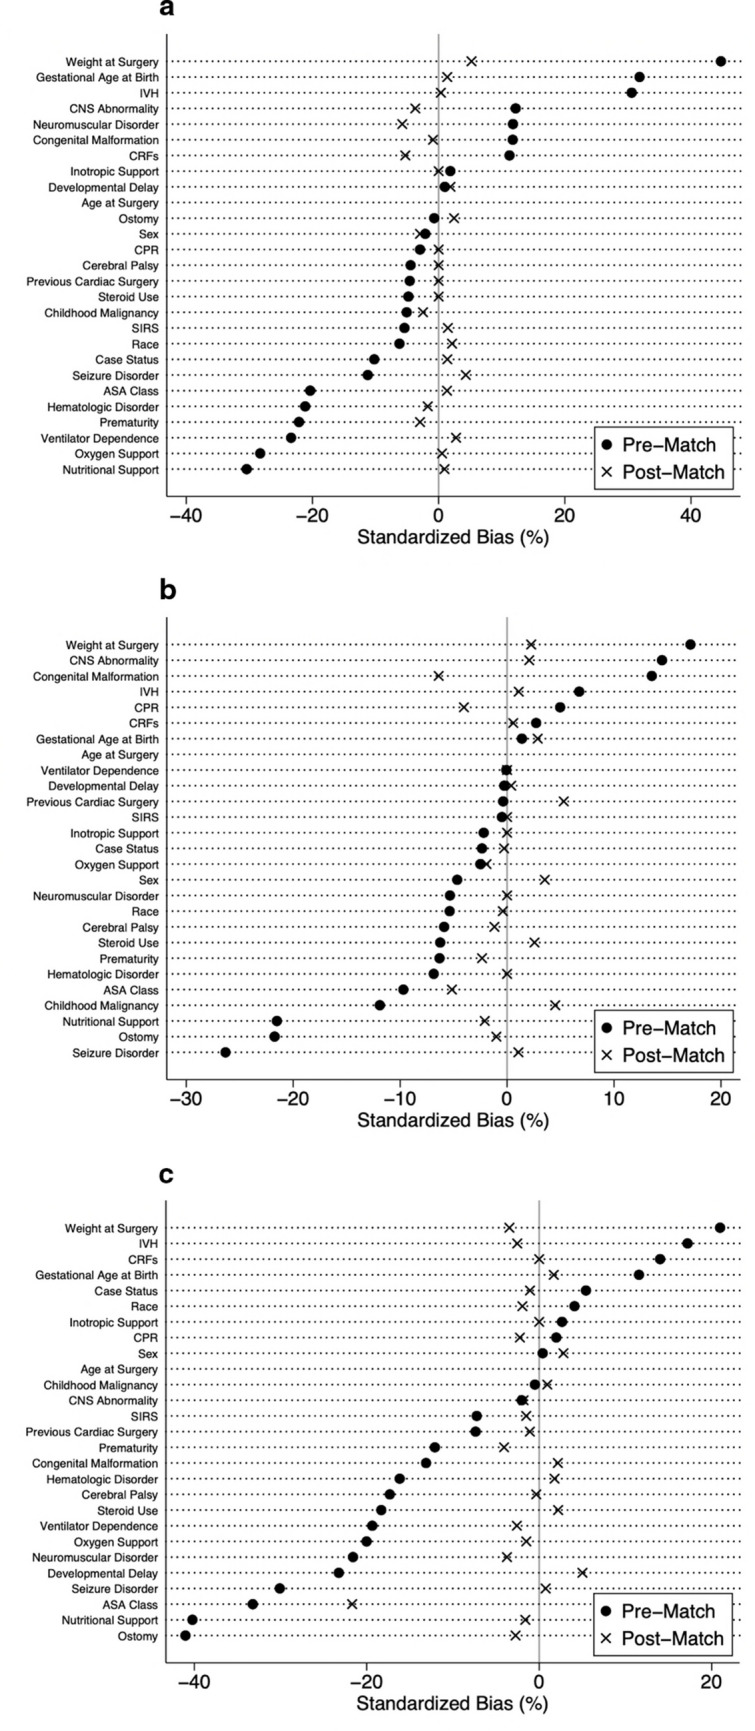 Figure 1
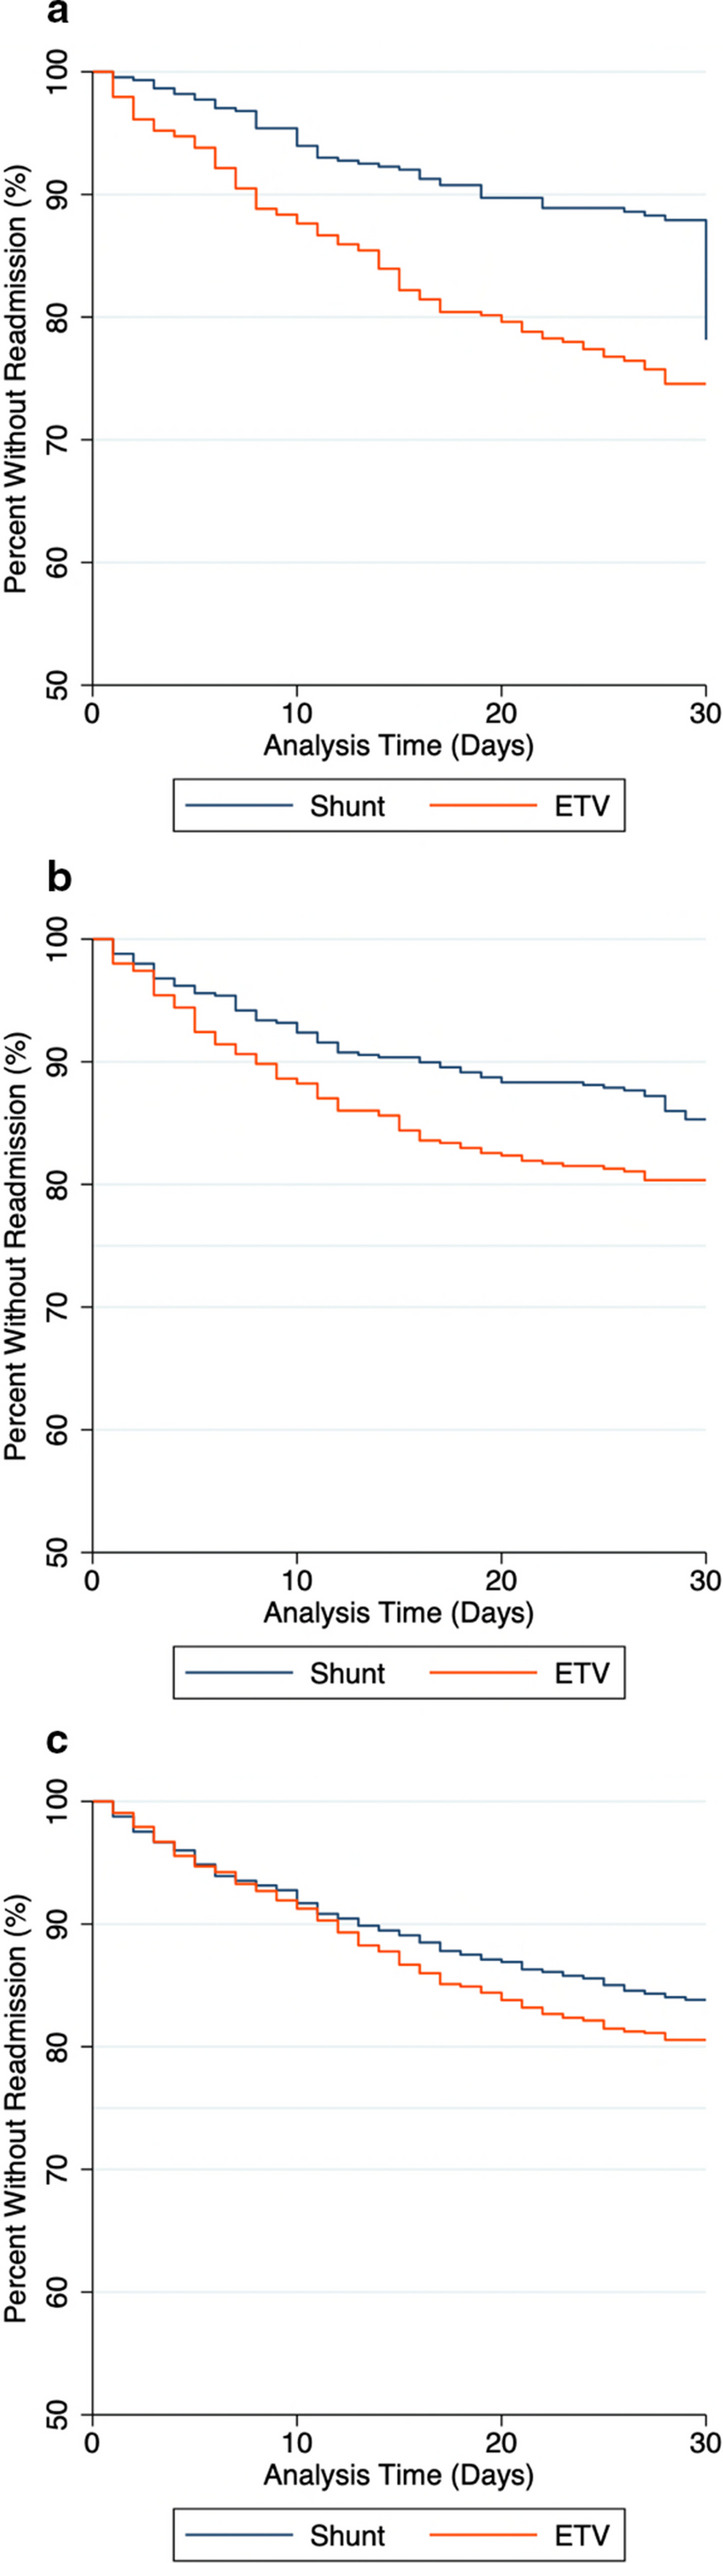 Figure 2
Peer Reviews
No public reviews on file for this paper yet. If you reviewed it on a platform where reviews are public (OpenReview, ICLR, NeurIPS, ICML), you can paste yours below so the community can read it here.
Videos
No videos yet. Explain this paper in a talk, walkthrough, or lecture? Add one.
Taxonomy
TopicsCerebrospinal fluid and hydrocephalus · Spinal Dysraphism and Malformations · Fetal and Pediatric Neurological Disorders
Introduction
Hydrocephalus is the most common condition requiring intervention in pediatric neurosurgery. In contemporary practice, there are only two treatment options: shunt insertion or endoscopic third ventriculostomy (ETV). Current neurosurgical practice favors ETV whenever it is feasible as this intervention avoids the issues associated with shunt dependence in the long-term; however, like shunts, ETV may fail and require reintervention in the short-term [1–24]. The relative benefit of each procedure for overall quality of life is still not clear [1–10]. A recent study of 30-day outcomes of more than 29,000 procedures found that, relative to new shunt placement, ETV led to significantly higher rates of unplanned return to the operating room [25]. This observation suggests that the decision to pursue the long-term benefits of ETV may be penalized by greater risk of short-term complications, but there were significant baseline differences in the shunt and ETV groups that might have driven the differences in outcomes. There are currently no reports in the literature comparing short-term outcomes for cases in which equipoise exists, that is, treatment by either procedure is clinically suitable. Success rates of ETV depend on many clinical factors, including patient age, etiology of hydrocephalus, and imaging findings [23]. In practice, ETV is the clear standard of care for some cases, while for others it may be relatively contraindicated. We hypothesized that, when there is a reasonable clinical choice between ETV and shunt insertion, pursuit of the long-term benefits of successful ETV may incur a cost of more frequent short-term complications. The current study refines the comparison of 30-day outcomes following ETV and shunt insertion in a large propensity score matched pediatric cohort.
Methods
Data and study population
We performed a retrospective review of the American College of Surgeons National Surgical Quality Improvement Program-Pediatric (NSQIP-P) database from 2013–2020. The NSQIP-P database includes children undergoing surgery up to age 18 in over 130 North American hospitals. The unit of observation is the index surgical procedure. (Clinical events prior to the index procedure are not captured.) The registry records patient characteristics, comorbidities, preoperative and intraoperative details, and 30-day postoperative outcomes including mortality. Readmissions with 30 days of the index procedure are identified as related or unrelated. Data are extracted from the clinical record by trained surgical clinical reviewers at each site using uniform definitions of conditions and outcomes. The data are deidentified with respect both to the patient and the institution.
The Nemours Institutional Review Board judged this project not to be human subjects research.
We identified all cases of endoscopic third ventriculostomy (ETV) and new shunt insertion during the study period. ETV was identified by Current Procedural Terminology (CPT) codes 62,200 and 62,201. New shunt placement was identified by CPT codes 62,220 and 62,223. Cases were separated into three different age groups: ≤ 6 months, 6 months to 2 years, and ≥ 2 years based on the senior author’s perception of surgical challenges.
Primary characteristics and outcomes
Extracted demographic and clinical data included age in days at the time of surgery, weight at time of surgery, gestational age at birth, history of prematurity (defined as < 37 weeks gestational age at birth), sex, race, and American Society of Anesthesiology (ASA) classification. Race was dichotomized into White and non-White (other and unknown race were included in this category) given the low counts for certain categories within this variable. The comorbidities and pertinent preoperative clinical factors extracted included ventilator dependence, cardiac risk factors (none, minor, major, and severe), intraventricular hemorrhage (IVH), steroid use within 30 days preoperatively, hematologic disorder, history of cardiac surgery, case status (elective, urgent, emergent), oxygen support, developmental delay, seizure disorder, cerebral palsy, structural CNS abnormality, neuromuscular disorder, ostomy, nutritional support, SIRS/sepsis/septic shock within 48 h prior to surgery, inotropic support, history of CPR within 7 days prior to surgery, congenital malformation, childhood malignancy, and blood transfusion within 48 h preoperatively. These variables were collected to evaluate baseline differences between the two groups.
The primary outcomes were the incidence of 30-day reintervention or readmission related to the index procedure. Other outcomes of interest were operative time, length of stay, and postoperative complications such as: surgical site infection (SSI) (superficial, deep, and organ space), wound disruption, sepsis, septic shock, unplanned intubation, mechanical ventilation for > 48 h, pneumonia, blood transfusion volume of 25 mL/kg intra-operatively or in the first 72 h after surgery, acute renal failure, progressive renal insufficiency, cardiac arrest, ventricular tachycardia, coma, stroke, seizure, nerve injury, IVH, urinary tract infection, central line infection, continuing hospitalization at 30 days, and death.
Statistical analysis
All numeric variables were reported as a median with an interquartile range (IQR) and compared using a Mann–Whitney U test. Pearson’s chi-square or Fisher’s exact tests, where appropriate, were used for categorical variables. All statistical tests were 2-sided. A p-value < 0.05 was considered statistically significant. Descriptive and comparative statistics of preoperative variables were performed prior to matching. A logistic regression model was used to calculate propensity scores using all preoperative characteristics available, as listed previously. A propensity score match was then completed between ETV and shunt groups in a 1-to-1 fashion without replacement using the caliper-matching method. The propensity score caliper was determined by multiplying the standard deviation of the logit of propensity scores by 0.2. Within the matched cohort, descriptive and comparative statistics of the preoperative variables and postoperative outcomes were performed between groups. Pre- and post-match standardized percent biases were compared across all covariates. Readmission survival analysis was performed using a log-rank test. Variables with missing data were reported with the true count in parentheses beside the variable name in the data tables. A complete case analysis was performed. This analysis was completed utilizing STATA/SE 15.1 statistical software (StataCorp LLC, College Station, TX).
The STrengthening the Reporting of OBservational studies in Epidemiology (STROBE) checklist was followed.
Results
Study population
Prior to matching, there were a total of 10,135 shunt insertions and 2,543 ETVs performed. In the ≤ 6 months age group, there were 5,906 cases including 5,328 shunts and 578 ETVs. In the 6 months to 2 years age group, there were 2,364 cases including 1,792 shunts and 572 ETVs. In the ≥ 2 years age group, there were 4,408 cases comprised of 3,015 shunts and 1,393 ETVs.
In the ≤ 6 months age group, the ETV patients were older (85 vs 60 days, p < 0.001), heavier (4.8 vs 3.6 kgs, p < 0.001), more likely to be born full term (58.1% vs 47.2%, < 0.001), less likely to be ventilator dependent (6.9% vs 14.0%, p < 0.001), more likely to have no CRFs (65.6% vs 59.6%, p = 0.04), less likely to have a hematologic disorder (12.1% vs 19.8%, p < 0.001), less likely to require oxygen support (13.7% vs 24.7%, p < 0.001), less likely to have a history of seizure (11.6% vs 15.4%, p = 0.01), more likely to have a structural CNS abnormality (92.9%, vs 89.5%, p = 0.01), more likely to have a neuromuscular disorder (8.5% vs 5.5%, p < 0.01), more likely to not have history of IVH (71.5% vs 56.4%, p < 0.001), less likely to require nutritional support (22.3% vs 36.0%, p < 0.001), and more likely to have a congenital malformation (68.9% vs 63.3%, p = 0.01) compared to new shunt patients. Choroid plexus cauterization is often performed in conjunction with ETV in this age group, but in the absence of a specific CPT code confident identification of this procedure was impossible.
In the 6 months to 2 years age group, the ETV patients were older (320 vs 307 days, p = 0.04), heavier (9.2 vs 8.6 kgs, p < 0.0001), less likely to have a history of seizure (11.4% vs 21.0%, p < 0.001), more likely to have a structural CNS abnormality (93.4% vs 89.3%, p = 0.004), less likely to have prior ostomy (14.4% vs 19.7%, p < 0.001), less likely to require nutritional support (12.8% vs 20.8%, p < 0.001), and more likely to have a congenital malformation (65.2% vs 58.6%, p = 0.005) compared to new shunt patients.
In the ≥ 2 years age group, the ETV patients were older (3784 vs 3166 days, p < 0.0001), heavier (37 vs 28 kgs, p < 0.0001), more likely to be born full term (83.6% vs 78.9%, p < 0.001), less likely to be ventilator dependent (1.7% vs 5.1%, p < 0.001), more likely to have no CRFs (94.1% vs 89.4%, p < 0.001), less likely to have needed steroids within 30 days (10.4% vs 16.7%, p < 0.001), less likely to have a hematologic disorder (2.9% vs 6.3%, p < 0.001), less likely to have previous cardiac surgery (2.4% vs 3.7%, p < 0.03), less likely to require oxygen support (1.8% vs 5.5%, p < 0.001), less likely to have developmental delay (27.1% vs 37.9%, p < 0.001), less likely to have a history of seizure (11.8% vs 23.2%, p < 0.001), less likely to have cerebral palsy (5.8% vs 10.5%, p < 0.001), less likely to have a neuromuscular disorder (8.6% vs 15.6%, p < 0.001), more likely to not have history of IVH (94.1% vs 87.6%, p < 0.001), less likely to have prior ostomy (7.1% vs 18.4%, p < 0.001), less likely to require nutritional support (3.9% vs 15.6%, p < 0.001), and less likely to have a congenital malformation (31.5% vs 37.7%, p < 0.001) compared to new shunt patients. The preoperative characteristics of these patients are shown in Table 1.Table 1. Pre-match preoperative characteristicsVariableNew ShuntETVp-valueNew ShuntETVp-valueNew ShuntETVp-value ≤ 6 months6 months—2 years ≥ 2 yearsSexMale2958 (55.5%)327 (56.6%)0.6271005 (56.1%)334 (58.4%)0.3321665 (55.2%)766 (55.0%)0.784Female2370 (44.5%)251 (43.4%)787 (43.9%)238 (41.6%)1349 (44.7%)627 (45.0%)Non-Binary0 (0.0%)0 (0.0%)0 (0.0%)0 (0.0%)1 (0.0%)0 (0.0%)RaceWhite3017 (56.6%)345 (59.7%)0.1581062 (59.3%)354 (61.9%)0.2651966 (65.2%)881 (63.2%)0.205Non-White2311 (43.4%)233 (40.3%)730 (40.7%)218 (38.1%)1049 (34.8%)512 (36.8%)Age at Surgery, days (IQR)60.0 (21.0–102.0)85.0 (36.0–132.3)** < 0.0001307.0 (229.0–443.8)319.5 (247.5–452.0)0.03583166.0 (1724.0–4906.0)3784.0 (2157.0–5177.0) < 0.0001Weight at Surgery, kgs (IQR) (n = 28,969)3.6 (2.8–4.9)4.8 (3.5–6.3) < 0.00018.6 (7.3–10.3%)9.2 (7.8–10.8) < 0.000128.0 (17.2–49.2)37.0 (21.0–56.9) < 0.0001Gestational Age at Birth (n = 7,753) < = 24512 (9.6%)40 (7.0%) < 0.001167 (9.5%)37 (6.6%)0.73398 (3.7%)15 (1.3%) < 0.00125–26543 (10.2%)24 (4.2%)119 (6.8%)40 (7.1%)106 (4.0%)34 (2.9%)27–28408 (7.7%)17 (3.0%)99 (5.6%)31 (5.5%)80 (3.0%)27 (2.3%)29–30239 (4.5%)23 (4.0%)54 (3.1%)15 (2.7%)44 (1.6%)16 (1.4%)31–32247 (4.7%)19 (3.3%)63 (3.6%)20 (3.6%)53 (2.0%)27 (2.3%)33–34373 (7.0%)45 (7.9%)135 (7.7%)42 (7.5%)67 (2.5%)26 (2.2%)35–36482 (9.1%)71 (12.4%)163 (9.3%)53 (9.4%)117 (4.4%)49 (4.1%)Full term2502 (47.2%)332 (58.1%)956 (54.4%)323 (57.6%)2109 (78.9%)988 (83.6%)Prematurity (n = 27,343)2804 (52.8%)239 (41.9%) < 0.001800 (45.6%)238 (42.4%)0.194565 (21.1%)192 (16.4%)0.001Ventilator Dependence748 (14.0%)40 (6.9%) < 0.00188 (4.9%)28 (4.9%)0.988155 (5.1%)23 (1.7%) < 0.001Cardiac Risk FactorsMajor1076 (20.2%)97 (16.8%)0.044200 (11.2%)54 (9.4%)0.401125 (4.1%)39 (2.8%) < 0.001Minor1037 (19.5%)99 (17.1%)272 (15.2%)93 (16.3%)185 (6.1%)40 (2.9%)None3174 (59.6%)379 (65.6%)1301 (72.6%)422 (73.8%)2695 (89.4%)1311 (94.1%)Severe41 (0.8%)3 (0.5%)19 (1.1%)3 (0.5%)10 (0.3%)3 (0.2%)Steroid Use within 30 days336 (6.3%)30 (5.2%)0.291110 (6.1%)27 (4.7%)0.206502 (16.7%)145 (10.4%) < 0.001Hematologic Disorder1056 (19.8%)70 (12.1%) < 0.001148 (8.3%)37 (6.5%)0.165191 (6.3%)41 (2.9%) < 0.001Previous Cardiac Surgery313 (5.9%)28 (4.8%)0.313127 (7.1%)40 (7.0%)0.939112 (3.7%)34 (2.4%)0.028Case StatusElective3833 (71.9%)443 (76.6%)0.0561370 (76.5%)451 (78.8%)0.0991935 (64.2%)858 (61.6%)0.235Emergent521 (9.8%)47 (8.1%)204 (11.4%)47 (8.2%)538 (17.8%)261 (18.7%)Urgent974 (18.3%)88 (15.2%)218 (12.2%)74 (12.9%)542 (18.0%)274 (19.7%)ASA Class (n = 19,435)119 (0.6%)1 (0.3%)0.0086 (0.5%)3 (0.9%)0.2949 (0.5%)15 (1.8%) < 0.0012525 (15.7%)69 (21.7%)271 (24.0%)95 (28.7%)395 (20.7%)277 (32.8%)32287 (68.2%)217 (68.2%)767 (68.1%)209 (63.1%)1327 (69.5%)509 (60.3%)4514 (15.3%)31 (9.7%)83 (7.4%)24 (7.3%)172 (9.0%)42 (5.0%)59 (0.3%)0 (0.0%)0 (0.0%)0 (0.0%)7 (0.4%)1 (0.1%)Oxygen Support1316 (24.7%)79 (13.7%) < 0.001189 (10.5%)56 (9.8%)0.605167 (5.5%)25 (1.8%) < 0.001Developmental delay/impaired cognitive status674 (12.7%)75 (13.0%)0.823842 (47.0%)268 (46.9%)0.9561142 (37.9%)377 (27.1%) < 0.001Seizure Disorder822 (15.4%)67 (11.6%)0.014376 (21.0%)65 (11.4%) < 0.001698 (23.2%)165 (11.8%) < 0.001Cerebral Palsy22 (0.4%)1 (0.2%)0.37958 (3.2%)13 (2.3%)0.24318 (10.5%)81 (5.8%) < 0.001Structural CNS Abnormality4766 (89.5%)537 (92.9%)0.0091600 (89.3%)534 (93.4%)0.0042563 (85.0%)1174 (84.3%)0.531Neuromuscular Disorder292 (5.5%)49 (8.5%)0.003215 (12.0%)59 (10.3%)0.274471 (15.6%)120 (8.6%) < 0.001Intraventricular HemorrhageGrade 170 (1.3%)6 (1.0%) < 0.00118 (1.0%)3 (0.5%)0.1317 (0.2%)3 (0.2%) < 0.001Grade 2113 (2.1%)8 (1.4%)22 (1.2%)12 (2.1%)17 (0.6%)6 (0.4%)Grade 3592 (11.1%)33 (5.7%)115 (6.4%)25 (4.4)56 (1.9%)15 (1.1%)Grade 41195 (22.4%)86 (14.9%)199 (11.1%)61 (10.7%)119 (3.9%)24 (1.7%)Unknown Grade354 (6.6%)32 (5.5%)101 (5.6%)25 (4.4)174 (5.8%)34 (2.4%)None3004 (56.4%)413 (71.5%)1337 (74.6%)446 (78.0%)2642 (87.6%)1311 (94.1%)Ostomy (n = 23,335)321 (6.3%)38 (7.1%)0.879338 (19.7%)78 (14.4%) < 0.001536 (18.4%)94 (7.1%) < 0.001Nutritional support1918 (36.0%)129 (22.3%) < 0.001372 (20.8%)73 (12.8%) < 0.001469 (15.6%)54 (3.9%) < 0.001SIRS/Sepsis/Septic Shock within 48 h priorNone5239 (98.3%)572 (99.0%)0.5141744 (97.3%)559 (97.7%)0.3792856 (94.7%)1338 (96.1%)0.181Sepsis17 (0.3%)1 (0.2%)7 (0.4%)4 (0.7%)23 (0.8%)5 (0.4%)Septic Shock0 (0.0%)0 (0.0%)0 (0.0%)0 (0.0%)1 (0.0%)0 (0.0%)SIRS72 (1.4%)5 (0.9%)41 (2.3%)9 (1.6%)135 (4.5%)50 (3.6%)Inotropic support at time of surgery21 (0.4%)3 (0.5%)0.6545 (0.3%)1 (0.2%)0.66610 (0.3%)7 (0.5%)0.395Previous CPR within 7 days prior to surgery17 (0.3%)1 (0.2%)0.5452 (0.1%)2 (0.3%)0.2284 (0.1%)3 (0.2%)0.522Congenital Malformation3373 (63.3%)398 (68.9%)0.0081051 (58.6%)373 (65.2%)0.0051138 (37.7%)439 (31.5%) < 0.001**Childhood MalignancyNo5275 (99.0%)575 (99.5%)0.4881656 (92.4%)545 (95.3%)0.0622088 (69.3%)969 (69.6%)0.938Past Hx5 (0.1%)0 (0.0%)5 (0.3%)1 (0.2%)81 (2.7%)35 (2.5%)Current48 (0.9%)3 (0.5%)131 (7.3%)26 (4.5%)846 (28.1%)389 (27.9%)Bold p-value indicates significant result at p < 0.05ETV endoscopic third ventriculostomy, IQR interquartile range, ASA American Society of Anesthesiology.Analysis comparing preoperative characteristics of patients who underwent endoscopic third ventriculostomy or new shunt insertion before propensity score matching
Propensity score match
Post-match, all patient characteristics in each age group were similar with the exception of ASA Class (p = 0.002) in the ≥ 2 years age group (Table 2). The quality of the match was assessed using pre- and post-match standardized percent bias for each covariate in each age group (Fig. 1).Table 2. Post-match preoperative characteristicsVariableNew ShuntETVp-valueNew ShuntETVp-valueNew ShuntETVp-value ≤ 6 months6 months—2 years ≥ 2 yearsSexMale271 (56.8%)278 (58.3%)0.647208 (40.3%)217 (42.1%)0.569596 (55.7%)580 (54.2%)0.468Female206 (43.2%)199 (41.7%)208 (40.3%)217 (42.1%)474 (44.3%)491 (45.9%)Non-Binary0 (0.0%)0 (0.0%)0 (0.0%)0 (0.0%)1 (0.1%)0 (0.0%)RaceWhite300 (62.9%)295 (61.8%)0.738319 (61.8%)320 (62.0%)0.949700 (65.4%)710 (66.3%)0.649Non-White177 (37.1%)182 (38.2%)197 (38.2%)196 (38.0%)371 (34.6%)361 (33.7%)Age at Surgery, days (IQR)87 (35–128)85 (36–134)0.497311 (230–462)314 (247–448)0.5273579 (2084–5175)3540 (1946–4963)0.183Weight at Surgery, kgs (IQR)4.7 (3.4–6.3)4.9 (3.6–6.3)0.1239.0 (7.6–10.9)9.2 (7.7–10.8)0.73234.2 (20.0–54.5)34.7 (19.7–54.2)0.785Gestational Age at Birth < = 2432 (6.7%)21 (4.4%)0.70727 (5.2%)31 (6.0%)0.92221 (2.0%)12 (1.1%)0.80225–2619 (4.0%)15 (3.1%)33 (6.4%)36 (7.0%)30 (2.8%)29 (2.7%)27–2814 (2.9%)11 (2.3%)37 (7.2%)30 (5.8%)26 (2.4%)26 (2.4%)29–3011 (2.3%)17 (3.6%)14 (2.7%)13 (2.5%)18 (1.7%)15 (1.4%)31–3217 (3.6%)17 (3.6%)22 (4.3%)18 (3.5%)23 (2.2%)26 (2.4%)33–3438 (8.0%)40 (8.4%)35 (6.8%)41 (8.0%)24 (2.2%)25 (2.3%)35–3654 (11.3%)57 (12.0%)57 (11.1%)50 (9.7%)50 (4.7%)42 (3.9%)Full term292 (61.2%)299 (62.7%)291 (56.4%)297 (57.6%)879 (82.1%)896 (83.7%)Prematurity185 (38.8%)178 (37.3%)0.641225 (43.6%)219 (42.4%)0.706192 (17.9%)175 (16.3%)0.33Ventilator Dependence18 (3.8%)22 (4.6%)0.51821 (4.1%)21 (4.1%)1.024 (2.2%)19 (1.8%)0.441Cardiac Risk FactorsMajor65 (13.6%)71 (14.9%)0.64656 (10.9%)48 (9.3%)0.44727 (2.5%)31 (2.9%)0.659Minor71 (14.9%)77 (16.1%)74 (14.3%)85 (16.5%)46 (4.3%)37 (3.5%)None338 (70.9%)328 (68.8%)381 (73.8%)381 (73.8%)996 (93.0%)1002 (93.6%)Severe3 (0.6%)1 (0.2%)5 (1.0%)2 (0.4%)2 (0.2%)1 (0.1%)Steroid Use within 30 days22 (4.6%)22 (4.6%)1.019 (3.7%)22 (4.3%)0.63398 (9.2%)106 (9.9%)0.556Hematologic Disorder48 (10.1%)45 (9.4%)0.74333 (6.4%)33 (6.4%)1.026 (2.4%)30 (2.8%)0.588Previous Cardiac Surgery17 (3.6%)17 (3.6%)1.024 (4.7%)31 (6.0%)0.33229 (2.7%)27 (2.5%)0.787Case StatusElective368 (77.2%)369 (77.4%)0.647404 (78.3%)409 (79.3%)0.612674 (62.9%)683 (63.8%)0.875Emergent44 (9.2%)37 (7.8%)54 (10.5%)45 (8.7%)199 (18.6%)190 (17.7%)Urgent65 (13.6%)71 (14.9%)58 (11.2%)62 (12.0%)198 (18.5%)198 (18.5%)ASA Class (n = 2,350)10 (0.0%)1 (0.2%)0.4293 (1.0%)2 (0.7%)0.834 (0.7%)8 (1.3%)0.002271 (24.5%)55 (20.7%)72 (24.2%)79 (27.3%)138 (23.0%)200 (32.9%)3185 (63.8%)184 (69.2%)199 (67.0%)187 (64.7%)424 (70.7%)373 (61.4%)433 (11.4%)26 (9.8%)23 (7.7%)21 (7.3%)32 (5.3%)26 (4.3%)51 (0.3%)0 (0.0%)0 (0.0%)0 (0.0%)2 (0.3%)1 (0.2%)Oxygen Support48 (10.1%)49 (10.3%)0.91549 (9.5%)46 (8.9%)0.74725 (2.3%)22 (2.1%)0.658Developmental delay/impaired cognitive status57 (12.0%)60 (12.6%)0.767241 (46.7%)242 (46.9%)0.95281 (26.2%)306 (28.6%)0.226Seizure Disorder39 (8.2%)46 (9.6%)0.42658 (11.2%)60 (11.6%)0.845131 (12.2%)134 (12.5%)0.844Cerebral Palsy1 (0.2%)1 (0.2%)1.012 (2.3%)11 (2.1%)0.83371 (6.6%)70 (6.5%)0.931Structural CNS Abnormality449 (94.1%)444 (93.1%)0.508483 (93.6%)486 (94.2%)0.696914 (85.3%)907 (84.7%)0.672Neuromuscular Disorder51 (10.7%)44 (9.2%)0.44955 (10.7%)55 (10.7%)1.0111 (10.4%)98 (9.2%)0.344Intraventricular HemorrhageGrade 13 (0.6%)5 (1.1%)0.8965 (1.0%)3 (0.6%)0.5210 (0.0%)2 (0.2%)0.067Grade 27 (1.5%)5 (1.1%)5 (1.0%)11 (2.1%)2 (0.2%)6 (0.6%)Grade 329 (6.1%)27 (5.7%)28 (5.4%)22 (4.3%)11 (1.0%)14 (1.3%)Grade 450 (10.5%)54 (11.3%)50 (9.7%)52 (10.1%)21 (2.0%)22 (2.1%)Unknown Grade35 (7.3%)29 (6.1%)31 (6.0%)25 (4.8%)44 (4.1%)24 (2.2%)None353 (74.0%)357 (74.8%)397 (76.9%)403 (78.1%)993 (92.7%)24 (2.2%)Ostomy26 (5.5%)29 (6.1%)0.67776 (14.7%)74 (14.3%)0.8692 (8.6%)82 (7.7%)0.429Nutritional support81 (17.0%)83 (17.4%)0.86462 (12.0%)58 (11.2%)0.69847 (4.4%)42 (3.9%)0.588SIRS/Sepsis/Septic Shock within 48 h priorNone2 (0.4%)3 (0.6%)0.654504 (97.7%)505 (97.9%)0.8211037 (96.8%)1041 (97.2%)0.872Sepsis0 (0.0%)0 (0.0%)3 (0.6%)4 (0.8%)2 (0.2%)2 (0.2%)Septic Shock0 (0.0%)0 (0.0%)0 (0.0%)0 (0.0%)0 (0.0%)0 (0.0%)SIRS2 (0.4%)3 (0.6%)9 (1.7%)7 (1.4%)32 (3.0%)28 (2.6%)Inotropic support at time of surgery2 (0.4%)2 (0.4%)1.01 (0.2%)1 (0.2%)1.05 (0.5%)5 (0.5%)1.0Previous CPR within 7 days prior to surgeryNo casesNo cases1 (0.2%)0 (0.0%)0.3172 (0.2%)1 (0.1%)0.563Congenital Malformation335 (70.2%)333 (69.8%)0.888353 (68.4%)337 (65.3%)0.29357 (33.3%)368 (34.4%)0.615Childhood MalignancyNo474 (99.4%)475 (99.6%)0.654499 (96.7%)493 (95.5%)0.432752 (70.2%)751 (70.1%)0.616Past Hx0 (0.0%)0 (0.0%)0 (0.0%)1 (0.2%)32 (3.0%)25 (2.3%)Current3 (0.6%)2 (0.4%)17 (3.3%)22 (4.3%)287 (26.8%)295 (27.5%)Bold p-value indicates significant result at p < 0.05ETV endoscopic third ventriculostomy, IQR interquartile range, ASA American Society of AnesthesiologyAnalysis comparing preoperative characteristics of patients who underwent endoscopic third ventriculostomy or new shunt insertion after propensity score matchingFig. 1Covariate bias. Analysis comparing the percent standardized bias of pre- and post-match preoperative characteristics for the each age group: (a) ≤ 6 months, (b) 6 months – 2 years, (c) ≤ 6 months
For the ≤ 6 months age group, the match produced 477 patients per intervention group. The ETV group had longer operative times (68 vs 50 min, p < 0.0001), increased postoperative seizure (6.3% vs 0.4%, p < 0.001), increased related readmissions (15.7% vs 6.1%, p < 0.001), and increased related reoperations (14.7% vs 3.8%, p < 0.001). All other outcomes were similar.
For the 6 months to 2 years age group, the match produced 516 patients per intervention group. The ETV group had longer operative times (63 vs 54 min, p < 0.0001), increased organ space SSIs (2.5% vs 0.6%, p = 0.01), increased wound dehiscence (2.1% vs 0.2%, p = 0.004), increased postoperative seizure (3.3% vs 1.0%, p = 0.01), increased related readmissions (14.9% vs 7.8%, p < 0.001), and increased related reoperations (8.3% vs 3.7%, p = 0.002). All other outcomes were similar.
For the ≥ 2 years age group, the match produced 1071 patients per intervention group. The new shunt group had longer operative times (65 vs 59 min, p < 0.0001), increased total LOS (3 days IQR 2–8 vs 3 days IQR 1–6, p = 0.002), and increased mortality (1.5% vs 0.4%, p = 0.007). All other outcomes were similar. All post-match postoperative outcomes are shown in Table 3.Table 3. Post-match postoperative outcomesVariableNew ShuntETVp-valueNew ShuntETVp-valueNew ShuntETVp-value ≤ 6 months, n = 477 per group, n (%)6 months—2 years, n = 516 per group, n (%) ≥ 2 years, n = 1071 per group, n (%)Operative Time, minutes (IQR)50 (38–64)68 (48–95)** < 0.000154 (43–72)63 (42.5–91.5)0.000165 (49–88)59 (42–82) < 0.0001Length of total hospital stay, days (IQR)3 (1–11)3 (1–12.5)0.6412 (1–4)2 (1–4)0.3503 (2–8)3 (1–6)0.0019Still in Hospial > 30 Days18 (3.77%)28 (5.87%)0.1319 (1.74%)4 (0.78%)0.1635 (0.47%)7 (0.65%)0.563Death in 30 Days6 (1.26%)1 (0.21%)0.0583 (0.58%)2 (0.39%)0.65416 (1.49%)4 (0.37%)0.007Superficial Incisional SSI2 (0.42%)2 (0.42%)13 (0.58%)8 (1.55%)0.138 (0.75%)7 (0.65%)0.796Deep Incisional SSI3 (0.63%)0 (0.00%)0.083No casesNo casesNo casesNo casesOrgan/Space SSI6 (1.26%)8 (1.68%)0.593 (0.58%)13 (2.52%)0.01212 (1.12%)13 (1.21%)0.841Deep Wound Disruption/Dehiscence Occurrences3 (0.63%)9 (1.89%)0.0811 (0.19%)11 (2.13%)0.0046 (0.56%)14 (1.31%)0.072Pneumonia1 (0.21%)0 (0.00%)0.3172 (0.39%)1 (0.19%)0.5632 (0.19%)3 (0.28%)0.654Unplanned Intubation7 (1.47%)14 (2.94%)0.1221 (0.19%)5 (0.97%)0.1018 (0.75%)14 (1.31%)0.199On Ventilator > 48 Hours1 (0.21%)5 (1.05%)0.214No casesNo casesNo casesNo casesProgressive Renal InsufficiencyNo casesNo casesNo casesNo cases0 (0.00%)1 (0.09%)0.317Acute Renal FailNo casesNo casesNo casesNo casesNo casesNo casesUrinary Tract Infection4 (0.84%)4 (0.84%)12 (0.39%)1 (0.19%)0.5634 (0.37%)5 (0.47%)0.738Coma > 24 HoursNo casesNo casesNo casesNo casesNo casesNo casesCVA/Stroke or Intracranial HemorrhageNo casesNo casesNo casesNo casesNo casesNo casesSeizure Disorder2 (0.42%)30 (6.29%) < 0.0015 (0.97%)17 (3.29%)0.0113 (1.21%)14 (1.31%)0.846Nerve InjuryNo casesNo casesNo casesNo casesNo casesNo casesIVH Grade 1No casesNo casesNo casesNo cases0 (0.00%)1 (0.09%)0.317IVH Grade 2No casesNo casesNo casesNo casesNo casesNo casesIVH Grade 3No casesNo casesNo casesNo casesNo casesNo casesIVH Grade 4No casesNo casesNo casesNo casesNo casesNo casesIVH Grade Unknown2 (0.42%)3 (0.63%)0.6541 (0.19%)0 (0.00)0.317No casesNo casesCardiac Arrest Requiring CPR4 (0.84%)2 (0.42%)0.4132 (0.39%)1 (0.19%)0.5630 (0.00%)3 (0.28%)0.083Transfusion ≥ 25 cc/kg13 (2.73%)18 (3.77%)0.3616 (1.16%)6 (1.16%)16 (0.56%)5 (0.47%)0.762Ventricular Tachycardia0 (0.00%)1 (0.21%)0.3171 (0.19%)3 (0.58%)0.3163 (0.28%)6 (0.56%)0.316Sepsis5 (1.05%)6 (1.26%)0.7627 (1.36%)10 (1.94%)0.4636 (0.56%)7 (0.65%)0.781Septic ShockNo casesNo cases1 (0.19%)1 (0.19%)11 (0.09%)0 (0.00)0.317Central Line InfectionNo casesNo cases0 (0.00)1 (0.19%)0.317No casesNo casesRelated Readmission29 (6.08%)75 (15.72%) < 0.00140 (7.75%)77 (14.92%) < 0.00190 (8.40%)110 (10.27%)0.137Related Reoperation18 (3.77%)70 (14.68%) < 0.001**19 (3.68%)43 (8.33%)0.00265 (6.07%)80 (7.47%)0.197Bold p-value indicates significant result at p < 0.05ETV endoscopic third ventriculostomy, IQR interquartile rangeAnalysis comparing postoperative outcomes of patients who underwent endoscopic third ventriculostomy or new shunt insertion after propensity score matching
Survival analysis for readmission
Because of variable LOS, cases were subject to variable periods of risk for readmission during the first postoperative 30 days. Therefore, readmission was subjected to survival analysis. Cases that remained in the hospital after 30 days were excluded from this analysis as they were not at risk for readmission within this timeframe. There were significant differences in readmission for both the ≤ 6 months age group (p < 0.001) and 6 months to 2 years age group (p = 0.017), but no difference was seen in the ≥ 2 years age group (p = 0.054). Kaplan–Meier survival curves are shown in Fig. 2 for each age group.Fig. 2. Survival Estimates for Readmission. Kaplan–Meier survival estimates for related readmission in each age group. There were significant differences in readmission survival for both the (a) ≤ 6 months age group (p < 0.001) and (b) 6 months to 2 years age group (p = 0.017), however no difference was seen in the (c) ≥ 2 years age group (p = 0.054)
Discussion
Thirty-day surgical outcomes are the foundation of NSQIP for both children and adults, and they are a pillar of the US News and World Report hospital rankings [26]. They are relatively simple to collect, and as a quality measure they are responsive to process improvement. In the management of hydrocephalus they have been studied extensively not only in NSQIP but also in national and international multicenter registries [27, 28].
Comparisons of ETV and shunt insertion are challenging. Shunt insertion is undertaken with the expectation that hydrocephalus will be a chronic and incurable condition requiring life-long surgical maintenance, while ETV carries the potential for cure. Furthermore, although any case of hydrocephalus can, in principle, be treated by CSF shunt insertion, suitability for attempted treatment by ETV depends on clinical and anatomic factors, as exemplified in the ETV Success Score [23]. We have attempted to circumvent these challenges by using propensity score matching to compare cohorts of cases that, within the limits of the methodology, might have been treated by either procedure. There have been a number of prospective studies comparing ETV to shunt [8, 12]. Kulkarni et al. reported results from an international multi-institutional study including 27 centers. They found the actuarial success rates of ETV and shunt at 3 months to be 68% and 95%, respectively [12]. In our study, these rates were found to be 83% and 95% for the under 6 months age group, respectively. Similar to our study, they found that patients younger than 6 months do worse with ETV compared to shunt placement [12]. Uche et al. used data from a single institution which was comprised of age-matched patients with a mean age of 2.3 years and mean follow-up of 1.27 years [8]. Also similar to our study, they found ETV to be associated with decreased mortality in older children [8]. They also found increased rates of sepsis with shunt placement but earlier motor milestone achievement when compared to ETV [8].
A retrospective multi-institutional study including 41 different hospitals found ETV and shunt failure rates of 64.5% and 39.6%, respectively, at 1 year [13]. The infants in this study had a median age of 37 days (IQR 11–122 days) [13]. Even after adjustment for prematurity, IVH, and spina bifida, they still noted a higher risk of failure with ETV [13]. Likewise, our study also found increased failure rates with ETV in younger children compared to shunt. Another retrospective study of a single institution found no significant differences in outcomes at 1 year follow-up when comparing ETV and shunt, though this study may have been limited by low sample size [18].
Several case series have also compared ETV and shunt performance [16, 28]. El-Ghandour found that there was lower morbidity, mortality, and procedure failure associated with ETV compared to shunt placement [16]. de Ribaupierre et al. found a lower rate of ETV failure at 5-year follow-up but was unable to assess for statistical differences [28].
Only Kulkarni et al. have used propensity scores to adjust for unbalanced patient characteristics accounting for age and etiology of hydrocephalus in an international pediatric cohort [30]. They found the relative risk of ETV failure to be higher than shunt failure for the first 3 months, after which point risks becomes progressively lower for ETV [30]. The current study complements the Kulkarni report by drawing on a much larger sample size reflecting practices at a much larger number of institutions that are not necessarily engaged in hydrocephalus clinical research. In the context of the pediatric neurosurgical consensus about the long-term clinical superiority of ETV, this work demonstrates that what is good for 30-day outcomes is not necessarily good for patients. Assessment of quality in the management of childhood hydrocephalus requires a more discriminating approach than measurement of 30-day outcomes.
The short-term outcomes of ETV in younger age groups are unfavorable compared to CSF shunts, while the life-long advantages of successful ETV are compelling. These findings illustrate the inadequacy of existing quality metrics in the care of children with hydrocephalus. The ideal metric would be meaningful to families and payers, amenable to risk adjustment and other research analytics, and responsive to quality improvement measures. It would be strategic instead of tactical, assessing the value of the management of the entire course of a chronic illness like hydrocephalus instead of the success or failure of individual encounters. Beyond 30-day outcomes most clinical hydrocephalus research has employed survival analysis to study times to reoperation. This methodology is encounter-based, incomprehensible to many patients and families, useless to payers, and slow to detect improvements in care. At the senior author’s institution, an electronic medical record engineer has developed a filter algorithm for identifying patients in active follow-up (personal communication, Deborah Burchett). This denominator permits calculation of the fraction of patients requiring surgery in the preceding 12 months and number of hospital days required for those admissions. Reported on a monthly basis, these metrics are responsive to practice change. For parents, employers, and payers they reflect the annual probability that a child beneficiary will require surgery and the expected number of days for that child to spend in the hospital and for a parent to miss work. Sharing of the filter algorithm among children’s medical centers would open the way for risk adjustment and inter-institutional comparisons. Apropos of the current study, these metrics reward successful selection of patients for ETV. Denominator-based metrics from the electronic medical record may represent the future of quality measurement in the surgical management of hydrocephalus.
Limitations
NSQIP-P only captures 30-day outcomes although it is known that ETV and shunt placement have significant failure rates outside of this period. NSQIP-P captures the care received at a select group of facilities that have made an expensive institutional commitment to quality improvement and may not reflect nationwide experiences. Disturbing disparities in surgical hydrocephalus outcomes have been reported between the research literature and population-based data [31], but the NSQIP sample is likely more broadly representative than much of the work that has been published in this area from institutions actively engaged in hydrocephalus research. The NSQIP-P PUF does not provide any unique hospital identifiers, so there can be no statistical accounting for clustering by facility. Actual neurosurgical decisions are based on clinical and anatomic factors other than the covariates entered into the propensity matching, so it is likely that not all patients included in the match were actually candidates for both procedures. The etiology of hydrocephalus is not recorded explicitly in NSQIP-P, and the reliability of extrapolation from associated diagnoses and comorbidities is uncertain. Finally, no imaging data are available.
Conclusions
After stratification by age group, 30-day outcomes appear to depend on the age of the patient at the time of the index procedure. Among children < 2 years of age, short term outcomes after ETV were worse than after shunt insertion, but the opposite was true among older children. 30-day surgical outcomes unqualified by indications and contraindications for ETV lack face validity as a global quality measure in the management of childhood hydrocephalus. Lastly, neurodevelopmental outcomes are of much greater importance in the management of hydrocephalus than 30-day surgical complication rates, and no meaningful long-term comparative data are available at this time. A multicenter randomized controlled trial comparing early childhood neurodevelopmental outcomes after ETV and shunt insertion is underway [32].
The reference list from the paper itself. Each links out to its DOI / PubMed record.
- 1Kulkarni AV, Sgouros S, Leitner Y, Constantini S; International Infant Hydrocephalus Study Investigators. (2018) International Infant Hydrocephalus Study (IIHS): 5-year health outcome results of a prospective, multicenter comparison of endoscopic third ventriculostomy (ETV) and shunt for infant hydrocephalus. Childs Nerv Syst 34(12):2391–2397. 10.1007/s 00381-018-3896-510.1007/s 00381-018-3896-529987375 · doi ↗ · pubmed ↗
- 2Bogaczyk V, Fleck S, Berneiser J et al. (2022) Long-term quality of life after ETV or ETV with consecutive VP shunt placement in hydrocephalic pediatric patients [published correction appears in Childs Nerv Syst 38(10):1895. 10.1007/s 00381-022-05657-7]. Childs Nerv Syst. 2022;38(10):1885–1894. 10.1007/s 00381-022-05590-910.1007/s 00381-022-05590-9PMC 952274635790573 · doi ↗ · pubmed ↗
- 3Kulkarni AV, Sgouros S, Constantini S; IIHS Investigators (2016) International Infant Hydrocephalus Study: initial results of a prospective, multicenter comparison of endoscopic third ventriculostomy (ETV) and shunt for infant hydrocephalus. Childs Nerv Syst 32(6):1039–1048. 10.1007/s 00381-016-3095-110.1007/s 00381-016-3095-127107887 · doi ↗ · pubmed ↗
- 4Kulkarni AV, Drake JM, Kestle JR,et al. (2010) Predicting who will benefit from endoscopic third ventriculostomy compared with shunt insertion in childhood hydrocephalus using the ETV Success Score [published correction appears in J Neurosurg Pediatr. 2011 Feb;7(2):221] [published correction appears in J Neurosurg Pediatr. 2011 Feb;7(2):221. 10.3171/2010.8.PEDS 103a]. J Neurosurg Pediatr 6(4):310–315. 10.3171/2010.8.PEDS 10310.3171/2010.8.PEDS 10320887100 · doi ↗ · pubmed ↗
- 5Prajapati HP, Ansari MA, Jaiswal M (2022) Comparative outcome analysis of endoscopic third ventriculostomy and ventriculoperitoneal shunt surgery in pediatric hydrocephalus: an experience of a tertiary care center. Asian J Neurosurg 17(2):227–234. Published 2022 Aug 26. 10.1055/s-0042-175078010.1055/s-0042-1750780 PMC 947385936120619 · doi ↗ · pubmed ↗
- 6Jesuyajolu DA, Zubair A, Nicholas AK, et al. (2022) Endoscopic third ventriculostomy versus ventriculoperitoneal shunt insertion for the management of pediatric hydrocephalus in African centers - A systematic review and meta-analysis. Surg Neurol Int 13:467. Published 2022 Oct 14. 10.25259/SNI_747_202210.25259/SNI_747_2022 PMC 961052236324983 · doi ↗ · pubmed ↗
- 7Kulkarni AV, Sgouros S, Constantini S; International Infant Hydrocephalus Study Investigators. (2017) Outcome of treatment after failed endoscopic third ventriculostomy (ETV) in infants with aqueductal stenosis: results from the International Infant Hydrocephalus Study (IIHS). Childs Nerv Syst 33(5):747–752. 10.1007/s 00381-017-3382-510.1007/s 00381-017-3382-528357554 · doi ↗ · pubmed ↗
- 8Limbrick DD Jr, Baird LC, Klimo P Jr, Riva-Cambrin J, Flannery AM; Pediatric Hydrocephalus Systematic Review and Evidence-Based Guidelines Task Force. (2014) Pediatric hydrocephalus: systematic literature review and evidence-based guidelines. Part 4: Cerebrospinal fluid shunt or endoscopic third ventriculostomy for the treatment of hydrocephalus in children. J Neurosurg Pediatr 14 Suppl 1:30–34. 10.3171/2014.7.PEDS 1432410.3171/2014.7.PEDS 1432425988780 · doi ↗ · pubmed ↗