Reprogramming of liver metabolism during West Nile virus infection unveils novel aspects of disease pathophysiology
Patricia Mingo-Casas, Ana-Belén Blázquez, Josefina Casas, Ana Esteban, Estela Escribano-Romero, Pedro J. Sánchez-Cordón, Nereida Jiménez de Oya, Juan-Carlos Saiz, Miguel A. Martín-Acebes

TL;DR
This study reveals how West Nile virus infection alters liver metabolism, even without viral replication, offering new insights into the disease's effects on the liver.
Contribution
The study identifies novel metabolic changes in the liver during WNV infection, highlighting previously underestimated aspects of the disease's pathophysiology.
Findings
WNV infection causes hepatic transcriptomic reprogramming affecting inflammation, immunity, and lipid metabolism.
Lipidomic analysis shows increased sphingolipids, triacylglycerols, and cholesteryl esters, alongside reduced cholesterol and phospholipids.
Histopathological evidence supports the development of steatosis in a third of infected animals.
Abstract
West Nile virus (WNV) is a neurotropic mosquito-borne flavivirus responsible for outbreaks of encephalitis and meningitis worldwide. About 20% of infected patients exhibit abnormal liver function tests, although the participation of this organ in the pathophysiology of the disease remains unclear. To fill this gap, this study explores changes in liver metabolism during WNV infection. Given the relevance of the liver as a major immune and metabolic organ, the changes in response to WNV infection were analyzed in the mouse model combining transcriptomics, lipidomics and histopathological analyses. Despite the absence of detectable viral replication in the liver, infection resulted in hepatic transcriptomic reprogramming that affected inflammation, immunity, biological oxidation and lipid metabolisms. Changes in the expression of genes related to glutathione metabolism, detoxification…
Genes, proteins, chemicals, diseases, species, mutations and cell lines named across the full text — each resolved to its canonical identifier and authoritative record.
Click any figure to enlarge with its caption.
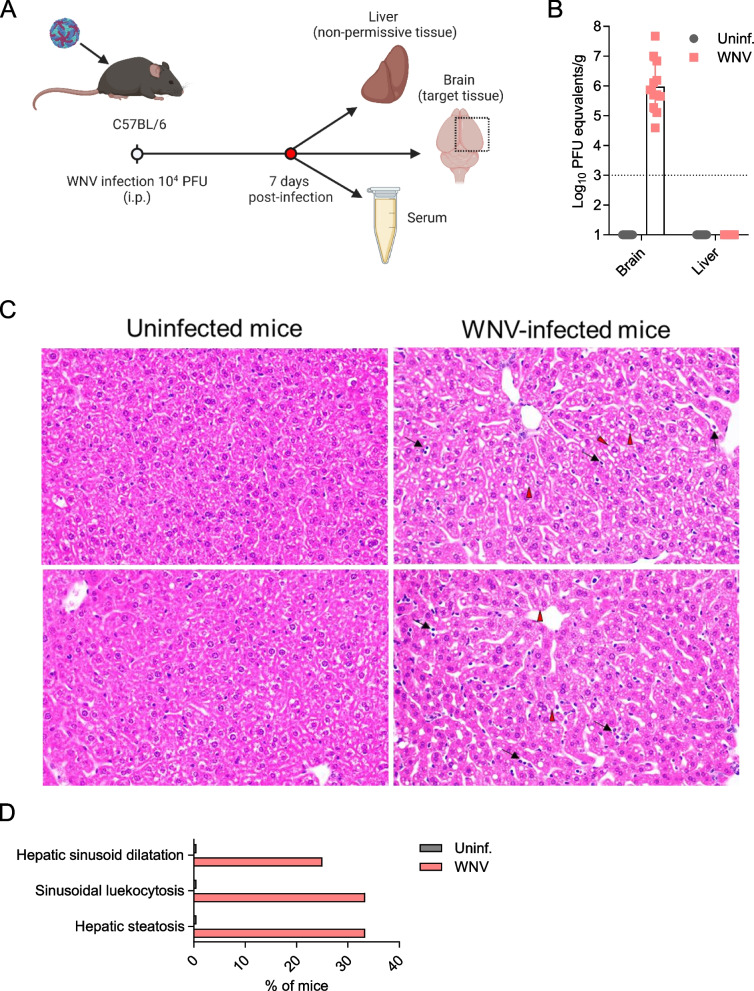 Figure 1
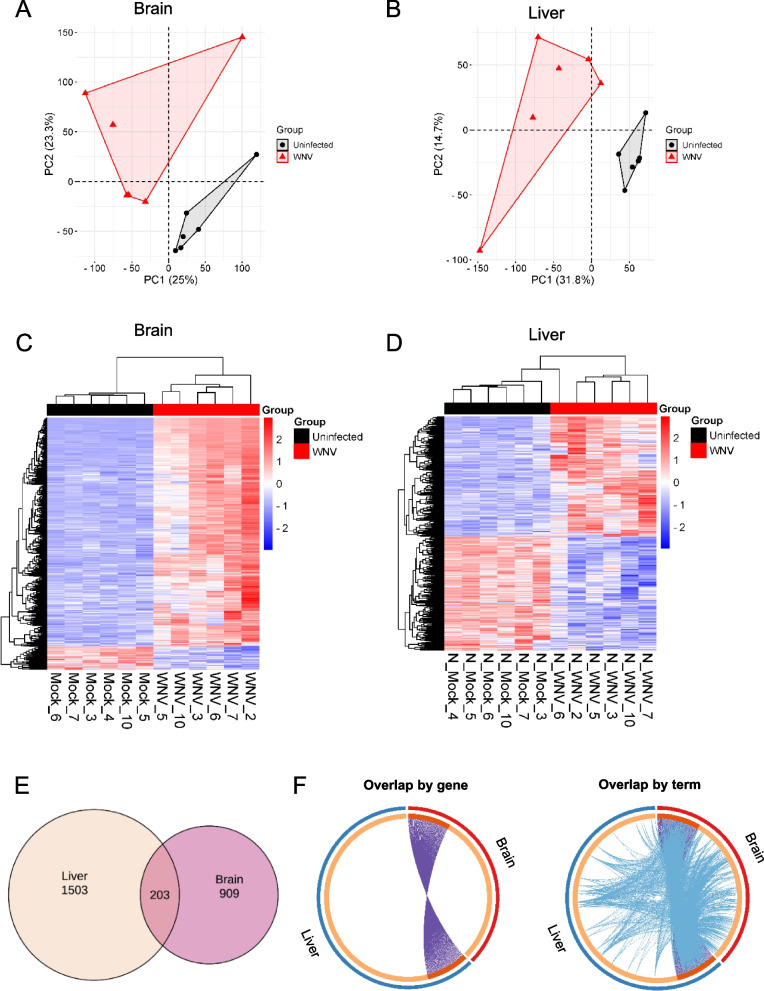 Figure 2
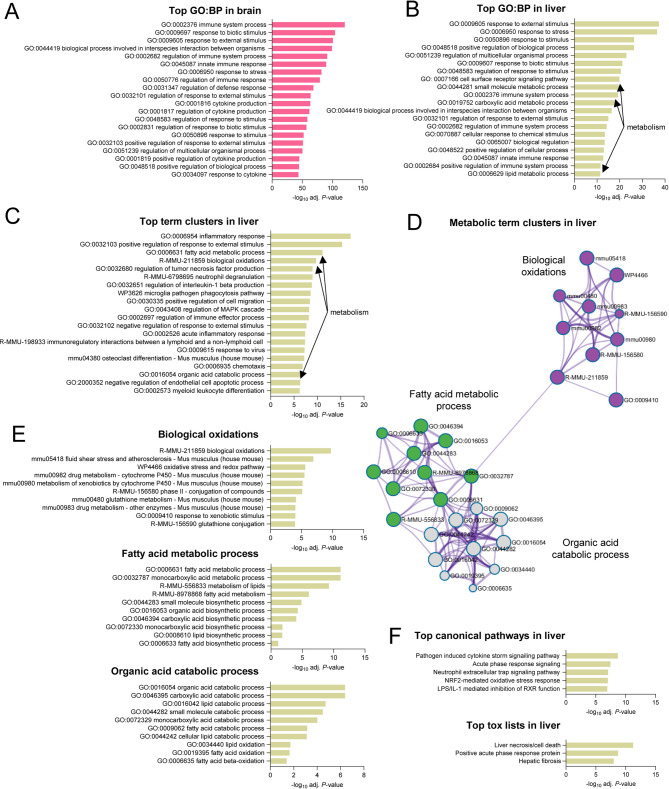 Figure 3
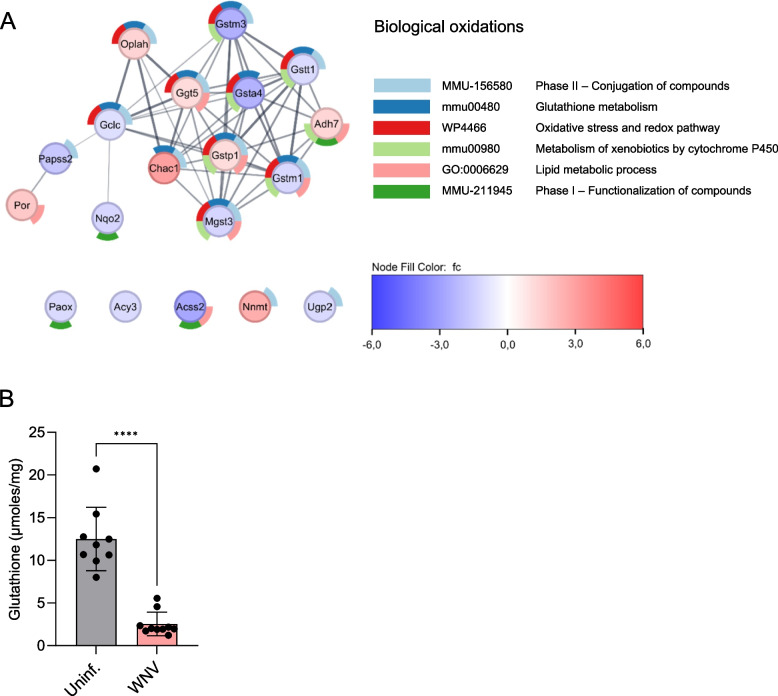 Figure 4
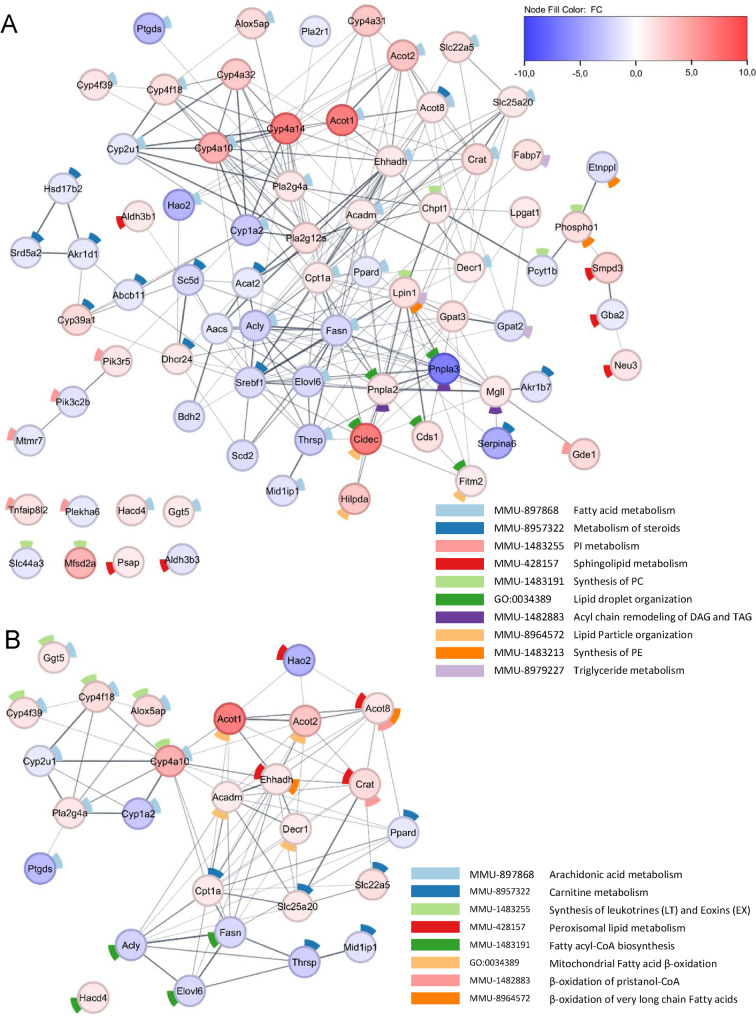 Figure 5
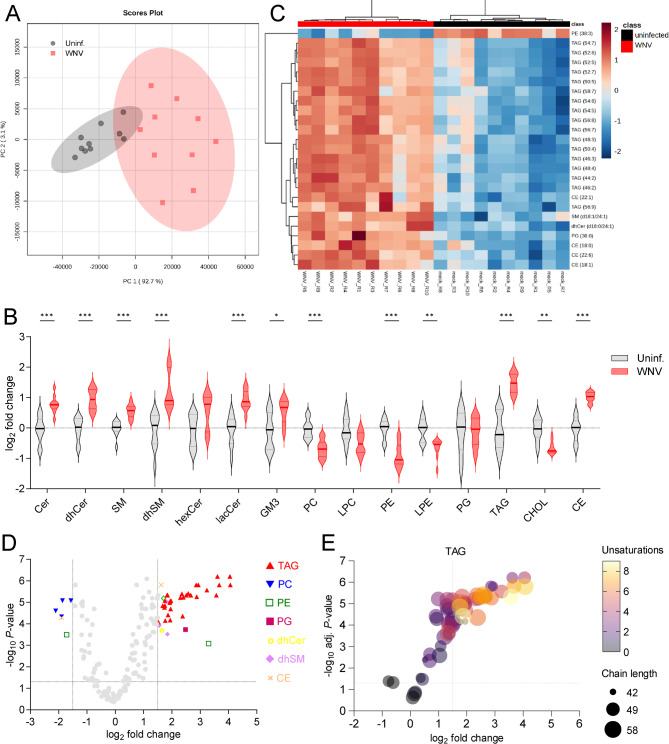 Figure 6
- —https://doi.org/10.13039/501100011033Agencia Estatal de Investigación
- —European Commission– NextGenerationEU
Peer Reviews
No public reviews on file for this paper yet. If you reviewed it on a platform where reviews are public (OpenReview, ICLR, NeurIPS, ICML), you can paste yours below so the community can read it here.
Videos
No videos yet. Explain this paper in a talk, walkthrough, or lecture? Add one.
Taxonomy
TopicsMosquito-borne diseases and control · Malaria Research and Control · Poverty, Education, and Child Welfare
Introduction
Demographic and climate changes have intensified the impact of arthropod-borne diseases on global health. As a result, over 80% of the global population is now at risk of contracting a vector-borne disease (Baker et al. 2022; Franklinos et al. 2019). Within these pathogens transmitted by vectors, arthropod-borne viruses (arboviruses) represent major public health threats. In this current scenario of global change, the growth of West Nile virus (WNV) activity has gained attention during recent years (Barzon et al. 2022; Garcia San Miguel Rodriguez-Alarcon et al 2020; Kretschmer et al. 2023; Pervanidou et al. 2022). WNV is a worldwide-distributed mosquito-borne member of the genus Orthoflavivirus within the family Flaviviridae (Postler et al. 2023). Wild birds constitute its natural reservoir, but it can also be transmitted to other vertebrates such as horses and humans by the bites of infected mosquitoes (Saiz et al. 2021).
Clinical manifestations of WNV infection go from a mild flu-like syndrome (WN fever) to severe neurological illness (WN neuroinvasive disease) that curses with meningitis, encephalitis and acute flaccid paralysis, which can be fatal or result in long-term sequelae (Davis et al. 2006; Hayes and Gubler 2006). Other manifestations that affect peripheral organs include pancreatitis, myocarditis, cardiac dysrhythmia, rhabdomyolysis, orchitis, uveitis, vitritis, optic neuritis, chorioretinitis and kidney disease (Hayes and Gubler 2006; Barzon et al. 2013). Moreover, about 20% of WNV patients exhibit abnormal liver function tests (Davis et al. 2006) with elevated serum levels of ferritin, alkaline phosphatase, bilirubin or transaminase (Chowers et al. 2001; Cunha et al. 2004; Urosevic et al. 2016; Weiss et al. 2001). Liver pathologies as a consequence of WNV infection include reports of jaundice (Georges et al. 1987), hepatitis (Georges et al. 1987; Mori et al. 2023), fulminant hepatitis (Yim et al. 2004), acute liver failure and purpura fulminans (Shah et al. 2016) or fatal hemorrhagic fever with hepatic necrosis and steatosis (Paddock et al. 2006). While there are veterinary vaccines for horses to prevent WNV infection, there are no specific vaccine or therapy licensed for human use, and treatment is limited to supportive care with hydration, antipyretics and anti-inflammatory corticosteroids in severe neurological manifestations. https://www.cdc.gov/west-nile-virus/hcp/treatment-prevention/therapeutics-review.html?CDC_AAref_Val.
Given the growing incidence of WNV, it is urgent to find new targets for novel therapeutic options to reduce the complications associated with infection and to improve the outcome of the patients. To achieve this goal, a more detailed knowledge of the pathophysiology of disease is critical. In this sense, the liver is a major vital organ and plays key roles in inflammation and immunity during infections, including non-hepatotropic viruses, and its function is essential to regulate host homeostasis, oxidative stress, detoxification and lipid metabolism (Adams and Hubscher 2006; Kubes and Jenne 2018; Zou et al. 2023). The hepatopathology of viscerotropic orthoflaviviruses, like the yellow fever virus, has been long well-known. Indeed, this genus receive its name after the jaundice induced by the yellow fever virus because flavus means yellow in Latin (Bailey and Diamond 2022). Even more, infection with other orthoflaviviruses such us dengue, Japanese encephalitis or Zika viruses can alter the metabolism of this organ (Zheng et al. 2023). However, the involvement of the liver during WNV infection remains to be elucidated. The current view is that the tissue-specific antiviral effector gene expression and innate immune cellular processes in the liver made it a non-permissive tissue for WNV multiplication (Pena et al. 2014; Suthar et al. 2013; Venter et al. 2005). Although hepatic inflammation, immunity and metabolic alterations are intricately connected (Gluchowski et al. 2017; Perez-Luz et al. 2023) its involvement in WNV infection has still not been addressed. Thus, the aim of this study was to assess the effect of WNV infection on hepatic metabolism using a suitable mouse model of infection.
Methods
Animal experiments
Experimental infections in mice were performed in the biosafety level 3 (BSL-3) facilities at Centro de Investigación en Sanidad Animal, Instituto Nacional de Investigación y Tecnología Agraria y Alimentaria (CISA, INIA-CSIC). A total of 44 six-week-old C57BL/6JOlaHsd female mice (Envigo; Inotiv) were used (22 WNV-infected and 22 mock-infected). Mice were infected with 1 × 10^4^ plaque forming units (PFU) of WNV NY99 (GenBank: KC407666.1) diluted in 200 µl of Minimum Essential Medium Eagle (MEM; Corning) by intraperitoneal (i.p.) injection and mock-infected mice were inoculated i.p. with the same volume of MEM as described in Mingo-Casas et al. (2023). Animals were kept with ad libitum access to food and water during the whole experiment and were anesthetized under isoflurane to be humanely sacrificed at 7 days post-infection to collect brain, liver and serum samples. All samples were immediately frozen and stored at −80 °C until further analyses.
RNA extraction and real-time PCR
Tissues were homogenized with a TissueLyser II equipment (Qiagen) and total RNA was extracted using the Ribopure RNA purification kit (Invitrogen). Viral load was quantified in brain and liver samples by quantitative one-step RT-PCR as described (Mingo-Casas et al. 2023). Genomic equivalents to PFU/g of tissue were calculated by comparison with a standard curve containing previously titrated samples (Mingo-Casas et al. 2023) and Cts were analyzed by using a QuantStudio5 Real-time PCR system (Applied Biosystems).
Histopathology
Liver perfusion in situ protocol was performed by using 10 ml of phosphate saline buffer (PBS, 1x). Suprahepatic inferior vena cava (IVC) was cannulated with a 26G sterile needle for PBS injection and after liver swelling and discoloration, the portal vein was cut. During necropsies, perfused livers were sampled from WNV-infected and uninfected mice euthanized 7 days post-infection. Then, liver samples were fixed via immersion in 4% buffered formalin solution for 72 h, routinely processed, and embedded in paraffin wax. For histopathological evaluation, 4 μm tissue sections were stained with hematoxylin and eosin (H&E). The stained sections were evaluated by a veterinary pathologist.
Biochemical analyses
Serum was obtained from blood samples using Microvette 500Z (Sarstedt) by centrifugation (10,000 × g, 5 min at 20 °C). Samples were analyzed using Skyla Element RC clinical chemistry analysis system (Scil, Antech company) with a Comprehensive Plus rotor (Scil, Antech company) without diluting the samples (Vetcon, Madrid, Spain). Glutathione was quantified in samples from prefunded livers using GSH-Glo Glutathione Assay (Promega) as described by the manufacturer.
RNA-seq, transcriptomic and bioinformatic analysis
cDNA library was generated from RNA samples by using TruSeq Stranded mRNA LT Sample Prep Kit (Illumina, San Diego, CA, USA) and sequencing was performed on a NovaSeq6000 100PE (Illumina, San Diego, USA) by Macrogen (Seoul, Korea) as described in Mingo-Casas et al. 2023. Procedures for raw reads quality check, mapping, assembly, annotation and differentially expressed genes (DEGs) analysis were performed as in Mingo-Casas et al. 2023. DESeq2 (Love et al. 2014) was used to select DEGs based on|log_2_ fold change infected/uninfected|> 2 and adjusted P-value < 0.05 corrected by false discovery rate (FDR) values. PCA plots were created using SRplot based on prcomp R function and FactoMineR package (Tang et al. 2023). DEG expression clustered heatmaps were created with SRplot (Tang et al. 2023) based on pheatmap R package using Euclidean distance and complete-linkage clustering methods. Euler graphs to display DEG overlap between liver and brain were created with Evenn (Yang et al. 2024). Circos plots to display gene overlap were created with Metascape (Zhou et al. 2019). DEGs gene set enrichment analysis was performed using g:Profiler (Kolberg et al. 2023) followed by filtering with REVIGO (Supek et al. 2011) to identify non-redundant terms and with Metascape (Zhou et al. 2019). Functional enrichment and protein–protein networks were created using STRING (Szklarczyk et al. 2023) and analyzed in Cytoscape 3.10.1 (Shannon et al. 2003) using stringApp (Doncheva et al. 2019). Ingenuity Pathway Analysis (IPA) software (QIAGEN), (Kramer et al. 2014) was performed with a core analysis and filtering by specie (Mus musculus) and with a cut off of 0.05 adjusted p-value was performed for FDR corrected DEGs. Gene sets from selected pathways were retrieved from Reactome knowledge database (Milacic et al. 2024). Genes were mapped in KEGG pathways using SRplot (Tang et al. 2023) and Pathview (Luo and Brouwer 2013).
Lipidomics
Liver samples were weighed and then cut into small sections of about 25 mg and then transferred to a 1.5 ml centrifuge tube (Upadhyay et al. 2024). All samples were homogenized (40 Hz, 4 min) in sterile PBS using a TissueLyserII equipment (Qiagen), and protein concentration was determined by Bradford assay. Final protein concentrations were adjusted to 5 mg/ml in PBS. Lipid extraction from homogenized samples with methanol-chloroform (2:1), identification and quantification by liquid chromatography coupled with high-resolution mass spectrometry (LC–MS/ToF) were performed as described (Jimenez de Oya et al. 2018; Martin-Acebes et al. 2014). Lipidomics data were analyzed with web-based Metaboanalyst 6.0 (Pang et al. 2021). PCA and heatmaps displaying normalized, log_2_-transformed pareto-scaled data and were created with Metaboanalyst 6.0 (Pang et al. 2021) as described in Mingo-Casas et al. (2023). A total of 181 lipid molecular species were identified in the liver, and quantified covering 4 categories (sphingolipids, glycerophospholipids, glycerolipids and sterol lipids) and 16 subclasses. Lipids were annotated according to LIPID Metabolites and Pathways Strategy (LIPID MAPS) indications (Liebisch et al. 2020) as follows: Sphingolipids (Cer, ceramide; dhCer, dihydroceramide; SM, sphingomyelin; dhSM, dihydrosphingomyelin; hexCer, hexosylceramide; lacCer, lactosylceramide), glycerophospholipids (PC, phosphatidylcholine; LPC, lysophosphatidylcholine; PE, phosphatidylethanolamine; LPE, lysophosphatidylethanolamine), triacylglycerol (TAG) and sterols (CHOL, cholesterol; CE, cholesteryl ester).
Data analysis
Tissue samples or individual animals analyzed in each case are named as n in the figure legends. For statistical comparisons, two-way analysis of the variance (ANOVA) with Sidak multiple comparison test, Holm-Sidak multiple comparison test or FDR approach, and t-test with Welch’s correction were performed with Prism GraphPad 10.2.3 (GraphPad Software, Inc). Statistically significant differences are denoted in the figures as (*, P < 0.05; **, P < 0.01; ***, P < 0.001; ****, P < 0.0001).
Results
Hepatic alterations in WNV-infected mice
Although the impact of WNV during neuroinvasion has been extensively characterized in the CNS, the consequences of infection in peripheral tissues have received limited attention. Given the importance of the liver for the maintenance of homeostasis, metabolism and immunity, we decided to investigate the potential changes in the liver during neuroinvasion to elucidate additional aspects of WNV pathophysiology. Six-week-old C57BL/6 female mice were infected with WNV and sacrificed at 7 days post-infection (pi) (Fig. 1A). This time pi represents an acute stage of infection at which neuroinvasion has already occurred (Brown et al. 2007). Accordingly, WNV-infected mice displayed detectable levels of viral RNA in the brain (Fig. 1B). On the contrary, viral RNA was below the detection limit in the liver (Fig. 1B), which is also consistent with previous studies showing that WNV does not replicate in the liver or is rapidly cleared in immunocompetent mice, making of mouse liver a non-permissive tissue for WNV multiplication (Pena et al. 2014; Suthar et al. 2013; Brown et al. 2007). Histopathological findings confirmed the development of steatosis in 4/12 (33.33%) animals analyzed (Fig. 1C and D). Sinusoidal leukocytosis was also observed in 4/12 (33.33%) animals and hepatic sinusoidal dilatation in 3/12 (25%) animals (Fig. 1C and D), both compatible with an acute infection process. None of these findings was observed in the livers of uninfected animals. At this time pi, serum biochemical profiles of infected mice exhibited a reduction in albumin/globulin (A/G) ratio and an increase in alkaline phosphatase (ALP) in infected animals (Table 1). These features were also compatible with alteration in liver function, thus supporting an effect of WNV infection in the liver.Fig. 1. Liver alterations in WNV-infected mice. A Experimental design scheme. Mice were infected with WNV (10^4^ PFU/mouse) and animals were sacrificed at 7 dpi. Brain, liver and serum were harvested. Figure was created with Biorender. B Virus load in the brain and liver of infected animals. Virus load was determined by quantitative RT-PCR in infected and uninfected mice sacrificed a 7 dpi. (n = 12 animals per group). Dotted lines denote the limit of detection of the assay. C Representative histopathological sections of the liver (hematoxylin and eosin staining). The liver was sampled from WNV-infected and uninfected mice euthanized at 7 dpi. Compared with uninfected mice (Fig. 1 C, left panel), some WNV-infected mice (Fig. 1 C, right panel) showed diffuse dilatation of hepatic sinusoids with increased numbers of circulating lymphocytes and plasma cells (sinusoidal leukocytosis; black arrows), along with diffuse steatosis (red arrowheads). Magnification: 40x. D Graph displaying the percentage of animals exhibiting histopathological findings described in B (n = 12 mice per group)Table 1. Serum biochemistry parameters in mice infected with WNV at 7 days piParameterUninfected (n = 11)WNV (n = 11)^a^MedianMeanSDMedianMeanSDAlbumin (g/dL)2.92.880.112.92.90.25Total protein (g/dL)4.64.750.394.95.130.62Globulin (g/dL)1.71.850.362.22.210.45Albumin/Globulin1.671.60.281.31.340.25Total bilirubin (mg/dL)00.160.230.20.430.44Alanine transaminase (U/L)5483.2760.607379.7351.80Alkaline phosphatase (U/L)4.98.379.411721.9726.74Amylase (U/L)21033210.553836.1420772324.54679.94Creatinine (mg/dL)0.20.190.070.20.220.08Blood urea nitrogen (mg/dL)27.1726.364.7122.4228.814.23Glucose (mg/dL)167.03159.5754.21114.63112.4550.52Ca (mg/dL)2.32.270.112.342.350.11Phosphorus (mg/dL)8.068.51.767.518.162.10Blood urea nitrogen/creatinine ratio120.825121.5735.23114.9313252.57K (mmol/L)990990Na (mmol/L)148.1148.030.48147.6147.850.73^a^ Asterisk (*) for P < 0.05 two-tailed Mann–Whitney test between infected and uninfected mice
Transcriptomic reprogramming in the liver of WNV-infected mice
Bulk RNA-sequencing (RNA-seq) was conducted to investigate transcriptional rearrangements in the liver of infected mice. The brain was included in the analysis for comparison as a highly permissive tissue for WNV multiplication. Multivariate analysis confirmed that infection altered the transcriptomes of both tissues when compared to uninfected controls (Fig. 2A and B). The expression levels of the differentially expressed genes (DEGs) in the brain and liver are shown in the heatmap in Fig. 2C and D. In infected animals, 1,503 DEGs were identified in the liver and 909 in the brain (Fig. 2E and Table S1). Of these, only 203 DEGs were common to both the liver and brain. Circos plots in Fig. 2F indicate that the overlaps between these DEGs lists were improved by considering overlaps between genes sharing the same enriched ontology terms, supporting tissue-specific differences but also parallel transcriptional rearrangements.Fig. 2. Transcriptomic reprogramming in the liver of WNV-infected mice. A, B Principal component analysis (PCA) of gene expression in the brain (A) or in the liver (B) of mice infected with WNV. (n = 6 mice/group). C, D Heatmaps showing the expression levels of DEGs in the brain (C) and in the liver (D) of infected mice. Genes are arranged in rows and each column represents a sample. Up-regulated genes are colored in red and downregulated genes in blue. DEGs and individual samples are grouped by hierarchical clustering. (n = 6 mice/group). E Euler diagram showing the overlap between DEGs found in the liver and the brain of infected mice. F Overlap between gene lists only at the gene level, where purple curves link identical genes (left), and including the shared term level (right) where blue curves link genes that belong to the same enriched ontology term. The inner circle represents gene lists, where hits are arranged along the arc. Genes that hit multiple lists are colored in dark orange, and genes unique to a list are shown in light orange
Metabolic rewiring in the liver of WNV-infected mice
We performed a functional enrichment analysis of Gene Ontology (GO) terms for Biological Process (BP) of DEGs and filtering to identify non-redundant terms in brain (Fig. 3A) and liver (Fig. 3B). Changes due to infection in both brain and liver were dominated by immunity, cytokine production and response to stimulus, which is consistent with previous reports (Pena et al. 2014; Suthar et al. 2013; Venter et al. 2005). Additionally, metabolism-associated terms related to small molecule metabolic process (GO:0044281), carboxylic acid metabolic process (GO:0019752) and lipid metabolic process (GO:0006629) were enriched in the liver (Fig. 3B), thus supporting the alteration of these hepatic functions. Further analyses supported the parallelism between the transcriptomic rearrangements in liver and brain related to immune response (Fig. S1 and S2), but also identified three specific clusters in the liver related to metabolic functions which were biological oxidations (R-MMU-211859), fatty acid metabolic process (GO:0006631) and organic acid catabolic process (GO:0016054) (Fig. 3C). The metabolic processes identified within the biological oxidations cluster were related to oxidative stress, detoxification reactions (phase I and phase II) and glutathione metabolism, which are key functions of the liver. The deconvolution of the terms included in the fatty acid metabolism cluster and the organic acid catabolic cluster indicated that these terms were mainly related to lipid metabolism (Fig. 3D and E). Therefore, the host response to WNV infection included a transcriptional reprogramming in the liver that involved components of both immunity and metabolism, specifically affecting important metabolic functions of this organ such as biological oxidations and lipid metabolism. To explore the alteration of cellular pathways in the liver of infected animals, Ingenuity Pathway Analysis (IPA) was performed (Fig. 3F). This analysis was also consistent with the activation of immune response-related pathways and acute phase response (Fig. S3) in the liver of WNV-infected mice. Even more, the upregulation of oxidative stress response and inflammation-mediated inhibition of retinoid X receptor (RXR) function (Fig. 3F), which modulate detoxification and lipid metabolism (Li et al. 2021; Schulze et al. 2019), was also noticed. This analysis also indicated that the response to infection probably resulted in liver damage as components from the liver necrosis/cell death and steatosis were enriched in the liver of infected mice (Fig. 3F).Fig. 3. Functional enrichment and pathway analysis in the liver of WNV-infected mice. A, B Top 20 Gene Ontology (GO) Biological Process (BP) terms identified by functional enrichment analysis of the DEGs found in the brain (A) or in the liver (B) of WNV-infected mice. Enrichment was performed using g:Profiler and filtered with REVIGO to eliminate redundant GO terms. Identified GO:BP terms related to liver metabolism are indicated by arrows. C Results from enrichment analysis of DEGs in the liver of WNV-infected mice performed with Metascape. Terms related to liver metabolism are indicated by arrows. D Network plot of enriched terms in the clusters related to liver metabolism identified in (C). E Top terms included in the clusters related to liver metabolism identified in the liver of infected mice. F Top pathways and top toxicity lists identified by IPA analysis of DEGs in the liver of WNV-infected mice
Changes in the metabolism of biological oxidations in the liver
To further analyze the effect of WNV infection on liver metabolism, we first explored the biological oxidations pathway, as this constitutes an important function of the liver and was one of the major metabolic term clusters altered by infection (Fig. 3C and E). The search for individualized genes in the biological oxidations pathway (R-MMU-211859) led to the identification of 19 DEGs in the liver of WNV-infected mice (Table S2). Protein–protein interaction (PPI) networks for the proteins encoded by these genes highlighted a main cluster related to glutathione metabolism, oxidative stress and redox pathway (Fig. 4A). These factors were also involved in detoxifications (phase I and II reactions), metabolism of xenobiotics and drug metabolism related to cytochrome P450. Remarkably, some of these genes are also related to lipid metabolism (Fig. 4A). Seven DEGs were upregulated whereas 12 DEGs were downregulated by infection (Fig. 4A and Table S2). Among the upregulated genes, we found Chac1, Oplah and Ggt5, which are involved in glutathione biosynthesis and recycling, whilst the highest reduction in gene expressions was observed for Acss2, which is related to both detoxification and lipid metabolism. The alteration induced by WNV infection also included a reduction in Gclc and glutathione transferases Mgst3, Gsta4, Gstt1, Gstm1 and Gstm3 (Fig. 4A). The reduction in the total amount of glutathione in the liver of infected mice was confirmed (Fig. 4B). Overall, these results support that WNV infection results in the reorganization of oxidative metabolism in the liver.Fig. 4. Rewiring of biological oxidations metabolism in the liver upon WNV infection. A PPI network created for the DEGs related to biological oxidations pathway (R-MMU-211859) that are differentially expressed in the liver of infected mice. Nodes are colored based on fold change. Donut slices indicate selected over-represented pathways identified by STRING enrichment analysis. B Quantification of glutathione in the liver of uninfected and WNV-infected mice at 7 dpi. Bars denote mean ± SD. Each point indicates a single animal. ****, P < 0.0001 for unpaired t-test with Welch’s correction (n = 9—10 mice/group)
Response to WNV infection rewires lipid metabolism networks in the liver
As the functional enrichment analysis identified alterations in lipid metabolism, we explored in more detail the rearrangement of this metabolic pathway in the liver of infected animals. Through the search for genes related to lipid metabolism (R-MMU-556833.1), we identified 76 DEGs related to this pathway in the livers of WNV-infected mice (Table S3). The proteins encoded by these genes related to lipid metabolism exhibited a high degree of interconnections (Fig. 5A). These DEGs encompassed master regulators of lipid metabolism such as Srebf1 and Ppard (both downregulated) involved in multiple pathways (Fig. 5A) comprising fatty acid, glycerophospholipid, glycerolipid, steroid biosynthesis and sphingolipid metabolism. The highest increase in gene expression was observed for Cidec (FC 50.58), which is related to lipid droplet organization/lipid particle organization. Additionally, other genes involved in these pathways (Hilpda, Fitm2, Pnpla2 and Cds1) were also upregulated. The expression of genes involved in triacylglycerol (TAG) metabolism (Lpin1, Gpat2 and Fabp7), diacylglycerol (DAG) and TAG acyl chain remodeling (Pnpla2, Mgll and Pnpla3) was also altered in infected animals. Remarkably, Pnpla3 that is related to lipid droplet organization accounted for the highest reduction observed in the network (FC −36.56). Thus, lipid droplet organization showed the highest variations in gene expression observed. Regarding the metabolism of steroids, most of the DEGs related to this pathway were downregulated (Fig. 5A), with three genes involved in cholesterol biosynthesis downregulated (Srebf1, Acat2 and Sc5d) and Dhcr24 upregulated. The expression of genes involved in the synthesis of bile acids and salts, such as aldo–keto reductases Akr1d1, Akr1b7 and the bile salt export pump Abcb11, was also reduced. In the case of phospholipid metabolism (Fig. 5A), changes in the expression of key genes (Chpt1, Pcyt1b, Phospho1, Mfs2a and Etnppl) involved in the metabolism of phosphatidylcholine (PC) and phosphatidylethanolamine (PE), the most abundant phospholipids in all mammalian cell membranes, were noticed. The expression of phospholipases Pla2r1, Pla2g4a and Pla2g12 was also modified in infected animals. Changes in the levels of genes related to phosphatidyl-inositol metabolism (Pik3r5, Pik3c2b, Plekha6, Gde1, Mtmr7 and Tnfaip8l2) were also observed. Expression levels of sphingolipid metabolism-related genes (Fig. 5A) were also altered, including those involved in glycosphingolipid metabolism (Gba2 and Neu3), as well as a marked increase in the expression of Smpd3. The major proportion of entities included in the network corresponded to fatty acid metabolism (Fig. 5A). Fatty acid metabolism is a complex including fatty acid synthesis processes and oxidations, so this network was analyzed in detail (Fig. 5B). The expression of most of the genes encoding enzymes related to the degradation of fatty acids (Acadm, Acot2 and Ehhadh) and cytochrome P450, was upregulated in the liver of infected mice Infection, which also increased the expression of the carnitine transporters Slc22a5 and Slc25a20 that shuttle fatty acids into mitochondria for oxidation. DEGs related to peroxisomal lipid metabolism identified (Acot8, Crat and Ehhadh) were upregulated with the exception of Hao2 (Fig. 5B), as were genes involved in arachidonic acid metabolism and the synthesis of leukotrienes and eoxins (Fig. 5B). In contrast, the enzymes related to the synthesis of ketone bodies identified in the network (Aacs and Bdh2) were reduced. Likewise, regarding fatty acid biosynthesis (Fig. 5B), the reduction of Acly, Fasn and Elovl6 expression observed was consistent with a decrease in de novo fatty acid biosynthesis and elongation in the liver of infected mice. Overall, these results supported an important rewiring of hepatic lipid metabolism in WNV-infected mice.Fig. 5. Rewiring of lipid metabolism in the liver upon WNV infection. A PPI network created for the DEGs related to lipid metabolism pathway (R-MMU-556833.1) that are differentially expressed in the liver of infected mice. Nodes are colored based on fold change. Donut slices indicate selected over-represented pathways identified by STRING enrichment analysis. B Detail of the PPI network for genes from fatty acid metabolism (R-MMU-8978868) from A
Changes in the liver lipidome of WNV-infected mice
The lipid content in the liver of WNV-infected and uninfected mice was analyzed by liquid chromatography coupled with high-resolution mass spectrometry (LC-ToF). A total of 181 lipid molecular species spanning 4 categories and 16 subclasses of sphingolipids, glycerophospholipids, glycerolipids, and sterol lipids were identified and quantified (Fig S4). Principal component analysis (PCA) supported differences in the liver lipidome of infected animals in comparison to uninfected controls (Fig. 6A). At the lipid subclass level, infection promoted an increase in sphingolipids (Cer, dhCer, SM, dhSM, lacCer and GM3), TAG and CE (Fig. 6B). On the contrary, the glycerophospholipids PC, PE and LPE, as well as CHOL, were reduced. The analysis of the top 25 species ranked by t-test depicted a landscape dominated by an increase in TAGs species (17/25) and CE (4/25) (Fig. 6C). To identify the molecular species differentially expressed in the liver, those with fold change > 1.5 and adjusted P-value < 0.05 were selected (Fig. 6D and Table 2). Again, the landscape was dominated by an increase in TAGs, of note the reduction in several PC species. Detailed analysis of TAGs indicated that the majority of elevated species corresponded to long-chain polyunsaturated TAGs (Fig. 6E). Taken together these results confirm alteration in lipid metabolism in the liver of WNV-infected animals.Fig. 6WNV infection alters the liver lipidome. A Scores plot of PCA analysis of the liver lipidome of mice infected with WNV compared to uninfected controls at 7 dpi. Each symbol denotes a single sample and 95% confidence intervals are shadowed for each group (n = 10 mice/group) (B) Violin plots displaying the lipid subclasses analyzed in the livers of infected mice. Mean and quartiles are indicated. Statistical significance of the data was tested by the Holm-Sidak multiple comparison test. *, P < 0.05; **, P < 0.05; ***, P < 0.001. (n = 10 mice/group) (C) Heatmap displaying the top 25 features by t-test. The heatmap color indicated the relative abundance of the lipids, and lipid levels in the scales denote normalized, log_2_-transformed fold change and Pareto-scaled values. Columns denote analyzed animals (n = 10 mice/group). C Volcano plot for the molecular lipid species identified in the study. Significantly altered lipid species colored by lipid subclass (FDR adjusted P-value < 0.05 and|log_2_ fold change|> 1.5) are indicated (n = 10 mice/group). Grey points reflect non-significantly altered lipid species. Dashed lines indicate FDR adjusted P-value = 0.05 and|log_2_fold change|= 1.5. D Bubble plot showing the relations between the number of unsaturations and acyl-chain length for the TAG species identified. Color denotes the number of unsaturations and the size of the bubbles is proportional to fatty acyl length. Dashed lines indicate FDR adjusted P-value = 0.05 and log_2_fold change = 1.5Table 2Differentially expressed lipid species found in the liver of WNV-infected miceChange over uninfected^a^Lipid species^b^log_2_ fold changeFDR P-valueElevatedTAG (56:8)4.0660859291.56 × 10^–6^TAG (48:4)4.0490253166.21 × 10^–7^TAG (52:7)3.6716126071.56 × 10^–6^TAG (46:3)3.6133249076.21 × 10^–6^TAG (56:9)3.5726548134.69 × 10^–6^PE (38:0)3.2949029118.32 × 10^–4^TAG (50:5)3.2377026522.71 × 10^–6^TAG (44:2)2.9344162261.56 × 10^–6^TAG (52:6)2.8788154975.48 × 10^–6^TAG (46:2)2.8592033191.56 × 10^–6^TAG (48:3)2.6688486574.69 × 10^–6^TAG (54:7)2.6654085064.69 × 10^–6^TAG (58:7)2.5807438893.86 × 10^–6^TAG (56:7)2.5090809514.69 × 10^–6^PG (36:0)2.4821952251.85 × 10^–4^TAG (50:4)2.4063105115.92 × 10^–6^TAG (58:6)2.380362754.43 × 10^–5^TAG (54:6)2.3542687984.02 × 10^–6^TAG (52:5)2.2988237696.02 × 10^–6^TAG (44:1)1.9657918798.38 × 10^–6^TAG (53:5)1.9558670772.03 × 10^–5^TAG (42:2)1.9404654956.71 × 10^–5^TAG (53:4)1.9347449749.02 × 10^–6^TAG (51:4)1.927840721.04 × 10^–5^TAG (58:9)1.8647584613.89 × 10^–5^CE (22:1)1.8520008384.69 × 10^–6^dhSM (d18:0/18:0)1.8407528453.04 × 10^–4^TAG (54:5)1.8332077694.57 × 10^–6^dhSM (d18:0/16:0)1.8084519339.25 × 10^–6^TAG (42:1)1.7686992817.11 × 10^–5^TAG (58:8)1.7554983531.41 × 10^–5^TAG (56:6)1.754197818.38 × 10^–6^TAG (53:3)1.7412988971.71 × 10^–5^dhCer (d18:0/16:0)1.7096883976.50 × 10^–6^TAG (50:3)1.6798114021.45 × 10^–5^dhCer (d18:0/18:0)1.6457693252.07 × 10^–4^CE (22:6)1.6247710741.56 × 10^–6^dhSM (d18:0/24:1)1.5536729151.21 × 10^–4^TAG (53:2)1.5260586728.38 × 10^–5^CE (18:0)1.5129856754.69 × 10^–6^ReducedPC (38:5)−1.5648683998.38 × 10^–6^PE (34:1)−1.7169822623.23 × 10^–4^PC (38:2)−1.8623775028.38 × 10^–6^CE (20:3)−1.8944334355.24 × 10^–5^PC (40:6)−1.8953469674.75 × 10^–5^PC (38:3)−2.1028260172.51 × 10^–5^^a^Differentially expressed lipid species were considered when |log_2_ fold change > 1.5| and FDR adjusted P-value < 0.05^b^Lipid species are ordered by log_2_ fold change
Discussion
The liver is a multifunctional organ responsible for essential metabolic functions that contribute to the maintaining of homeostasis by regulating nutrient storage, redox balance, glucose and lipid metabolisms or detoxification. Nevertheless, the liver is also a key immune tissue. It contributes to the detection, capture, and clearance of pathogens, and during infections, the liver transforms from an anti-inflammatory or immunotolerant to an active immune environment (Kubes and Jenne 2018). As mentioned above, previous reports based on animal models indicated that the liver was a non-permissive tissue for WNV infection due to the tissue-specific antiviral and immune response (Suthar et al. 2013). WNV could indeed infect liver tissue, but this infection is rapidly cleared in immunocompetent mice, although it could progress in immunocompromised mice (Suthar et al. 2013; Diamond et al. 2003). Similarly, only in exceptional cases, infectious virus could be isolated from the liver of WNV-infected patients (Georges et al. 1987; Burt et al. 2002). Clinical cases of liver transplant-transmitted WNV (Abbas et al. 2022; Winston et al. 2014) also indicate that the human liver is capable of being infected by WNV, but that the infection would be restricted or controlled by immune defense programs (Suthar et al. 2013). The amount of viral RNA under the detection limit observed in this study is consistent with this view of the liver as a low-permissive organ for WNV replication, either because the virus does not infect liver cells in this mouse model or because it was quickly cleared from the liver by immune response and remained undectectable at thime pi analyzed (7 dpi). Our results obtained by RNA-seq were consistent with previous reports based on multiplex-gene expression analysis of inflammatory-related genes and DNA microarrays showing a marked increase in the expression of genes that were associated with innate and adaptive immunity in the absence of detectable viral multiplication (Pena et al. 2014; Suthar et al. 2013; Venter et al. 2005). Additionally, our analysis also identified non-previously noticed alterations of expression patterns of genes involved in specific metabolic functions of the liver, such as biological oxidations and lipid metabolism.
The biological oxidations pathway is related to redox and metabolic detoxification function, which represent key metabolic function of the liver. Harmful substances produced by normal metabolic processes, as well as drugs or xenobiotics, are constantly removed by the liver. Our analysis indicated that components from oxidative stress, redox pathways, detoxification reactions and specifically glutathione metabolism were altered in the liver of WNV-infected mice. The most abundant antioxidant is glutathione, whose imbalance is involved in many diseases. Glutathione functions as an enzymatic cofactor for eicosanoid biosynthesis, steroid isomerization and in cellular detoxification processes through the activity of glutathione transferases, peroxidases and its general antioxidant activity (Liu et al. 2014). In this context, a reduction in the expression of Gclc, which encodes glutamate-cysteine ligase catalytic subunit that non-redundantly controls glutathione production in the liver (Asantewaa et al. 2024), was noticed in the liver of infected animals. The expression of glutathione transferases Mgst3, Gsta4, Gstt1, Gstm1 and Gstm3 was also reduced in the liver of infected mice. As these enzymes are considered antioxidants, these results may indicate a decreased ability to cope with oxidative stress. The alteration of glutathione metabolism could affect the detoxification functions of the liver with potentially detrimental consequences for the organism since toxic substances are continuously being produced by metabolic processes. In this sense, the observed reduction in the expression of Acss2 (acyl-CoA synthetase short-chain family member 2), which catalyzes the conversion of acetate to acetyl coenzyme A (acetyl-CoA) and regulates acetylation related to substance metabolism, also supports this view (Ling et al. 2022). On the other hand, certain genes involved in glutathione biosynthesis and recycling (Chac1, Oplah, and Ggt5) were upregulated, highlighting the complex impact of the infection on liver metabolic functions. The increase in Chac1, which encodes glutathione-specific gamma-glutamylcyclotransferase 1, an enzyme that degrades glutathione, would further support a reduction in antioxidant capacity in mice following infection (Crawford et al. 2015). The reduction in total glutathione in the liver of infected mice was confirmed, thus supporting the impact of WNV infection in this important metabolic function of the liver.
As biological oxidations and lipid metabolism pathways are intertwined in the liver, components of the biological oxidation pathway were also related to lipid metabolism. The reduction in Gclc expression, which provides a link between lipid metabolism and glutathione metabolism (Asantewaa et al. 2024), would be also consistent with the alteration of lipid pathways upon infection. Even more, changes in the expression of Acss2, Gstm1, Ggt1, and Gstp1, as the ones observed here, have also been related to alterations in lipid accumulation in the liver (Ling et al. 2022; Zhu et al. 2022). This connection between inflammation, oxidative stress, and lipid metabolism is also consistent with alterations in the liver because of other pathologies (Gluchowski et al. 2017; Perez-Luz et al. 2023). Our computational analysis using IPA identified RXR within the top canonical pathways enriched in the liver of infected mice. Specifically, RAR/RXR modulate the synthesis and metabolism of lipids and bile acids in hepatocytes, supporting the alteration of hepatic lipid metabolism (Li et al. 2021). When lipid components in the liver of infected mice were analyzed by lipidomics, the highest proportion of altered species were TAGs. This accumulation of TAGs in the liver is consistent with the development of steatosis observed in histopathological analysis, and is also consistent with other studies showing that WNV infection can cause steatosis in Molchanova et al. (2021). Hepatic steatosis is a consequence of lipid acquisition exceeding lipid disposal, i.e., the uptake of fatty acids and de novo lipogenesis surpassing fatty acid oxidation and export. Notably, the highest upregulated and downregulated enzymes in the liver of infected animals were Pnpla3 and Cidec, respectively, both related to TAG metabolism, lipid droplet organization and lipid particle organization. Lipid droplets consist of a hydrophobic core of neutral lipids mainly composed of TAGs and CE, which is enclosed by a phospholipid monolayer (Olzmann and Carvalho 2019). PNPLA3 is a triglyceride lipase that mobilizes polyunsaturated fatty acids to facilitate hepatic secretion of large-sized very low-density lipoprotein (Johnson et al. 2024). It facilitates the balance between hepatic triglyceride storage and secretion mobilizing polyunsaturated fatty acids for phospholipid desaturation and enhancing hepatic secretion of triglyceride-rich lipoproteins (Johnson et al. 2024). Thus, its reduced expression is consistent with lipid accumulation. In fact, variants of this enzyme have been associated with non-alcoholic fatty liver disease (NAFLD) and hepatic steatosis (Salari et al. 2021). The highest increase in gene expression within DEGs related to lipid metabolism was observed for Cidec, which encodes a lipid transferase that promotes unilocular lipid droplet formation by mediating lipid droplet fusion. Lipid droplet fusion promotes their enlargement, restricting lipolysis and favoring lipid storage (Keller et al. 2008). Even more, other components from these pathways were also upregulated. This is the case of Hilpda, whose overexpression is related to impaired hepatic triglyceride secretion (Mattijssen et al. 2014) or Fitm2, which is also related to the triglyceride content in the liver (Bond et al. 2023). Regarding sterol metabolism, lipidomics showed a decrease in CHOL, which is consistent with the reduction in the enzymes of the CHOL biosynthesis observed by transcriptomics, and the accumulation of CE, which is also consistent with the accumulation of lipid droplets, as they constitute the main neutral lipids accumulated together with TAGs (Olzmann and Carvalho 2019). The alteration in PE and PC metabolism can also contribute to lipid accumulation as the relative abundance of PC and PE regulates the size and dynamics of lipid droplets and changes in hepatic phospholipid composition have been linked to fatty liver disease (Veen et al. 2017). In this line, the expression of genes involved in the metabolism of phospholipids PE and PC, such as Chpt1, Pcyt1b, Phospho1, Mfs2a and Etnppl, was also altered. Of note are reductions in Pcyt1b (choline-phosphate cytidylyltransferase B), which catalyzes the key rate-limiting step in PC biosynthesis, and Etnppl (ethanolamine phosphate phospholyase), which catabolizes phosphoethanolamine, an important headgroup precursor in PE. Lipidomics analyses supported a reduction of PC and PE in the liver of infected mice. Even more, consistent with the pathological implications of this alteration, an increase in the expression of the lipid transporter Mfsd2a was observed (Pu et al. 2016). Sphingolipid levels were also increased in the liver of infected mice. A marked increase in Smpd3 expression in the liver, which has previously been linked to steatosis, was also detected in infected mice (Al-Rashed et al. 2024).
Regarding de novo fatty acid synthesis, Acly (ATP citrate lyase), which encodes an important enzyme involved in lipid biogenesis that catalyzes the conversion of citrate to oxaloacetic acid and acetyl-CoA, was downregulated. Acetyl CoA is further transformed into malonyl-CoA, and Fasn (fatty acid synthase) uses this metabolite to synthesize fatty acids (Paglialunga and Dehn 2016). Accordingly, our results indicate that Fasn expression, as well as that of the long-chain fatty acid elongase Elov6, were also reduced supporting a decrease in de novo fatty acid biogenesis. Moreover, the reduction in the expression of Aacs (acetoacetyl-CoA synthetase), the key enzyme in the anabolic utilization of ketone bodies for de novo lipid synthesis (Bergstrom 2023), was also noticed in infected animals. Ketone bodies are readily utilized as substrates for lipid synthesis in lipogenic tissues, including the liver. Fatty acids are converted to ketone bodies in the liver and then used to synthesize cholesterol and other long-chain fatty acids in both the liver and non-hepatic tissues (Bergstrom 2023). Regarding fatty acid oxidation, our data show that infection promoted the upregulation of Acot1, Acot2 and Acot8, which encode acyl-CoA thioesterases, a group of enzymes that hydrolyze acyl-CoA esters into free fatty acids and coenzyme A. These enzymes balance the capacity of fatty acid oxidation, triglyceride levels and mitochondrial function (Franklin et al. 2017; Moffat et al. 2014). Carnitine transporters Slc22a5 and Slc25a20 were also upregulated in infected animals, as were most of the genes encoding cytochrome P450, which is related lipid oxidations (Cyp4a10, Cyp4a31, Cyp4a32, Cyp4f18C and Cyp4f39). The overexpression of some of these genes is linked to lipid accumulation and hepatic steatosis (Ryu et al. 2019; Zhang et al. 2017). On the contrary, Cyp1a1 expression was markedly reduced, which is also consistent with lipid accumulation in the liver, as the deletion of CYP1A1/2 induces cholesterol deposition in blood and liver and increases serum levels of low-density lipoprotein cholesterol, high-density lipoprotein cholesterol and total cholesterol (Lu et al. 2023).
We have recently characterized that the circulating lipid profile of the host undergoes marked alterations during WNV infection in both mice and humans (Mingo-Casas et al. 2023). As the circulating lipidome reflects changes that occur in pathological situations (Lydic and Goo 2018), and considering that the major proportion of circulating lipids are organized in lipoproteins, these observations pointed to the effects of the infection on the regulation of lipoprotein biology. In this regard, the liver is the major organ for lipid metabolism and synthesizes the majority of Gluchowski et al. (2017); Cole et al. 2012; Iqbal et al. 2017; Ramasamy 2014). Our results indicated that the changes in liver lipidome reflected the changes in plasma lipidome of WNV-infected mice, especially the increase in sphingolipids and TAGs (Mingo-Casas et al. 2023). WNV infection is highly dependent on host lipid metabolism at different levels (Martin-Acebes et al. 2014, 2016a; Jimenez de Oya et al. 2019). So that, lipids play multiple functions for orthoflavivirus multiplication providing the components for the viral envelope, the intracellular membranous platforms for viral replication, and an important energy source to support viral multiplication or immunomodulatory and signaling functions (Martin-Acebes et al. 2016b). However, in this study, remodeling of lipid metabolism in the liver occurred in the absence of detectable viral multiplication in this organ. This probably is a consequence of the systemic response to infection related to the key immune functions of the liver and systemic inflammation. The results here observed are also compatible with those obtained for other disease models of systemic infection by non-hepatotropic viruses that cause liver alterations as a kind of collateral damage (Adams and Hubscher 2006). Further research should be performed to elucidate the molecular mechanisms behind these changes.
Although changes in liver function as a consequence of WNV infection have been previously reported, to our knowledge, this is the first report specifically describing the metabolic response of the liver following WNV infection. Whereas biochemical serum profiles did not indicate major alterations in specific markers of liver function in infected animals, with the exception of a reduction in (A/G) ratio and an increase in alkaline phosphatase, a marked metabolic rewiring in the liver of infected mice was observed by transcriptomics and lipidomics. These results will contribute to a better understanding of WNV pathophysiology, to the search for new therapeutic targets, and provide a suitable model for the study of these underestimated aspects of the infection. The results here described invite caution and more attention to liver function in WNV-infected patients.
Supplementary Information
Supplementary Material 1. Fig S1. Network plot of enriched terms identified in the brain and the liver of WNV-infected mice.The network was created with Metascape by connecting terms with the best p-value from each of the clusters and a similarity > 0.3. Each node represents an enriched term and is colored by cluster.
Supplementary Material 2. Fig S2. Heatmap from the top 100 enriched terms across DEGs in brain and liver of infected mice. The heatmap is colored by p-value and was created with Metascape. Note the similarities among terms in the brain and liver of infected mice and the identification of a specific cluster related to metabolism in the liver of infected mice that is not present in the brain.
Supplementary Material 3. Fig S3. Heatmap for acute phase proteins in the liver.
Supplementary Material 4. Fig S4. Heatmap of the lipidome of the liver from mice infected with WNV. Lipid levels in the scales denote normalized, log2-transformed fold change and Pareto-scaled values. Columns denote analyzed animals (n = 10 mice/group) and rows lipid species ordered by subclass and total carbon. Samples were grouped by hierarchical clustering.
Supplementary Material 5. Table S1. List of DEGs in brain and liver.
Supplementary Material 6. Table S2. Biological oxidations DEGs in liver.
Supplementary Material 7. Table S3. Lipid metabolism DEGs in liver.
The reference list from the paper itself. Each links out to its DOI / PubMed record.
- 1Al-Rashed F, Arefanian H, Madhoun AA, Bahman F, Sindhu S, Al Saeed H, et al. Neutral sphingomyelinase 2 inhibition limits hepatic steatosis and inflammation. Cells. 2024;13(5). 10.3390/cells 13050463.10.3390/cells 13050463 PMC 1093106938474427 · doi ↗ · pubmed ↗
- 2Barzon L, Pacenti M, Montarsi F, Fornasiero D, Gobbo F, Quaranta E, et al. Rapid spread of a new West Nile virus lineage 1 associated with increased risk of neuroinvasive disease during a large outbreak in northern Italy, 2022: One Health analysis. Journal of travel medicine. 2022;31(8). 10.1093/jtm/taac 125.10.1093/jtm/taac 125PMC 1164608836331269 · doi ↗ · pubmed ↗
- 3Jimenez de Oya N, Blazquez AB, Casas J, Saiz JC, Martin-Acebes MA. Direct Activation of Adenosine Monophosphate-Activated Protein Kinase (AMPK) by PF-06409577 Inhibits Flavivirus Infection through Modification of Host Cell Lipid Metabolism. Antimicrob Agents Chemother. 2018;62(7).AAC.00360–18 [pii] 10.1128/AAC.00360-18.10.1128/AAC.00360-18PMC 602161629712653 · doi ↗ · pubmed ↗
- 4Jimenez de Oya N, Esler WP, Huard K, El-Kattan AF, Karamanlidis G, Blazquez AB, et al. Targeting host metabolism by inhibition of acetyl-Coenzyme A carboxylase reduces flavivirus infection in mouse models. Emerg Microbes Infect. 2019;8(1):624–36. 10.1080/22221751.2019.1604084.10.1080/22221751.2019.1604084 PMC 649330130999821 · doi ↗ · pubmed ↗
- 5Mingo-Casas P, Blazquez AB, Gomez de Cedron M, San-Felix A, Molina S, Escribano-Romero E, et al. Glycolytic shift during West Nile virus infection provides new therapeutic opportunities. J Neuroinflammation. 2023;20(1):217. 10.1186/s 12974-023-02899-3.10.1186/s 12974-023-02899-3PMC 1053783837759218 · doi ↗ · pubmed ↗
- 6Perez-Luz S, Matamala N, Gomez-Mariano G, Janciauskiene S, Martinez-Delgado B. NAFLD and AATD Are Two Diseases with Unbalanced Lipid Metabolism: Similarities and Differences. Biomedicines. 2023;11(7). 10.3390/biomedicines 11071961.10.3390/biomedicines 11071961 PMC 1037704837509601 · doi ↗ · pubmed ↗
- 7Pervanidou D, Kefaloudi CN, Vakali A, Tsakalidou O, Karatheodorou M, Tsioka K, et al. The 2022 West Nile Virus Season in Greece; A Quite Intense Season. Viruses. 2023;15(7). 10.3390/v 15071481.10.3390/v 15071481 PMC 1038302437515168 · doi ↗ · pubmed ↗
- 8Garcia San Miguel Rodriguez-Alarcon L, Fernandez-Martinez B, Sierra Moros MJ, Vazquez A, Julian Paches P, Garcia Villacieros E, et al. Unprecedented increase of West Nile virus neuroinvasive disease, Spain, summer 2020. Euro Surveill. 2021;26(19). 10.2807/1560-7917.ES.2021.26.19.2002010.10.2807/1560-7917.ES.2021.26.19.2002010 PMC 812079733988123 · doi ↗ · pubmed ↗