TANDEM ZINC‐FINGER/PLUS3 integrates light signaling and flowering regulatory pathways at the chromatin level
Giorgio Perrella, Elisa Vellutini, Allan Beveridge, Graham Hamilton, Pawel Herzyk, Eirini Kaiserli

TL;DR
This study reveals how light signals influence flowering in plants by altering chromatin structure through a protein called TANDEM ZINC-FINGER/PLUS3.
Contribution
The study identifies TANDEM ZINC-FINGER/PLUS3 as a novel integrator of light signaling and flowering pathways via chromatin regulation.
Findings
TANDEM ZINC-FINGER/PLUS3 binds to chromatin-modifying genes like FLOWERING LOCUS D and histone deacetylase 6.
It represses FLOWERING LOCUS C transcription, accelerating flowering in Arabidopsis thaliana.
TZP mediates crosstalk between light signals and flowering pathways at the chromatin level.
Abstract
Environmental and endogenous stimuli determine plant developmental transitions including flowering through multiple signaling cascades. Although the key activators and repressors of flowering initiation are defined, the components and mechanisms integrating light signaling and flowering pathways are not fully established. This study investigates the role of TANDEM ZINC‐FINGER/PLUS3 (TZP), a light‐integrating transcriptional regulator, to elucidate how light cues influence the epigenetic regulation of flowering in Arabidopsis thaliana.To dissect the molecular function of TZP, this study employed a combination of genetics, RNA sequencing, chromatin immunoprecipitation sequencing and phenotypic assays. These approaches were used to determine TZP's genomic binding sites, its downstream gene targets and its influence on flowering time and chromatin modifications. TANDEM ZINC‐FINGER/PLUS3 was…
Genes, proteins, chemicals, diseases, species, mutations and cell lines named across the full text — each resolved to its canonical identifier and authoritative record.
Click any figure to enlarge with its caption.
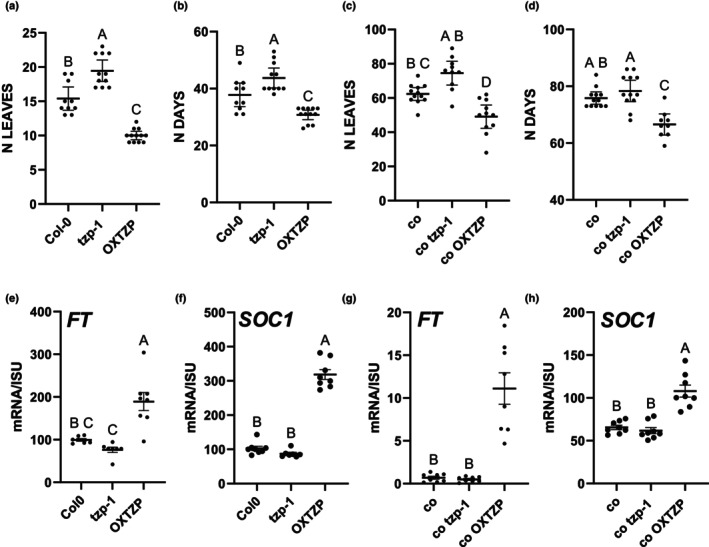 Fig. 1
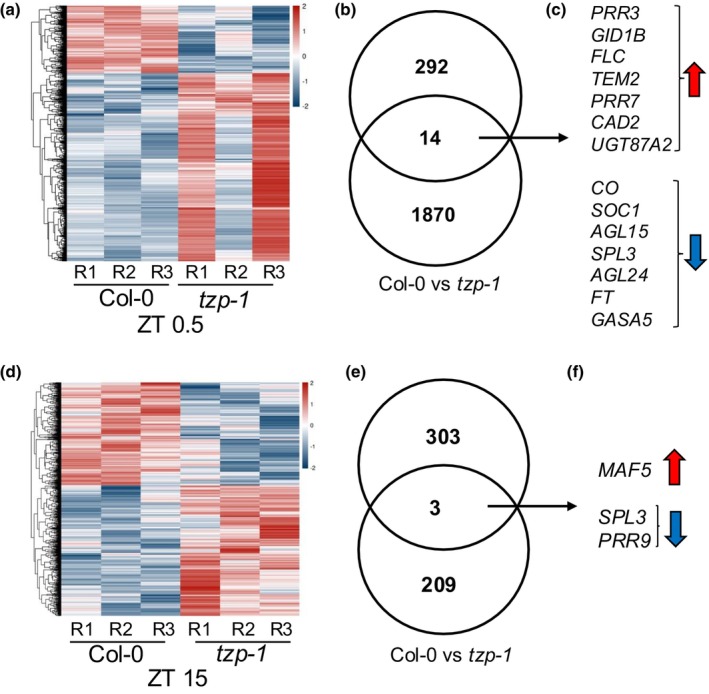 Fig. 2
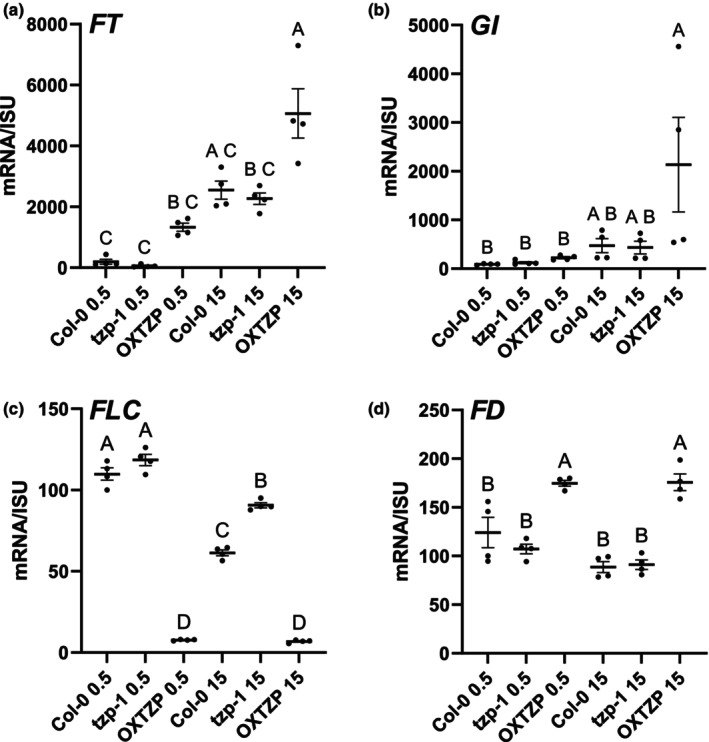 Fig. 3
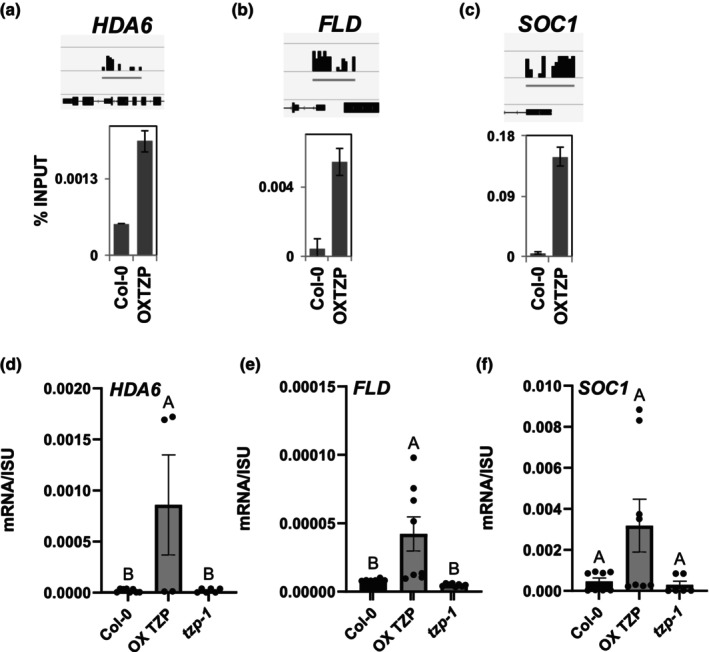 Fig. 4
 Fig. 5
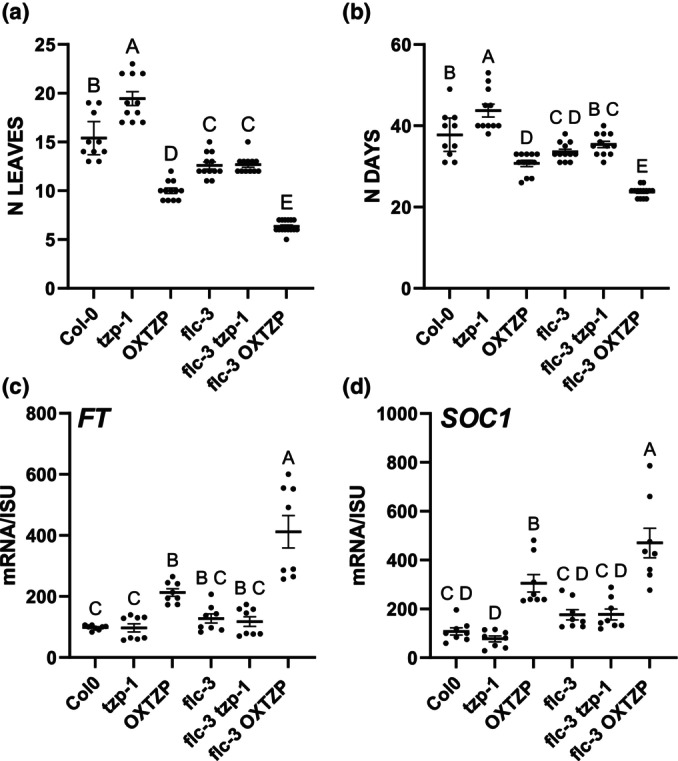 Fig. 6
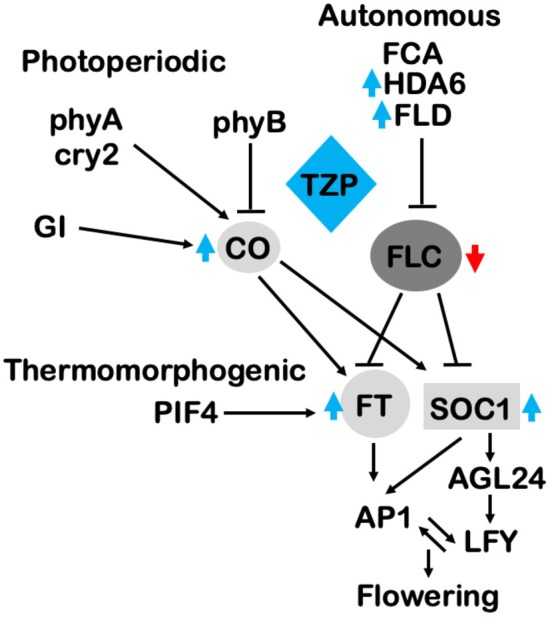 Fig. 7
- —University of Glasgow 10.13039/501100000853
- —Biotechnology and Biological Sciences Research Council 10.13039/501100000268
Peer Reviews
No public reviews on file for this paper yet. If you reviewed it on a platform where reviews are public (OpenReview, ICLR, NeurIPS, ICML), you can paste yours below so the community can read it here.
Videos
No videos yet. Explain this paper in a talk, walkthrough, or lecture? Add one.
Taxonomy
TopicsPlant Molecular Biology Research · Light effects on plants · Plant Gene Expression Analysis
Introduction
Light is a major environmental factor that fine‐tunes different stages of plant development, starting from seed germination and de‐etiolation to the transition from vegetative to reproductive development during flowering initiation (Franklin, 2009; Perrella et al., 2020; Patitaki et al., 2022). Environmental cues, including day length, circadian rhythms and temperature, regulate flowering through different pathways such as vernalization (prolonged cold exposure), photoperiodic and hormone signaling (Reeves & Coupland, 2000; Fernandez et al., 2016). In Arabidopsis, the signaling outputs from distinct flowering cascades are integrated by two major components: FLOWERING LOCUS T (FT) and CONSTANS (CO). FLOWERING LOCUS T is the main florigen whose expression is directly induced by the transcription factor CO (Nogueira et al., 2024; Romero et al., 2024). CONSTANS is a transcription factor that contains a CCT motif and two B‐box type zinc‐finger domains (Nogueira et al., 2024; Romero et al., 2024). SUPPRESSOR OF OVEREXPRESSION OF CONSTANS 1 (SOC1) is a downstream‐flowering integrator mainly expressed in developing leaves and shoot apical meristems (Lee & Lee, 2010). SUPPRESSOR OF OVEREXPRESSION OF CONSTANS 1 expression is also upregulated by CO through FT, while it is repressed by a protein complex consisting of FLOWERING LOCUS C (FLC) and SHORT VEGETATIVE PHASE (Mateos et al., 2015). In addition to the photoperiodic and vernalization control, Arabidopsis flowering initiation is regulated by the autonomous pathway, which comprises a combination of RNA processing and epigenetic events controlling the floral repressor FLC (Wu et al., 2020). FLOWERING LOCUS C encodes a MADS box transcription factor that binds to the FT promoter and represses its expression (Michaels & Amasino, 1999; Sheldon et al., 2000; Whittaker & Dean, 2017; Madrid et al., 2021). This effect of FLC is dose‐dependent, and therefore, FLC works as a rheostat that determines flowering initiation in Arabidopsis in response to external cues (Simpson et al., 1999; Simpson, 2004). FLOWERING LOCUS C itself is regulated by a suite of sophisticated epigenetic, transcriptional and posttranscriptional mechanisms that are highly sensitive to temperature (Whittaker & Dean, 2017). Thus, the autonomous and vernalization pathways promote flowering by facilitating plant responsiveness to the environment. However, there is very limited information on whether environmental stimuli other than temperature, in particular light, influence FLC expression and ultimately its action.
TANDEM ZINC‐FINGER/PLUS3 (TZP) was originally identified as a growth‐promoting factor by quantitative trait locus mapping using Arabidopsis ecotypes (Loudet et al., 2008). Subsequent studies demonstrated that TZP functions as a transcriptional regulator of hypocotyl elongation and flowering initiation in response to specific light regimes (Kaiserli et al., 2015; Huang et al., 2016; Perrella et al., 2018; Zhang et al., 2018; Fang et al., 2022; Li et al., 2022; Feng et al., 2024). Independent studies have revealed that TZP associates with multiprotein nuclear complexes containing light, warm temperature and clock components (such as the evening complex) and directly interacts with the red/far‐red light receptors phytochrome (phy) phyA and phyB in nuclear bodies formed through liquid–liquid phase separation (Kaiserli et al., 2015; Huang et al., 2016; Perrella et al., 2018; Zhang et al., 2018; Fang et al., 2022; Li et al., 2022; Feng et al., 2024). Chromatin immunoprecipitation (ChIP) assays and gene expression analyses have shown that TZP can associate with growth‐ and flowering‐promoting loci, including the FT and CO promoter regions, and thereby inducing their expression in response to a long‐day (LD) photoperiod (Kaiserli et al., 2015).
Here, we uncover a role for TZP in controlling flowering initiation in Arabidopsis at the chromatin level by modulating FLC expression. By combining transcriptomics (RNA‐seq) and whole‐genome ChIP assays (ChIP‐seq) and genetic analysis, we show that TZP controls the expression of several photoperiod – independent flowering genes, including FLC. In addition, we reveal that TZP associates with promoter regions and induces the expression of flowering integrators including SOC1, as well as the chromatin remodelers histone deacetylase (HDA) (Yu et al., 2011) and histone demethylase FLOWERING LOCUS D (FLD) (Chou & Yang, 1998; Yu et al., 2011). Through HDA6 and FLD induction, TZP controls the histone acetylation and methylation status of the FLC locus, which in turn is required for fine‐tuning FLC expression. Altogether, our study positions TZP at the crossroads integrating distinct flowering pathways and provides a new role for light signaling components in modulating the epigenetic status of key regulatory genes in plant development.
Materials and Methods
Plant material and growth conditions
Arabidopsis thaliana wild‐type (WT) and all mutants (tzp‐1, co‐10, axe1‐5, ft‐10 and flc‐3) and transgenic lines are in Col‐0 and have been previously described (Michaels & Amasino, 2001; Probst et al., 2004; Kaiserli et al., 2015; Riboni et al., 2016). Overexpressing (OX) TZP/flc‐3 and OX TZP/ft‐10 were generated by genetic crossing. For all the flowering experiments, Arabidopsis seeds were stratified on soil and kept in the dark at 4°C for 3 d before growing in the conditions described in the figure legends. For RNA and chromatin isolation, seeds were surface‐sterilized and sown on 0.8% agar plates containing ½ Murashige and Skoog salts in the absence of sucrose. Plates were stratified in the dark for 3 d, and plants were grown as described in the figure legends. For ChIP‐seq and RNA‐seq, tissue was collected on Day 12 under LD conditions at the time points indicated in the figure legends.
Flowering measurements
Flowering time experiments were performed in Fitotron® growth rooms under the indicated photoperiod (LDs, 16‐h light /8‐h darkness) at 50–70 μmol m^−2^ s^−1^ white light. Flowering time was monitored by counting the total number of rosette leaves on the day of bolting (appearance of the first flower bud with a stem of 1–2 cm) and by calculating the number of days after germination at the time of bolting. One‐way analysis of variance (ANOVA) with Tukey's multiple comparison post hoc test was performed.
RNA extraction and quantitative RT‐PCR
Total RNA was extracted using RNAeasy plant mini kit (Qiagen). cDNA was synthesized with the QuantiTect reverse transcription kit (Qiagen) following the manufacturer's instructions. Quantitative reverse transcription polymerase chain reaction (RT‐PCR) was performed using a StepOnePlus real‐time machine (Thermofisher) with Brilliant III UltraFast SYBR QPCR Master Mix (Agilent). C t values and standards were analyzed as previously described (Kaiserli et al., 2015). Reactions were performed on four technical replicates and three independent biological replicates. The following cycling conditions were used for quantitative PCR: 2 min at 95°C, 40 cycles of 3 s at 95°C and 30 s at 59.5°C. Melting curve analysis from 60 to 90°C was performed to monitor the specificity of the amplification. Normalization of the quantitative real‐time PCR data was calculated by geometric averaging of the internal reference gene IRON–SULFUR CLUSTER ASSEMBLY PROTEIN 1 (ISU1) (Kaiserli et al., 2015; Petersen et al., 2017). One‐way ANOVA with Tukey's multiple comparison post hoc test was performed.
Chromatin immunoprecipitation
Chromatin immunoprecipitation assays were performed as described previously with minor modifications (Perrella et al., 2018, 2024). A bioruptor sonicator (B01020001; Diagenode, Morris Avenue, NJ, USA) was used to shear the chromatin using the following settings: 40 cycles, 30‐s ON and 30‐s OFF at high power. For immunoprecipitation, the following antibodies were used: anti‐GFP (AbCam, Ab290), anti‐H3K9K14Ac and anti‐H3K4me3 (pAb‐005‐50 and pAb‐003‐50; Diagenode). Chromatin immunoprecipitation–quantitative polymerase chain reaction (ChIP‐qPCR) was performed at the following cycles: 95°C × 3 min, 95°C × 3 s, 59.5°C × 30 s (45 cycles), 95°C × 1 min and 60°C × 30 s (melting curve). Relative enrichment was calculated as described previously (Kaiserli et al., 2015; Perrella et al., 2018). Reactions were performed on four technical replicates and three independent biological replicates. Chromatin immunoprecipitation samples from the three experimental replicates were pooled and subjected to Illumina sequencing (ChIP‐seq). A fourth additional replicate was performed to verify TZP association on selected loci by ChIP‐qPCR. A complete list of primers used for genotyping, quantitative reverse transcription polymerase chain reaction (qRT‐PCR), cloning and ChIP‐qPCR is presented in Supplementary Information Table S1.
Next‐generation sequencing analysis
Next‐generation sequencing analysis of the RNA and ChIP samples was carried out in the Glasgow Polyomics Facility (University of Glasgow). For RNA sequencing, libraries were prepared from total RNA using the Illumina TruSeq Stranded mRNA Sample Preparation Kit. Libraries were sequenced in 75‐base paired‐end mode on the Illumina NextSeq 500 platform. Raw sequence reads were trimmed for contaminating sequence adapters and poor‐quality bases using the program Cutadapt (https://doi.org/10.14806/ej.17.1.200). Bases with an average Phred score lower than 15 were trimmed. Reads that were trimmed to < 54 bases were discarded. The quality of the reads was checked using the Fastqc program (http://www.bioinformatics.babraham.ac.uk/projects/fastqc/) before and after trimming. The reads were ‘pseudo‐aligned’ to the transcriptome using the program Kallisto (Bray et al., 2016). The differential expression for the analysis groups was assessed using the Bioconductor package DESeq2 (Love et al., 2014). Chromatin immunoprecipitation sequencing libraries were sequenced in 75‐base paired‐end mode on the Illumina NextSeq 500 platform. Raw sequence reads were trimmed for contaminating sequence adapters and poor‐quality bases using the program Cutadapt. Bases with an average Phred score lower than 15 were trimmed. Reads that were trimmed to less than 54 bases were discarded. The quality of the reads was checked using the Fastqc program (http://www.bioinformatics.babraham.ac.uk/projects/fastqc/) before and after trimming. The reads were aligned to the reference genome using Bowtie2 (Langmead & Salzberg, 2012). Peaks were called using the Sicer program (Zang et al., 2009) and the peaks annotated using the Bioconductor R package ChIPpeakAnno (Zhu et al., 2010). Interpolation and Venn diagram were created using the online tool Venny 2.1 (bioinfogp.cnb.csic.es/tools/venny/). All RNA‐seq, ChIP‐seq, Gene Ontology (GO) and comparison datasets are listed in Tables [Link], [Link], [Link], [Link], [Link], [Link], [Link], [Link], [Link], [Link], [Link], [Link], [Link], [Link], [Link], [Link], [Link].
Results
TZP promotes flowering through multiple pathways
Previous reports showed that TZP promotes flowering initiation under LD photoperiodic conditions (16 h : 8 h, 22°C, light :dark) (Kaiserli et al., 2015). This was attributed to an increase in FT expression in seedlings OX TZP in Col‐0 and Bay‐0 (Kaiserli et al., 2015). To further investigate the role of TZP in controlling flowering initiation, we monitored flowering time in the tzp mutant (tzp‐1) (Fig. 1a,b) that was characterized previously (Perrella et al., 2018). As anticipated, tzp‐1 exhibited a mildly delayed but statistically significant flowering phenotype compared with WT (Col‐0) as measured by the number of leaves and days at bolting (Figs 1a,b, S1A). Molecular analysis also showed a modest but not statistically significant reduction in the transcript levels of the florigen FT as well as the flowering integrator SOC1 in tzp‐1 compared with WT. Conversely, the expression of both FT and SOC1 was upregulated in OXTZP compared with that in WT, directly correlating with the flowering phenotype (Fig. 1e–h).
TANDEM ZINC‐FINGER/PLUS3 (TZP) promotes flowering initiation partially independent of CONSTANS in Arabidopsis. (a, b) Phenotypic characterization of the number of leaves (a) and the number of days (b) at bolting in Col‐0, tzp‐1 and OXTZP. (c, d) Phenotypic characterization of the number of leaves (c) and the number of days (d) at bolting in genetic crosses between CONSTANS (co) and tzp‐1 or OXTZP. Data are representative of three independent biological replicates. Plants were grown under long‐day (LD = 16 h : 8 h, light : dark) photoperiodic conditions. Data are represented as mean ± 95% confidence interval (n = 10–12 plants). One‐way analysis of variance (ANOVA) with Tukey's multiple comparison post hoc test was performed. (e–h) Reverse transcription quantitative polymerase chain reaction analysis of FT (e–g) and SOC1 (f–h), transcript levels normalized to the housekeeping gene ISU1. Tissue was isolated at ZT 15 on Day 12 under LD white light (50 μmol m−2 s−1). Wild‐type was used as a reference. Data shown are represented as mean ± SE and are representative of four technical replicates out of two biological replicates. One‐way ANOVA with Tukey's multiple comparison post hoc test was performed. Upper case letters indicate statistically significant differences among the groups. Groups that share the same letter are not significantly different from each other, while groups with different letters. FT, FLOWERING LOCUS T; ISU1, IRON–SULFUR CLUSTER ASSEMBLY PROTEIN 1; N Leaves, no. of leaves; OXTZP, overexpression of TANDEM ZINC‐FINGER/PLUS3; SOC1, SUPPRESSOR OF OVEREXPRESSION OF CONSTANS 1; ZT, Zeitgeber Time.
CONSTANS is a major transcriptional regulator of FT; therefore, to assess the genetic relationship between TZP and CO, we introgressed tzp‐1 and OXTZP in the co mutant background. Flowering experiments revealed that, as previously reported, co exhibits delayed flowering compared with WT (Putterill et al., 1995). In addition, co tzp‐1 produced a higher number of leaves at the time of flowering initiation than co (Fig. 1c,d), but the number of days at bolting was not significantly different between co and co tzp‐1. On the contrary, overexpression of TZP in co (co OXTZP) resulted in a significantly earlier flowering initiation phenotype than in co (Fig. 1c,d). Gene expression analysis of FT and SOC1 revealed an upregulation of both genes in co OXTZP compared with that in co, whereas no difference was observed in co tzp‐1 (Fig. 1e–h). These data suggest that TZP controls flowering by modulating FT and SOC1 expression through multiple flowering pathways or partially independent of CO.
TZP controls the expression of flowering components of the photoperiodic and autonomous pathways
To evaluate the genome‐wide role of TZP in regulating gene expression during flowering initiation, we performed transcriptome analysis by RNA sequencing on tissue collected from the 12‐d‐old WT, tzp‐1 (Figs 2, S2A,B) and OXTZP (Figs S2C,D, S3) plants grown under a LD photoperiod at dawn Zeitgeber Time (ZT) 0.5 (dawn) and ZT 15 (dusk). A pair‐wise comparison between Col‐0 and tzp‐1 revealed that the majority of differentially expressed genes (DEGs) with a P‐value ≤ 0.05 were observed at ZT 0.5 (1884 transcripts) (Figs 2a–c, S2A; Table S2). On the contrary, only 212 genes showed a significant difference in expression pattern at ZT 15 (Fig. 2d–f; Table S3). Gene ontology analyses using the software DAVID (Huang et al., 2007; da Huang et al., 2009a,b; Sherman et al., 2022) on transcripts that showed at least 1.5‐fold change difference in expression identified an overrepresentation of targets involved in transcription, response to stress and metabolic processes (Fig. S4D–I; Tables S4– S7). To further investigate the role of TZP in regulating flowering initiation at the transcriptional level, DEGs identified when comparing Col‐0 and tzp‐1 (1884 at ZT 0.5 and 212 at ZT 15) were intersected with the FLOweRing Interacting database (FLOR‐ID) (Bouche et al., 2016). The Venn diagrams shown in Fig. 2b,e depict the overlap between DEGs between Col‐0 and tzp‐1 (lower circle) with FLOR‐ID (upper circle) at ZT 0.5 (Fig. 2b) and ZT 15 (Fig. 2e). The intersection of the Venn diagram (Fig. 2b–c,e–f) provided a list of genes controlled by TZP that are involved in flowering time (14 genes at ZT 0.5 and three genes at ZT 15). A red upward‐facing arrow indicates the upregulated genes in tzp‐1, and a blue downward‐facing arrow for the downregulated genes at ZT 0.5 (Fig. 2c) and ZT 15 (Fig. 2f). The list of TZP‐regulated flowering components contained three key positive regulators FT, CO and SOC1 and the negative regulator of flowering FLC (Fig. 2c). More specifically, FT, CO and SOC1 were downregulated whereas FLC upregulated in tzp‐1 compared with that in WT at dawn (Fig. 2c). Additional members of the MADS‐domain transcription factor family, including AGAMOUS‐LIKE 15 (AGL15) and AGL24, known to act as floral integrators upstream of meristem identity regulators (Lee et al., 2008; Smaczniak et al., 2012) were also shown to be downregulated in the absence of functional TZP. On the contrary, the floral repressor TEMPRANILLO 2 and the circadian clock components PSEUDO RESPONSE REGULATOR (PRR) 3 and PRR7 (Ratcliffe et al., 2003) were upregulated in tzp‐1 compared with WT at dawn. The role of TZP at dusk (ZT 15) was less apparent since only three flowering components were differentially regulated in tzp‐1 compared with WT (Fig. 2d–f). More specifically, the FLC paralog MADS AFFECTING FLOWERING 2 (MAF2) (Ratcliffe et al., 2003) was upregulated, whereas PRR9 and the transcriptional activators of flowering SQUAMOSA PROMOTER‐BINDING PROTEIN‐LIKE 3 (SPL3) (Jung et al., 2016) were downregulated in the absence of functional TZP at ZT 15 (Fig. 2d–f).
RNA‐seq identifies novel TANDEM ZINC‐FINGER/PLUS3 (TZP)‐regulated targets involved in flowering regulation in Arabidopsis. (a, d) Hierarchical clustering of differentially expressed genes (DEGs) between the indicated genotypes. Heatmaps depict the expression profile of differentially regulated genes between Col‐0 and tzp‐1 at ZT 0.5 (a) and ZT 15 (d) (P‐value < 0.05; the color shades depict the Z‐score expression values, with blue as lower expression and red as higher; R1,2,3 depict the results from three biological replicates). Differentially expressed genes identified when comparing Col‐0 and tzp‐1 at ZT 0.5 (b, c) and ZT 15 (e, f) were intersected with the list of flowering genes from the FLOweRing Interacting database (FLOR‐ID; Bouche et al., 2016). (b, e) Venn diagrams showing the overlap between DEGs between Col‐0 and tzp‐1 (lower circle) with FLOR‐ID (upper circle) at ZT 0.5 (b) and at ZT 15 (e). (c, f) List of differentially regulated flowering genes from the FLOR‐ID database between Col‐0 and tzp‐1 at ZT 0.5 (c) and at ZT 15 (f). The red up arrow indicates upregulated genes, and the blue down arrow indicates downregulated genes. Interpolation and Venn diagram were created using the online tool Venny 2.1 (bioinfogp.cnb.csic.es/tools/venny/). R, replicate; vs, versus; ZT, Zeitgeber Time.
Transcriptome analysis between Col‐0 and OXTZP showed a much greater number of genes differentially regulated between the two genotypes than in tzp‐1. At ZT 0.5, 5210 transcripts exhibited a significant expression between Col‐0 and OXTZP, while at ZT 15, the number of DEGs decreased to 3948 (Fig. S3B,C, E,F; Tables S8– S12). Consistent with tzp‐1, OXTZP also showed more apparent differences at dawn rather than at dusk. Gene ontology analysis conducted by DAVID indicated that TZP‐regulated genes were classified in gene clusters including response to hormones, transcription and metabolic processes (Fig. S4J–O; Tables S13– S16). Intersecting the differentially regulated genes between OXTZP and WT with the FLOR‐ID database showed an increase in the transcript levels of positively regulating flowering components including FT and SOC1 at dawn (Fig. S3B,C) oppositely to the pattern observed for tzp‐1, showing a decrease in FT and SOC1 mRNA (Fig. 2b,c). In addition, RNA sequencing analysis revealed that the flowering‐promoting bZIP transcription factor FD (Jung et al., 2016; Gorham et al., 2018; Zhu et al., 2020) was upregulated in OXTZP (Fig. S3F). The circadian clock components PRR3 and PRR5 (Farre & Liu, 2013) were upregulated in OXTZP at ZT 0.5 and in PRR7 at ZT 15, respectively (Fig. S3C,F) whereas GIGANTEA (GI) (Liu et al., 2024) was upregulated specifically at ZT 15 (Fig. S3F). Contrary to our findings for tzp‐1, SPL3 and SPL9 were upregulated in OXTZP, whereas SPL3 was downregulated in tzp‐1 (Figs S3F, 2c,f). The flowering repressor FLC was also found to be differentially expressed in OXTZP showing a decrease in mRNA levels compared with that in WT at both ZT 0.5 and ZT 15 (Fig. S3C,F) following an opposite trend to the upregulation that was observed in tzp‐1 (Fig. 2c). To verify the findings from the RNA‐seq experiments on WT, tzp‐1 and OXTZP, RT‐qPCR assays were conducted and verified the effect of TZP on the FLC expression pattern at both dawn and dusk (Fig. 3c), with a more pronounced regulation at ZT 15 as previously reported for FT (Fig. 3a; Kaiserli et al., 2015). On the contrary, the expression of FD and the evening complex components GI were only upregulated in OXTZP either at ZT 15 (GI) or at both time points (FD) (Fig. 3b,d). Thus, our data show that TZP acts as a positive regulator of flowering by controlling the expression levels of a diverse array of flowering integrators operating photoperiod‐dependent and photoperiod‐independent pathways.
TANDEM ZINC‐FINGER/PLUS3 (TZP) regulates the expression of flowering genes operating in the photoperiodic and autonomous pathways in Arabidopsis. (a–d) Validation of selected genes identified by RNA‐seq using quantitative reverse transcription polymerase chain reaction. Plants were grown under a long‐day photoperiod (white light 50 μmol m−2 s−1). Plant tissue was collected after 12 d at ZT 0.5 and ZT 15. The expression of genes involved in flowering regulation including FT (a), GI (b), FLC (c) and FD (d) was monitored in Col‐0, tzp‐1 and OXTZP at ZT 0.5 and ZT 15. Transcript levels were normalized with housekeeping gene ISU1. Col‐0 (WT) was used as a reference. Data are presented as mean ± SE. One‐way analysis of variance with Tukey's multiple comparison post hoc test was performed. Upper case letters indicate statistically significant differences among the groups. Groups that share the same letter are not significantly different from each other, while groups with different letters. FLC, FLOWERING LOCUS C; FT, FLOWERING LOCUS T; ISU1, IRON–SULFUR CLUSTER ASSEMBLY PROTEIN 1; OXTZP, Overexpression of TANDEM ZINC‐FINGER/PLUS3; ZT, Zeitgeber Time.
TZP associates with promoter regions during flowering induction
TANDEM ZINC‐FINGER/PLUS3 has been reported to bind promoter elements of light and photoperiod‐regulated genes, including FT (Kaiserli et al., 2015; Perrella et al., 2018). Therefore, to identify genome‐wide TZP‐associated loci potentially involved in TZP‐controlled flowering initiation, we performed ChIP coupled with next‐generation sequencing on 12‐d‐old GFP‐tagged TZP (OXTZP) and control WT plants grown under a LD photoperiod at two different time points: ZT 0.5 and ZT 15. Relative binding‐peak distribution of ChIP‐seq data revealed that TZP associates primarily with promoters and the first exon regions at both time points, with 67% and 80% of the genomic binding sites spanning within these regions, respectively (Fig. S5; Table S17). Data analysis revealed that 92 loci were bound by TZP at both ZT 0.5 and ZT 15, while 418 and 610 loci were bound by TZP at ZT 0.5 or ZT 15, respectively (Fig. S5B). De novo analysis using Homer (http://homer.ucsd.edu/homer/motif/) for identifying consensus motifs enriched within the promoter‐binding peaks of TZP at ZT 0.5 and ZT 15 identified G‐box‐like elements (CACGTG) and the TATA motif required for transcriptional initiation (Fig. S5C) (Yamamoto et al., 2009; Liu et al., 2013; Ezer et al., 2017). Filtering of TZP‐associated target loci through FLOR‐ID revealed 16 flowering‐related genes, including SOC1, the autonomous pathway components HDA6 and the histone demethylase FLD (Fig. S5D,E) (Chou & Yang, 1998; Yu et al., 2011). Moreover, TZP was found to associate with the promoters of the clock components CIRCADIAN CLOCK‐ASSOCIATED 1 (Green & Tobin, 1999) and LATE ELONGATED HYPOCOTYL (Schaffer et al., 1998) (Fig. S5D,E). To investigate whether the association of TZP with promoter regions leads to changes in gene expression, we verified selected ChIP‐seq targets (HDA6, FLD and SOC1) by ChIP‐qPCR (Fig. 4a–c; Table S17). In addition, we investigated the effect of TZP binding on the transcript levels of HDA6, FLD and SOC1 by RT‐qPCR and showed their upregulation in OXTZP and downregulation in tzp‐1 compared with that in WT (Fig. 4d–f). Furthermore, a comparison of the differentially regulated genes between tzp‐1 and Col‐0 as well as OXTZP and Col‐0 with the list of TZP‐associated loci identified from ChIP‐seq experiments was conducted (Fig. S5H,I; Table S18) and showed that, in addition to components operating in hormone and clock pathways, SOC1, a key floral integrator of photoperiod, temperature, hormones and age‐related pathways (Lee & Lee, 2010), is directly regulated by TZP and differentially expressed in tzp‐1 and OXTZP compared with that in WT, which highlights the role of TZP in modulating flowering in response to diverse endogenous and environmental stimuli. In summary, our experiments reveal that TZP associates with promoter regions and regulates the expression of flowering genes operating at the chromatin level in response to environmentally controlled and endogenous pathways (Figs 4, S5). Notably, we revealed a direct link between TZP and the flowering integrator SOC1, proving its importance in the regulation of plant development.
TANDEM ZINC‐FINGER/PLUS3 directly regulates the expression of chromatin regulators operating in the autonomous flowering pathway in Arabidopsis. (a–f) Validation of selected ChIP‐seq and RNA‐seq targets including HDA6, FLD and SOC1 by chromatin immunoprecipitation–quantitative polymerase chain reaction (a–c) and reverse transcription quantitative polymerase chain reaction (d–f). Plants were grown in long‐day photoperiodic conditions (white light 50 μmol m−2 s−1) for 12 d. (d–f) Data shown are shown as mean ± SE. (n = 8 replicates). One‐way analysis of variance with Tukey's multiple comparison post hoc test was performed. Upper case letters indicate statistically significant differences among the groups. Groups that share the same letter are not significantly different from each other, while groups with different letters. FLD, FLOWERING LOCUS D; FT, FLOWERING LOCUS T; HDA6, HISTONE DEACETYLASE 6; ISU1, IRON–SULFUR CLUSTER ASSEMBLY PROTEIN 1; OXTZP, overexpression of TANDEM ZINC‐FINGER/PLUS3; SOC1, SUPPRESSOR OF OVEREXPRESSION OF CONSTANS 1.
TZP negatively regulates the expression of
FLC at the chromatin level
Data obtained from the ChIP‐seq and ChIP‐qPCR analyses showed that TZP binds to the promoter of the flowering regulator SOC1 and the autonomous pathway chromatin‐modifying enzymes HDA6 and FLD to induce their expression (Figs 4, S5E). Histone deacetylase 6 is a HDA with an established function in repressing gene expression to control leaf development and flowering (Yu et al., 2011; Luo et al., 2012; Tan et al., 2018). With respect to flowering time, the hda6 mutant allele axe1‐5 exhibits delayed flowering in response to both LD and short day (SD) photoperiodic conditions, with a more pronounced phenotype in the latter than in the former (Yu et al., 2011) FLOWERING LOCUS D is a histone demethylase that contains a SWIRM domain, known for mediating protein–protein interactions within chromatin modification complexes (Chou & Yang, 1998; He et al., 2003; Yu et al., 2011). Similar to axe1‐5, fld lines exhibit a late‐flowering phenotype in LD and SD conditions. Double‐mutant axe1‐5 fld lines show an even more pronounced delay in flowering than each single mutant and WT, suggesting an additive or synergistic role for the two genes (Yu et al., 2011). Gene expression analyses in the single and double mutants revealed an upregulation in FLC transcript abundance as well as in the MADS box genes MAF4 and MAF5 belonging to the FLC phylogenetic clade (Yu et al., 2011; Gu et al., 2013). Furthermore, axe1‐5 and fld display global as well as locus‐dependent H3 hyperacetylation and H3 hypermethylation on FLC, MAF4 and MAF5 loci (Yu et al., 2011).
Since TZP is a positive regulator of HDA6 and FLD expression, we hypothesized that TZP is controlling FLC transcript abundance by influencing the acetylation and methylation status of the FLC promoter. To test this, we performed ChIP‐qPCR using anti‐H3K9K14Ac and H3K4me3 antibodies in WT (Col‐0), OXTZP, tzp‐1 and axe1‐5 lines. Our ChIP‐qPCR data revealed an increase in H3K9K14Ac acetylation on the first exon and intron of FLC in axe1‐5, agreeing with previous reports (Yu et al., 2011). Chromatin immunoprecipitation–quantitative polymerase chain reaction spanning different regions of the FLC locus (Fig. 5a) determined that primarily the promoter and TSS regions of FLC showed reduced H3K9K14Ac and H3K4me3 levels in OXTZP, while an increase was observed in tzp‐1 at ZT 0.5 or ZT 15 compared with that in WT (Fig. 5b,c). As previously reported for axe1‐5, we observed hyperacetylation at dawn and dusk, while an increase in histone methylation was not evident compared with that in WT (Fig. 5d,e).
TANDEM ZINC‐FINGER/PLUS3 (TZP) regulates the acetylation and methylation status of histone tails on the Arabidopsis FLOWERING LOCUS C (FLC) locus. (a) Schematic representation of the FLC locus depicting the regions under investigation by chromatin immunoprecipitation–quantitative polymerase chain reaction. (b–d) Relative H3K9K14Ac (b–c) and H3K4me3 (d–e) enrichment in Col‐0, OX TZP, tzp‐1 and axe1‐5, at ZT 0.5 (b–d) and ZT 15 (c–e), respectively. The 3′ untranslated region was used as a negative control. Seedlings were grown in white light (75 mmol m−2 s−1), and samples were harvested at ZT 0.5 and ZT 15 of Day 12. Error bars are mean ± SE (n = 4 technical replicates). Graphs shown are representative of two independent biological repeats. FLC, FLOWERING LOCUS C; H3K4me3, trimethylation of lysine 4 on histone H3; H3K9K14Ac, acetylation of lysines 9 and 14 on histone H3; OXTZP, overexpression of TANDEM ZINC‐FINGER/PLUS3; TSS, transcriptional start site; ZT, Zeitgeber Time.
Thus, we provide evidence that TZP represses FLC transcript levels by promoting the expression of HDA6 and FLD, which subsequently regulate FLC chromatin compaction by removing histone acetylation and methylation marks on the TSS of FLC. Contrary to FLC, no TZP‐mediated effect was observed in the H3K9K14Ac and H3K4me3 status of the TZP‐regulated flowering repressor TEMPRANILLO 1 (TEM1) (Castillejo & Pelaz, 2008; Hu et al., 2021) (Fig. S6), suggesting that the role of TZP in modulating H3 acetylation and methylation is specific to FLC.
To understand the physiological relevance of TZP in controlling FLC expression, we performed a genetic cross between the flc‐3 mutant in Col‐0 and tzp‐1 or OXTZP and monitored flowering initiation in LD at ambient temperature. Flc‐3 and flc‐3 tzp‐1 exhibited earlier flowering phenotypes than WT (Fig. 6a,b). No significant difference was observed in flc‐3 tzp‐1 compared with that in flc‐3 (Fig. 6a,b). Interestingly, overexpression of TZP in flc‐3 (OXTZP flc‐3) resulted in a statistically significant earlier flowering phenotype than in flc‐3 (Fig. 6a,b). Furthermore, qRT‐PCR showed an increase in the induction of FT and SOC1 transcript levels in OXTZP flc‐3 compared with that in flc‐3 and WT (Fig. 6c,d), thereby providing a molecular basis for the phenotypic data (Fig. 6a,b). Conversely, introgression of OXTZP in the ft‐10 mutant background showed a statistically significant reduction in flowering time compared with ft‐10 (Fig. S7A,B). SOC1 induction was reduced in ft‐10 and ft‐10 tzp‐1 while we observed a small increase in SOC1 levels in ft‐10 OXTZP compared with that in ft‐10 (Fig. S7C). Thus, our data indicate that the mutation in FLC allows a greater induction of flowering genes, suggesting that TZP action is not solely based on the FLC expression status, but it largely depends on the abundance and presence of FT.
TANDEM ZINC‐FINGER/PLUS3 (TZP) overexpression enhances the early flowering phenotype of flc mutant in Arabidopsis. (a, b) Phenotypic characterization of flowering time (number of leaves at the time of bolting) in genetic crosses between flc‐3 and tzp‐1 or OXTZP. Plants were grown under long‐day (LD) 16 h : 8 h, light : dark photoperiodic conditions. Data are represented as mean ± 95% confidence interval (n = 10 plants). Data are representative of two biological replicates. One‐way analysis of variance (ANOVA) with Tukey's multiple comparison post hoc test was performed. (c, d) Reverse transcription quantitative polymerase chain reaction analysis of FT (c) and SOC1 (d) transcript levels normalized to the housekeeping gene ISU1. Tissue was isolated at ZT 15 on Day 12 under LD white light (50 μmol m−2 s−1). Wild‐type was used as a reference. Data shown are represented as mean ± SE and are representative of technical replicates out of two biological replicates. One‐way ANOVA with Tukey's multiple comparison post hoc test was performed. Upper case letters indicate statistically significant differences among the groups. Groups that share the same letter are not significantly different from each other, while groups with different letters. FT, FLOWERING LOCUS T; ISU1, IRON–SULFUR CLUSTER ASSEMBLY PROTEIN 1; N Leaves, no. of leaves; OXTZP, overexpression of TANDEM ZINC‐FINGER/PLUS3; SOC1, SUPPRESSOR OF OVEREXPRESSION OF CONSTANS 1; ZT, Zeitgeber Time.
Altogether, our findings uncover a new mechanism of TZP action, providing a link between light signaling and the autonomous pathway at the chromatin level to control flowering initiation in Arabidopsis.
Discussion
We previously reported that TZP promotes flowering in response to LDs by binding to the promoter of FT and upregulating its expression in a phyB‐dependent manner (Kaiserli et al., 2015). To further explore the function of TZP in the transcriptional regulation of flowering, we employed a genome‐wide chromatin association study and transcriptome analysis approach. RNA sequencing and ChIP sequencing revealed that FT is upregulated in OXTZP, as previously reported (Kaiserli et al., 2015), and downregulated in tzp‐1 (Figs 2C, S3C). Furthermore, flowering‐regulating genes including SOC1, FD and GI were shown to be controlled by TZP (Figs 2C, S3C,F, 3a–d). Unexpectedly, the flowering repressor FLC, which is controlled by the vernalization and autonomous pathways, was shown to be negatively regulated by TZP (Figs 2c, S3C,F). This discovery prompted us to explore a new role for TZP in integrating light signaling with flowering regulation pathways. ChIP‐seq analysis revealed that TZP associates with promoter regions and controls the expression of positive (GI, SOC1, HDA6 and FLD) as well as negative (TEM1) regulators of flowering operating through the photoperiodic, aging, hormone, vernalization and autonomous pathways (Fig. S5) (Castillejo & Pelaz, 2008; Lee & Lee, 2010; Yu et al., 2011; Osnato et al., 2012). There are limited reports indicating a crosstalk between light signaling and autonomous flowering pathways through the interaction between phyB and PHY‐DEPENDENT LATE‐FLOWERING (PHL) or VASCULAR PLANT ONE‐ZINC‐FINGER 2, respectively (Endo et al., 2013; Qu et al., 2024). However, both mechanisms rely on the action of CO. Here, we provide evidence for a TZP‐mediated integration of photoperiodic and autonomous flowering pathways through a direct association with flowering‐regulating and chromatin‐remodeling loci.
As previously mentioned, TZP was shown to downregulate the expression of FLC (Fig. 3c), but no TZP association was observed with the FLC locus based on ChIP‐seq analysis. However, our data showed that TZP binds to the promoters and induces the expression of the autonomous pathway components FLD and HDA6 (Figs 4a,b,d,e, S5E) known to repress the expression of FLC through modulating its chromatin environment (Yu et al., 2011). Our study unveils that TZP indirectly influences the epigenetic status of FLC by increasing repressive histone marks on the FLC locus, while tzp‐1 displays an increase in active histone marks including H3K9K14 acetylation and H3K4 methylation (Figs 5, 7).
TANDEM ZINC‐FINGER/PLUS3 (TZP) is a positive regulator of flowering initiation by integrating light signaling and flowering pathways in Arabidopsis. TANDEM ZINC‐FINGER/PLUS3 induces the expression of key flowering regulators including FT, CO and SOC1. FT expression is induced via a direct association of TZP with the FT promoter (Kaiserli et al., 2015). Additionally, TZP indirectly contributes to the epigenetic silencing of the flowering repressor FLC by inducing the expression of the histone deacetylase HDA6 and the histone demethylase FLD that in turn modulate the chromatin compaction of the FLC locus (Yu et al., 2011). AGL, AGAMOUS‐LIKE; AP1, APETALA 1; CO, CONSTANS; CRY, CRYPTOCHROME; FCA, FLOWERING TIME CONTROL A; FLC, FLOWERING LOCUS C; FLD, FLOWERING LOCUS D; FT, FLOWERING LOCUS T; GI, GIGANTEA; HDA6, HISTONE DEACETYLASE 6; LFY, LEAFY; PHY, PHYTOCHROME; PIF4, PHYTOCHROME INTERACTING FACTOR 4; SOC1, SUPPRESSOR OF OVEREXPRESSION OF CONSTANS 1; TZP, TANDEM ZINC‐FINGER/PLUS3. Red downward arrow defines downregulation; Blue upward arrow denotes upregulation; black line arrow indicates activation; black blunt‐ended arrows denote inhibition.
The epigenetic regulation of FLC is well‐established (Whittaker & Dean, 2017), but our knowledge of how the chromatin‐remodeling complexes influencing FLC expression are regulated is very limited. We have uncovered that TZP plays a role in controlling flowering time by modulating the expression of key histone‐modifying enzymes and therefore regulating gene expression at the epigenetic level with respect to FLC. Whether TZP controls the epigenetic status of other flowering or growth‐promoting factors remains to be established.
Although TZP has been reported to act as a positive regulator of gene expression for targets related to growth (Perrella et al., 2018) and flowering (Kaiserli et al., 2015), the presence of a putative EAR motif known to recruit transcriptional corepressors in plants (Kagale & Rozwadowski, 2011) suggests an alternative function for TZP as a negative regulator of gene expression. Furthermore, TZP contains a PLUS3 domain with functions in cotranscriptional splicing, transcriptional elongation and chromatin remodeling in yeast and human proteins (de Jong et al., 2008; Wier et al., 2013; Cao et al., 2015). More specifically, the yeast PLUS3 domain containing protein Rtf1 is part of the Paf1 complex, which regulates histone ubiquitination, methylation and RNA 3′ end processing (de Jong et al., 2008; Wier et al., 2013; Cao et al., 2015). The Arabidopsis Paf1 complex induces FLC expression through H3 methylation (Yu & Michaels, 2010). Since TZP contains a PLUS3 domain and represses FLC through epigenetic regulation, it would be informative to assess whether TZP interacts with components of the Paf1 complex. Furthermore, TZP is known to interact with phyB (Kaiserli et al., 2015; Fang et al., 2022), and PHY is reported to facilitate the formation of a repressive chromatin loop by interacting with a component of the Polycomb Repressing complex2 (PRC2), VERNALIZATION‐INSENSITIVE 3‐LIKE1/VERNALIZATION 5 (VIL1/VRN5), leading to the repression of growth‐promoting genes including ATHB2 (Kim et al., 2021). Since VIL1 is involved in controlling FLC repression and flowering, it would be interesting to investigate whether TZP operates in the same complex as phyB and VIL1 and whether they play a role in the vernalization pathway.
Overall, this study identifies a molecular mechanism in which TZP promotes flowering by indirectly controlling the silencing of the flowering repressor FLC that operates through the autonomous pathway (Fig. 7). In conclusion, these findings further unravel how light and temperature signals are perceived and integrated to obtain optimal plant growth and development and support the idea of TZP as a multifaceted transcriptional integrator of not only environmental but also endogenous stimuli.
Competing interests
None declared.
Author contributions
EK and GP directed the research and designed the experiments. GP and EV performed the experiments and analyzed the data. GH, AB and PH performed next‐generation sequencing and bioinformatics analysis. GP, GH, EV and EK wrote the manuscript. GP and EV contributed equally to this work.
Disclaimer
The New Phytologist Foundation remains neutral with regard to jurisdictional claims in maps and in any institutional affiliations.
Supporting information
Fig. S1 Representative images of flowering assays shown in Fig. 1. Fig. S2 Plots visualizing differentially expressed genes of the RNA‐seq data shown in Fig. 2. Fig. S3 RNA‐seq data analysis on Col‐0 and OXTZP. Fig. S4 Gene ontology analysis of differentially regulated genes. Fig. S5 Identification of promoter motifs and between ChIP‐seq and RNA‐seq TANDEM ZINC‐FINGER/PLUS3 targets. Fig. S6 Control of the methylation and acetylation status of the TEMPRANILLO 1 locus by TANDEM ZINC‐FINGER/PLUS3. Fig. S7 Flowering assays and gene expression analysis of genetic crosses between OXTZP and FLOWERING LOCUS T. Table S1. List of primers used in this study.
Table S2 Comparison between Col‐0 and tzp‐1 RNA‐seq datasets at Zeitgeber 0.5 associated with Fig. 2.
Table S3 Comparison between Col‐0 and tzp‐1 RNA‐seq datasets at Zeitgeber 15 associated with Fig. 2.
Table S4 Gene ontology analysis of the upregulated genes between Col‐0 and tzp‐1 identified by RNA‐seq at Zeitgeber 0.5 associated with Fig. S4.
Table S5 Gene ontology analysis of the downregulated genes between Col‐0 and tzp‐1 identified by RNA‐seq at Zeitgeber 0.5 associated with Fig. S4.
Table S6 Gene ontology analysis of the upregulated genes between Col‐0 and tzp‐1 identified by RNA‐seq at Zeitgeber 15 associated with Fig. S4.
Table S7 Gene ontology analysis of the downregulated genes between Col‐0 and tzp‐1 identified by RNA‐seq at Zeitgeber 15 associated with Fig. S4.
Table S8 Comparison between Col‐0 Zeitgeber 0.5 and 15 RNA‐seq datasets associated with Fig. S3.
Table S9 Comparison between Col‐0 and OXTZP RNA‐seq datasets at Zeitgeber 0.5 associated with Fig. S3.
Table S10 Comparison between Col‐0 and OXTZP RNA‐seq datasets at Zeitgeber 15 associated with Fig. S3.
Table S11 Comparison between OXTZP and TANDEM ZINC‐FINGER/PLUS3 RNA‐seq datasets at Zeitgeber 0.5 associated with Fig. S3.
Table S12 Comparison between OXTZP and TANDEM ZINC‐FINGER/PLUS3 RNA‐seq datasets at Zeitgeber 15 associated with Fig. S3.
Table S13 Gene ontology analysis of the upregulated genes between Col‐0 and OXTZP identified by RNA‐seq at Zeitgeber 0.5 associated with Fig. S4.
Table S14 Gene ontology analysis of the downregulated genes between Col‐0 and OXTZP identified by RNA‐seq at Zeitgeber 0.5 associated with Fig. S4.
Table S15 Gene ontology analysis of the upregulated genes between Col‐0 and OXTZP identified by RNA‐seq at Zeitgeber 15 associated with Fig. S4.
Table S16 Gene ontology analysis of the downregulated genes between Col‐0 and OXTZP identified by RNA‐seq at Zeitgeber 15 associated with Fig. S4.
Table S17 TANDEM ZINC‐FINGER/PLUS3 targets identified by ChIP‐seq at Zeitgeber 0.5 and 15 associated with Figs 4, S5.
Table S18 Overlap of TANDEM ZINC‐FINGER/PLUS3 targets identified by RNA‐seq and ChIP‐seq at Zeitgeber 0.5 and 15 associated with Fig. S5.Please note: Wiley is not responsible for the content or functionality of any Supporting Information supplied by the authors. Any queries (other than missing material) should be directed to the New Phytologist Central Office.
The reference list from the paper itself. Each links out to its DOI / PubMed record.
- 1Bouche F , Lobet G , Tocquin P , Perilleux C . 2016. FLOR‐ID: an interactive database of flowering‐time gene networks in Arabidopsis thaliana . Nucleic Acids Research 44(D 1): D 1167–D 1171.26476447 10.1093/nar/gkv 1054 PMC 4702789 · doi ↗ · pubmed ↗
- 2Bray NL , Pimentel H , Melsted P , Pachter L . 2016. Near‐optimal probabilistic RNA‐seq quantification. Nature Biotechnology 34: 525–527.10.1038/nbt.351927043002 · doi ↗ · pubmed ↗
- 3Cao QF , Yamamoto J , Isobe T , Tateno S , Murase Y , Chen Y , Handa H , Yamaguchi Y . 2015. Characterization of the human transcription elongation factor Rtf 1: evidence for nonoverlapping functions of Rtf 1 and the Paf 1 complex. Molecular and Cellular Biology 35: 3459–3470.26217014 10.1128/MCB.00601-15PMC 4573716 · doi ↗ · pubmed ↗
- 4Castillejo C , Pelaz S . 2008. The balance between CONSTANS and TEMPRANILLO activities determines FT expression to trigger flowering. Current Biology 18: 1338–1343.18718758 10.1016/j.cub.2008.07.075 · doi ↗ · pubmed ↗
- 5Chou ML , Yang CH . 1998. FLD interacts with genes that affect different developmental phase transitions to regulate Arabidopsis shoot development. The Plant Journal 15: 231–242.9721681 10.1046/j.1365-313x.1998.00204.x · doi ↗ · pubmed ↗
- 6Endo M , Tanigawa Y , Murakami T , Araki T , Nagatani A . 2013. PHYTOCHROME‐DEPENDENT LATE‐FLOWERING accelerates flowering through physical interactions with phytochrome B and CONSTANS. Proceedings of the National Academy of Sciences, USA 110: 18017–18022.10.1073/pnas.1310631110 PMC 381648924127609 · doi ↗ · pubmed ↗
- 7Ezer D , Jung JH , Lan H , Biswas S , Gregoire L , Box MS , Charoensawan V , Cortijo S , Lai X , Stockle D et al. 2017. The evening complex coordinates environmental and endogenous signals in Arabidopsis. Nature Plants 3: 17087.28650433 10.1038/nplants.2017.87PMC 5495178 · doi ↗ · pubmed ↗
- 8Fang W , Vellutini E , Perrella G , Kaiserli E . 2022. TANDEM ZINC‐FINGER/PLUS 3 regulates phytochrome B abundance and signaling to fine‐tune hypocotyl growth. Plant Cell 34: 4213–4231.35929801 10.1093/plcell/koac 236PMC 9614508 · doi ↗ · pubmed ↗