Transcriptome sequencing data sets of Escherichia coli K-12 MG1655 treated with novobiocin, tetracycline, and rifampicin
Alexander Balkin, Andrey Plotnikov, Tatiana Konnova, Elena Shagimardanova, Hamza Hamo, Yuri Gogolev, Natalia Gogoleva

TL;DR
This study provides gene expression data from E. coli treated with antibiotics to better understand bacterial resistance mechanisms.
Contribution
The novelty lies in identifying gene clusters responding to specific antibiotic treatments in E. coli.
Findings
Gene clusters responding to RNA synthesis inhibition were identified.
Genes reacting to protein synthesis inhibition were detected.
Genes affected by DNA gyrase inhibition were found.
Abstract
This report presents transcriptome datasets for Escherichia coli MG1655 treated with novobiocin, rifampicin, and tetracycline. Clusters of genes that respond to inhibition of RNA synthesis, protein synthesis, and DNA gyrase activity have been identified. The data may help to understand the mechanisms of general and specific resistance in E. coli.
Genes, proteins, chemicals, diseases, species, mutations and cell lines named across the full text — each resolved to its canonical identifier and authoritative record.
Click any figure to enlarge with its caption.
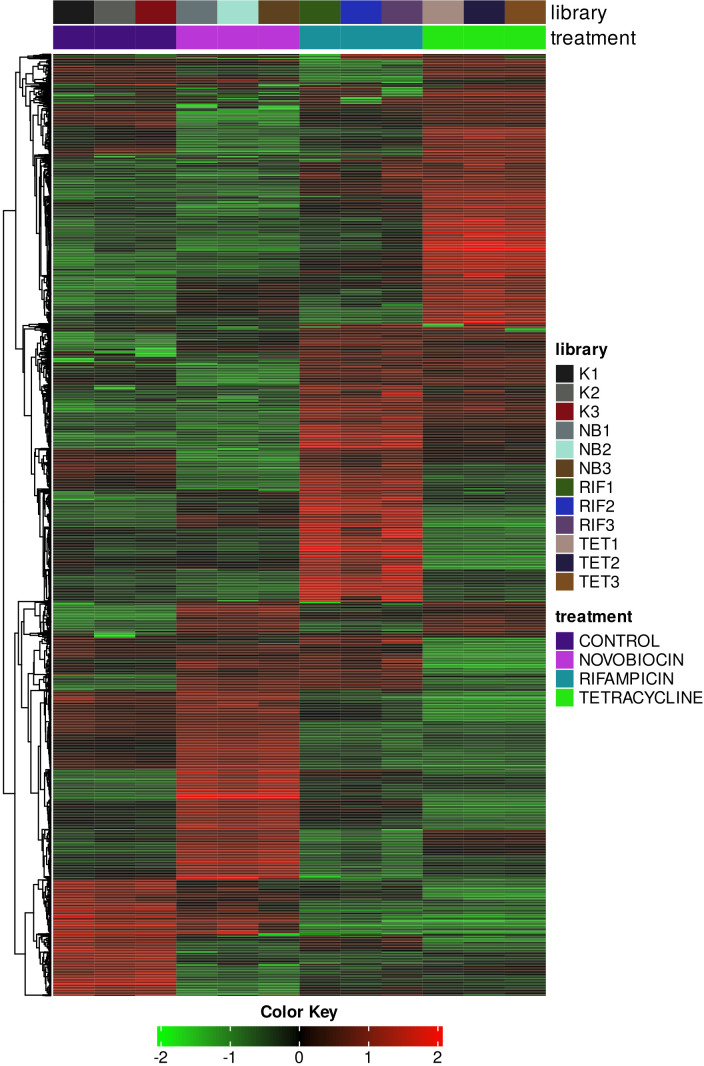 Fig 1
Fig 1| Sample | Treatment | No. of clean mapped reads | SRA accession no. | GEO accession no. |
|---|---|---|---|---|
| K1 | Control | 10,540,158 |
|
|
| K2 | Control | 9,319,226 |
|
|
| K3 | Control | 9,149,460 |
|
|
| Nb1 | 100 mg/L novobiocin | 10,616,875 |
|
|
| Nb2 | 100 mg/L novobiocin | 10,212,412 |
|
|
| Nb3 | 100 mg/L novobiocin | 10,016,476 |
|
|
| Rif1 | 50 mg/L rifampicin | 9,785,875 |
|
|
| Rif2 | 50 mg/L rifampicin | 10,675,174 |
|
|
| Rif3 | 50 mg/L rifampicin | 9,588,376 |
|
|
| Tet1 | 12.5 mg/L tetracycline | 11,029,252 |
|
|
| Tet2 | 12.5 mg/L tetracycline | 10,427,468 |
|
|
| Tet3 | 12.5 mg/L tetracycline | 10,379,156 |
|
|
- —Russian Science Foundationhttp://dx.doi.org/10.13039/501100006769
Peer Reviews
No public reviews on file for this paper yet. If you reviewed it on a platform where reviews are public (OpenReview, ICLR, NeurIPS, ICML), you can paste yours below so the community can read it here.
Videos
No videos yet. Explain this paper in a talk, walkthrough, or lecture? Add one.
Taxonomy
TopicsBacterial Genetics and Biotechnology · Antibiotic Resistance in Bacteria · RNA and protein synthesis mechanisms
ANNOUNCEMENT
Escherichia coli MG1655 is a model organism for which detailed genomic information is available and extensive transcriptomic analyses have been performed (1–4). Like many enterobacteria, E. coli is resistant to novobiocin (5, 6); however, transcriptomic data describing this resistance are not available. Using the Cappable-Seq method, we described the repertoire of active transcriptional start sites of MG1655 upon treatment with novobiocin, tetracycline, and rifampicin (7). Here, we present an RNA-seq data set for this strain under the same conditions. Taken together, these data provide a snapshot of transcriptional activity changes in E. coli, revealing the bacterial adaptive potential through specific and nonspecific responses to inhibitors of transcription, translation, and DNA gyrase activity, which will expand our understanding of bacterial resistance for clinical and environmental applications.
E. coli MG1655 cultures were grown in Luria-Bertani broth at 37°C with shaking (190 rpm). In the middle of the exponential phase (OD_600_ = 0.6), tetracycline, rifampicin, or novobiocin was added at four different concentrations. Concentrations that, after 1 h treatment, reduced the number of CFU by 50% compared to the control were selected for further experiment. The determined concentrations were 12.5, 50, and 100 mg/L for tetracycline, rifampicin, and novobiocin, respectively. Initial changes in the transcriptome were the focus of the experiment. Bacterial cells were fixed 15 min after treatment, when a divergence in the growth curves of the control and experimental cultures was observed, with an equal volume of 19% ethanol and 1% phenol, pH 5.5, on ice for 30 min. It has previously been shown that this fixation ensures reproducible quality of RNA samples (7). Bacterial RNA was isolated using TRIzol reagent and TURBO DNA-free kit (Thermo Fisher Scientific, Waltham, MA, USA). Ribosomal RNA was depleted using the Illumina Ribo-Zero Plus rRNA Depletion Kit (Illumina, San Diego, CA, USA). Libraries were generated using the NEBNext Ultra II Directional RNA Library Prep Kit for Illumina (New England Biolabs, Ipswich, MA, USA), assessed with a Bioanalyzer 2100 (Agilent Technologies, Santa Clara, CA, USA), and sequenced using a HiSeq 2000 instrument (Illumina). When processing data, the default program parameters were used unless otherwise stated. Following demultiplexing with CASAVA, the reads were trimmed with bbduk (http://sourceforge.net/projects/bbmap/) and mapped to the annotated cds sequences of strain MG1655 (GCF_000005845.2) using Salmon (8). The resulting files were converted to bam format using SAMtools (9). Transcript abundances were imported in the R environment with tximport (10). Deep sequencing of the global transcriptome yielded 126,950,957 reads in total with an average depth of 10.5 million reads per sample (Table 1). DESeq2 on the R platform was used for calculation of differentially expressed genes (11). The top 2,000 genes ranked by standard deviation were generated using iDEP version 2.0 (12) and used to construct the heat map (Fig. 1).
Heat map showing the Pearson hierarchical clustering of top 2,000 genes. Regularized log (Rlog) transformation was used for gene expression values. The data is centered by subtracting the average expression level for each gene. The color scale reflects the log2 relative transcriptional activity of the genes shown.
The gene expression profile shows clear differences in the transcriptome depending on the antibiotic used (Fig. 1). These data will allow a better understanding of global and specific changes in gene regulation in E. coli in response to antibiotics of different modes of action.
The reference list from the paper itself. Each links out to its DOI / PubMed record.
- 1Bie L, Zhang M, Wang J, Fang M, Li L, Xu H, Wang M. 2023. Comparative analysis of transcriptomic response of Escherichia coli K-12 MG 1655 to nine representative classes of antibiotics. Microbiol Spectr 11:e 0031723. doi:10.1128/spectrum.00317-2336853057 PMC 10100721 · doi ↗ · pubmed ↗
- 2Shaw KJ, Miller N, Liu X, Lerner D, Wan J, Bittner A, Morrow BJ. 2003. Comparison of the changes in global gene expression of Escherichia coli induced by four bactericidal agents. J Mol Microbiol Biotechnol 5:105–122. doi:10.1159/00006998112736533 · doi ↗ · pubmed ↗
- 3Zhao L, Yin G, Zhang Y, Duan C, Wang Y, Kang Z. 2022. A comparative study on the genomes, transcriptomes, and metabolic properties of Escherichia coli strains Nissle 1917, BL 21(DE 3), and MG 1655. Eng Microbiol 2:100012. doi:10.1016/j.engmic.2022.10001239628614 PMC 11610980 · doi ↗ · pubmed ↗
- 4Balkin A, Plotnikov A, Konnova T, Shagimardanova E, Hamo H, Gogolev Y, Gogoleva N. 2025. Cappable-seq RNA-sequencing data sets of Escherichia coli K-12 MG 1655 treated with novobiocin, tetracycline, and rifampicin. Microbiol Resour Announc 14:e 0119424. doi:10.1128/mra.01194-2439727393 PMC 11812352 · doi ↗ · pubmed ↗
- 5Lilic M, Jovanovic M, Jovanovic G, Savic DJ. 2003. Identification of the Cys B-regulated gene, hsl J, related to the Escherichia coli novobiocin resistance phenotype. FEMS Microbiol Lett 224:239–246. doi:10.1016/S 0378-1097(03)00441-512892888 · doi ↗ · pubmed ↗
- 6Bodoev IN, Ilina EN, Smirnov GB. 2018. Characteristics of emergence of mutants resistant to nalidixic acid and novobiocin in E. coli strains with rec A and lex A mutations. Mol Genet Microbiol Virol 33:30–33. doi:10.3103/S 0891416818010044 · doi ↗
- 7Gogoleva NE, Konnova TA, Balkin AS, Plotnikov AO, Gogolev YV. 2020. Transcriptomic data of Salmonella enterica subsp. enterica serovar Typhimurium str. 14028 S treated with novobiocin. Data Brief 29:105297. doi:10.1016/j.dib.2020.10529732140513 PMC 7044638 · doi ↗ · pubmed ↗
- 8Patro R, Duggal G, Love MI, Irizarry RA, Kingsford C. 2017. Salmon provides fast and bias-aware quantification of transcript expression. Nat Methods 14:417–419. doi:10.1038/nmeth.419728263959 PMC 5600148 · doi ↗ · pubmed ↗