Impact of COVID‐19 and factors associated with long COVID and COVID‐19 vaccine uptake in people with HIV in the United Kingdom: Results from Positive Voices 2022
F. Nakagawa, R. Palich, M. Kall, J. Sewell, C. Smith, C. Kelly, H. Kitt, A. Pelchen‐Matthews, A. Aghaizu, A. Sparrowhawk, N. Mackie, T. Djuretic, S. Schoeman, C. Humphreys, M. Lipman, F. C. Lampe, A. J. Rodger, Ann Sullivan, Ann Sullivan, Rachel Jones, Mohammed Hassan

TL;DR
This study examines how the pandemic affected people with HIV in the UK, including long-term symptoms and vaccine uptake patterns.
Contribution
The study identifies demographic and socio-economic factors linked to long COVID and incomplete vaccine uptake among people with HIV.
Findings
About half of participants had a history of COVID-19, with 11% experiencing long COVID.
Incomplete vaccine uptake was observed in 16% of participants, more common among women, younger people, and socio-economically disadvantaged groups.
Abstract
We assessed the impact of COVID‐19, and the prevalence and factors associated with a history of COVID‐19 infection, long COVID and incomplete COVID‐19 vaccine uptake among people with HIV. Positive Voices 2022 is a questionnaire study of people accessing HIV care in the United Kingdom (March 2022–April 2023). Logistic regression assessed factors associated with a history of COVID‐19 (previous positive test), long COVID among those with a history of COVID‐19 (ongoing symptoms, with COVID‐19 onset >3 months previously) and incomplete COVID‐19 vaccine uptake (less than three doses of vaccine), adjusted for: age; gender; ethnicity; and year of HIV diagnosis. In all, 4188 participants were included. Commonly reported negative impacts of the pandemic were on social contact (44% of participants), mental health (30%), healthcare access (26%) and financial security (25%). Overall, 2068 of 4188…
Genes, proteins, chemicals, diseases, species, mutations and cell lines named across the full text — each resolved to its canonical identifier and authoritative record.
Click any figure to enlarge with its caption.
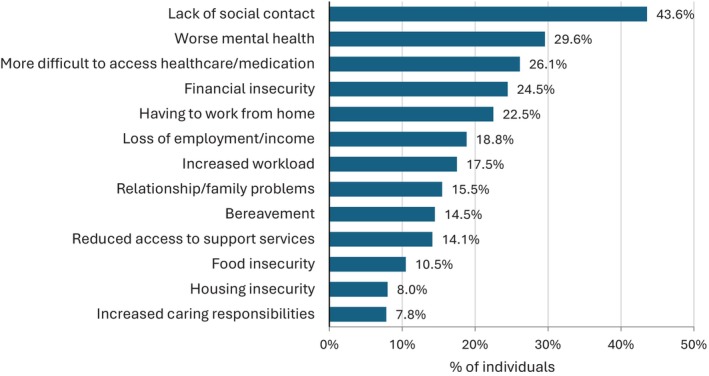 FIGURE 1
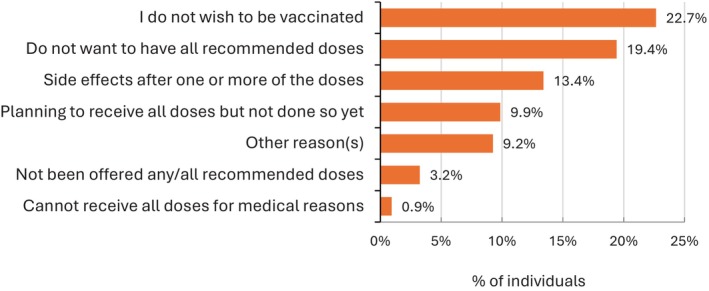 FIGURE 2
| History of COVID‐19 infection (reported positive test) ( | |||||||
|---|---|---|---|---|---|---|---|
|
|
|
| % | Unadjusted odds ratio (95% CI) |
| Adjusted odds ratio |
|
| Age group (years) | |||||||
| 18–34 | 316 (7.5%) | 201 | 63.6 | 1.22 (0.93–1.60) | <0.0001 | 1.21 (0.92–1.60) | <0.0001 |
| 35–44 | 805 (19.2%) | 474 | 58.9 | 1 | 1 | ||
| 45–54 | 1236 (29.5%) | 612 | 49.5 | 0.69 (0.57–0.82) | 0.71 (0.59–0.86) | ||
| 55–64 | 1284 (30.7%) | 587 | 45.7 | 0.59 (0.49–0.70) | 0.58 (0.48–0.71) | ||
| 65+ | 547 (13.1%) | 194 | 35.5 | 0.38 (0.31–0.48) | 0.36 (0.29–0.46) | ||
| Combined demographic group | |||||||
| GBMSM | 2.486 (59.4%) | 1324 | 53.3 | 1 | <0.0001 | 1 | <0.0001 |
| Black African heterosexual men | 251 (6.0%) | 102 | 40.6 | 0.60 (0.46–0.78) | 0.62 (0.48–0.82) | ||
| Other heterosexual men | 351 (8.4%) | 152 | 43.3 | 0.67 (0.54–0.84) | 0.77 (0.61–0.97) | ||
| Black African women | 555 (13.3%) | 238 | 42.9 | 0.66 (0.55–0.79) | 0.63 (0.52–0.77) | ||
| Other women | 445 (10.6%) | 216 | 48.5 | 0.83 (0.67–1.01) | 0.81 (0.66–0.99) | ||
| Non‐binary or other gender | 28 (0.7%) | 10 | 35.7 | 0.49 (0.22–1.06) | 0.40 (0.18–0.87) | ||
| Undisclosed gender or sexuality | 72 (1.7%) | 26 | 36.1 | 0.50 (0.30–0.81) | 0.50 (0.31–0.82) | ||
| Ethnicity | |||||||
| White | 2768 (66.1%) | 1427 | 51.6 | 1 | <0.0001 | 1 | <0.0001 |
| Black African | 861 (20.6%) | 359 | 41.7 | 0.67 (0.58–0.78) | 0.65 (0.54–0.78) | ||
| Black other | 116 (2.8%) | 44 | 37.9 | 0.57 (0.39–0.84) | 0.56 (0.38–0.82) | ||
| Asian | 163 (3.9%) | 84 | 51.5 | 1.00 (0.73–1.37) | 0.92 (0.66–1.27) | ||
| Mixed | 125 (3.0%) | 62 | 49.6 | 0.92 (0.65–1.32) | 0.85 (0.59–1.22) | ||
| Other including undisclosed | 155 (3.7%) | 92 | 59.4 | 1.37 (0.99–1.91) | 1.21 (0.86–1.70) | ||
| Gender | |||||||
| Male | 3133 (74.8%) | 1596 | 50.9 | 1 | 0.0012 | 1 | 0.034 |
| Female | 1000 (23.9%) | 454 | 45.4 | 0.80 (0.69–0.92) | 0.94 (0.79–1.11) | ||
| Non‐binary or other gender | 28 (0.7%) | 10 | 35.7 | 0.54 (0.25–1.16) | 0.44 (0.20–0.96) | ||
| Undisclosed | 27 (0.6%) | 8 | 29.6 | 0.41 (0.18–0.93) | 0.41 (0.17–0.95) | ||
| Region of HIV care | |||||||
| London | 1991 (47.5%) | 1036 | 52.0 | 1 | 0.0093 | 1 | 0.065 |
| Midlands and East | 707 (16.9%) | 329 | 46.5 | 0.80 (0.68–0.95) | 0.86 (0.72–1.03) | ||
| North | 657 (15.7%) | 311 | 47.3 | 0.83 (0.69–0.99) | 0.82 (0.69–0.99) | ||
| South | 787 (18.8%) | 365 | 46.4 | 0.80 (0.68–0.94) | 0.81 (0.68–0.96) | ||
| Scotland/Wales/unknown | 46 (1.1%) | 27 | 58.7 | 1.31 (0.72–2.37) | 1.13 (0.61–2.07) | ||
| Highest education level | |||||||
| Education to age 16 | 983 (23.5%) | 417 | 42.4 | 1 | <0.0001 | 1 | <0.0001 |
| Education to age 18 or post‐16 qualification | 1080 (25.8%) | 508 | 47.0 | 1.21 (1.01–1.43) | 1.18 (0.99–1.41) | ||
| Undergraduate degree | 944 (22.5%) | 514 | 54.5 | 1.62 (1.36–1.94) | 1.55 (1.29–1.86) | ||
| Postgraduate degree | 984 (23.5%) | 542 | 55.1 | 1.66 (1.39–1.99) | 1.60 (1.33–1.92) | ||
| Other/missing | 197 (4.7%) | 87 | 44.2 | 1.07 (0.79–1.46) | 1.17 (0.85–1.60) | ||
| Employment status | |||||||
| Employed | 2729 (66.5%) | 1535 | 56.2 | 1 | <0.0001 | 1 | <0.0001 |
| Unemployed | 308 (7.5%) | 108 | 35.1 | 0.42 (0.33–0.54) | 0.45 (0.35–0.58) | ||
| Retired | 569 (13.9%) | 202 | 35.5 | 0.43 (0.35–0.52) | 0.55 (0.43–0.71) | ||
| Not working due to sickness/disability | 367 (8.9%) | 133 | 36.2 | 0.44 (0.35–0.55) | 0.45 (0.36–0.57) | ||
| Other including student, carer | 129 (3.1%) | 51 | 39.5 | 0.51 (0.35–0.73) | 0.55 (0.38–0.80) | ||
| Having money for basic needs (food, rent, bills etc.) | |||||||
| Yes, always | 2213 (54.0%) | 1190 | 53.8 | 1 | <0.0001 | 1 | <0.0001 |
| Most of the time | 1073 (26.2%) | 476 | 44.4 | 0.69 (0.59–0.79) | 0.69 (0.59–0.80) | ||
| Some of the time | 539 (13.1%) | 255 | 47.3 | 0.77 (0.64–0.93) | 0.83 (0.68–1.02) | ||
| No | 276 (6.7%) | 104 | 37.7 | 0.52 (0.40–0.67) | 0.57 (0.43–0.74) | ||
| Household composition | |||||||
| Living alone | 1438 (35.2%) | 637 | 44.3 | 1 | <0.0001 | 1 | <0.0001 |
| 2 people | 1731 (42.3%) | 879 | 50.8 | 1.30 (1.13–1.49) | 1.21 (1.05–1.40) | ||
| 3–5 people | 859 (21.0%) | 476 | 55.4 | 1.56 (1.32–1.85) | 1.61 (1.34–1.95) | ||
| 6 people or more | 63 (1.5%) | 32 | 50.8 | 1.30 (0.78–2.15) | 1.22 (0.72–2.05) | ||
| Year of HIV diagnosis | |||||||
| 2014–2023 | 931 (22.2%) | 508 | 54.6 | 1 | <0.0001 | 1 | 0.95 |
| 2008–2013 | 1099 (26.2%) | 570 | 51.9 | 0.90 (0.75–1.07) | 1.02 (0.85–1.22) | ||
| 2002–2007 | 1100 (26.3%) | 504 | 45.8 | 0.70 (0.59–0.84) | 0.95 (0.79–1.15) | ||
| 1996–2001 | 610 (14.6%) | 285 | 46.7 | 0.73 (0.59–0.90) | 1.02 (0.82–1.27) | ||
| 1995 or earlier | 448 (10.7%) | 201 | 44.9 | 0.68 (0.54–0.85) | 0.97 (0.76–1.25) | ||
| Most recent viral load (self‐report) | |||||||
| <50 copies/mL | 3893 (93.0%) | 1955 | 50.2 | 1 | <0.0001 | 1 | <0.0001 |
| ≥50 copies/mL | 141 (3.4%) | 54 | 38.3 | 0.62 (0.44–0.87) | 0.65 (0.45–0.92) | ||
| Don't know/missing | 154 (3.7%) | 59 | 38.3 | 0.62 (0.44–0.86) | 0.65 (0.46–0.92) | ||
| Cardiovascular disease | |||||||
| No | 3430 (90.6%) | 1781 | 51.9 | 1 | <0.0001 | 1 | <0.0001 |
| Ever‐diagnosed | 356 (9.4%) | 129 | 36.2 | 0.53 (0.42–0.66) | 0.64 (0.50–0.81) | ||
| Diabetes | |||||||
| No | 3412 (90.7%) | 1740 | 51.0 | 1 | 1 | ||
| Ever‐diagnosed | 349 (9.3%) | 163 | 46.7 | 0.84 (0.68–1.05) | 0.13 | 1.14 (0.90–1.43) | 0.28 |
| Asthma or COPD | |||||||
| No | 3146 (81.5%) | 1608 | 51.1 | 1 | 0.11 | 1 | 0.029 |
| Ever‐diagnosed | 712 (18.5%) | 340 | 47.8 | 0.87 (0.74–1.03) | 0.83 (0.70–0.98) | ||
| BMI (self‐reported) | |||||||
| <30 kg/m2 | 2849 (76.0%) | 1472 | 51.7 | 1 | 1 | ||
| Obese (≥30 kg/m2) | 900 (24.0%) | 425 | 47.2 | 0.84 (0.72–0.97) | 0.020 | 0.96 (0.81–1.12) | 0.58 |
| Depressive symptoms | |||||||
| No | 3264 (79.5%) | 1657 | 50.8 | 1 | 0.005 | 1 | <0.0001 |
| Yes (PHQ‐9 ≥10) | 843 (20.5%) | 382 | 45.3 | 0.80 (0.69–0.94) | 0.73 (0.62–0.85) | ||
| Anxiety symptoms | |||||||
| No | 3495 (85.1%) | 1763 | 50.4 | 1 | 0.027 | 1 | 0.001 |
| Yes (GAD‐7 ≥10) | 610 (14.9%) | 278 | 45.6 | 0.82 (0.69–0.98) | 0.73 (0.61–0.87) | ||
| Number of sexual partners in the last 3 months | |||||||
| 0 | 1261 (35.6%) | 539 | 42.7 | 1 | <0.0001 | 1 | <0.0001 |
| 1 | 1316 (37.2%) | 697 | 53.0 | 1.51 (1.29–1.76) | 1.31 (1.11–1.54) | ||
| 2–5 | 583 (16.5%) | 336 | 57.6 | 1.82 (1.49–2.22) | 1.53 (1.24–1.88) | ||
| >6 | 379 (10.7%) | 244 | 64.4 | 2.42 (1.91–3.07) | 1.96 (1.53–2.51) | ||
|
| Long COVID ( | ||||
|---|---|---|---|---|---|
| Number with long COVID/history of COVID‐19 (%) | Unadjusted odds ratio (95% CI) |
| Adjusted |
| |
| Age group (years) | |||||
| 18–34 | 12/183 (6.6%) | 0.58 (0.30–1.13) | 0.10 | 0.60 (0.30–1.21) | 0.70 |
| 35–44 | 46/429 (10.7%) | 1 | 1 | ||
| 45–54 | 56/537 (10.4%) | 0.97 (0.64–1.46) | 0.83 (0.54–1.28) | ||
| 55–64 | 69/520 (13.3%) | 1.27 (0.86–1.89) | 1.04 (0.67–1.61) | ||
| 65+ | 17/175 (9.7%) | 0.90 (0.50–1.61) | 0.73 (0.39–1.36) | ||
| Demographic group | |||||
| GBMSM | 117/1218 (9.6%) | 1 | 0.082 | 1 | 0.062 |
| Black African heterosexual men | 7/88 (8.0%) | 0.81 (0.37–1.80) | 0.78 (0.35–1.74) | ||
| Other heterosexual men | 16/129 (12.4%) | 1.33 (0.76–2.33) | 1.37 (0.78–2.42) | ||
| Black African women | 24/190 (12.6%) | 1.36 (0.85–2.17) | 1.27 (0.78–2.05) | ||
| Other women | 32/188 (17.0%) | 1.93 (1.26–2.95) | 1.92 (1.24–2.95) | ||
| Non‐binary, other or undisclosed gender or sexuality | 4/31 (12.9%) | 1.39 (0.48–4.05) | 1.45 (0.49–4.24) | ||
| Ethnicity | |||||
| White | 137/1300 (10.5%) | 1 | 0.45 | 1 | 0.35 |
| Black African | 32/295 (10.8%) | 1.03 (0.69–1.55) | 0.73 (0.45–1.18) | ||
| Black other | 9/40 (22.5%) | 2.46 (1.15–5.29) | 1.93 (0.87–4.28) | ||
| Asian | 8/74 (10.8%) | 1.03 (0.48–2.19) | 1.03 (0.48–2.23) | ||
| Mixed | 5/53 (9.4%) | 0.88 (0.35–2.26) | 0.82 (0.32–2.11) | ||
| Other including undisclosed | 9/82 (11.0%) | 1.05 (0.51–2.14) | 1.07 (0.52–2.23) | ||
| Gender | |||||
| Male | 142/1450 (9.8%) | 1 | 0.016 | 1 | 0.029 |
| Female | 56/378 (14.8%) | 1.60 (1.15–2.23) | 1.71 (1.15–2.54) | ||
| Non‐binary, other or undisclosed gender | 2/16 (12.5%) | 1.32 (0.30–5.85) | 1.44 (0.32–6.56) | ||
| Region of HIV care | |||||
| London | 91/919 (9.9%) | 1 | 0.35 | 1 | 0.26 |
| Midlands and East | 37/298 (12.4%) | 1.29 (0.86–1.94) | 1.33 (0.88–2.03) | ||
| North | 33/282 (11.7%) | 1.21 (0.79–1.84) | 1.25 (0.81–1.93) | ||
| South | 34/323 (10.5%) | 1.07 (0.71–1.62) | 1.10 (0.71–1.68) | ||
| Scotland/Wales/unknown | 5/22 (22.7%) | 2.68 (0.96–7.42) | 2.77 (0.97–7.87) | ||
| Highest education level | |||||
| Education to age 16 | 44/359 (12.3%) | 1 | 0.21 | 1 | 0.31 |
| Education to age 18 or post‐16 qualification | 58/451 (12.9%) | 1.06 (0.69–1.61) | 1.14 (0.75–1.75) | ||
| Undergraduate degree | 49/471 (10.4%) | 0.83 (0.54–1.28) | 0.90 (0.58–1.39) | ||
| Postgraduate degree | 42/499 (8.4%) | 0.66 (0.42–1.03) | 0.72 (0.46–1.14) | ||
| Other/missing | 7/64 (10.9%) | 0.88 (0.38–2.05) | 0.83 (0.35–1.97) | ||
| Employment status | |||||
| Employed | 127/1392 (9.1%) | 1 | <0.0001 | 1 | <0.0001 |
| Unemployed | 20/91 (22.0%) | 2.80 (1.65–4.76) | 2.61 (1.51–4.51) | ||
| Retired | 12/181 (6.6%) | 0.71 (0.38–1.31) | 0.57 (0.27–1.18) | ||
| Not working due to sickness/disability | 35/112 (31.3%) | 4.53 (2.91–7.02) | 3.92 (2.47–6.25) | ||
| Other including student, carer | 2/41 (4.9%) | 0.51 (0.12–2.14) | 0.48 (0.11–2.04) | ||
| Having money for basic needs | |||||
| Yes, always | 74/1101 (6.7%) | 1 | <0.0001 | 1 | <0.0001 |
| Most of the time | 56/417 (13.4%) | 2.15 (1.49–3.11) | 2.29 (1.57–3.34) | ||
| Some of the time | 39/211 (18.5%) | 3.15 (2.07–4.79) | 3.62 (2.29–5.72) | ||
| No | 26/84 (31.0%) | 6.22 (3.70–10.46) | 7.83 (4.46–13.74) | ||
| Household composition | |||||
| Living alone | 65/569 (11.4%) | 1 | 0.51 | 1 | 0.49 |
| 2 people | 87/810 (10.7%) | 0.93 (0.66–1.31) | 0.93 (0.66–1.32) | ||
| 3–5 people | 42/407 (10.3%) | 0.89 (0.59–1.35) | 0.84 (0.54–1.31) | ||
| 6 people or more | 2/24 (8.3%) | 0.70 (0.16–3.07) | 0.88 (0.20–3.90) | ||
| Year of HIV diagnosis | |||||
| 2014–2023 | 37/453 (8.2%) | 1 | 0.001 | 1 | 0.007 |
| 2008–2013 | 45/524 (8.6%) | 1.06 (0.67–1.66) | 0.92 (0.57–1.48) | ||
| 2002–2007 | 58/442 (13.1%) | 1.70 (1.10–2.63) | 1.50 (0.93–2.42) | ||
| 1996–2001 | 35/250 (14.0%) | 1.83 (1.12–2.99) | 1.58 (0.92–2.72) | ||
| 1995 or earlier | 25/175 (14.3%) | 1.88 (1.09–3.22) | 1.75 (0.96–3.19) | ||
| Most recent viral load (self‐report) | |||||
| <50 copies/mL | 183/1748 (10.5%) | 1 | 0.33 | 1 | 0.47 |
| ≥50 copies/mL | 7/47 (14.9%) | 1.50 (0.66–3.39) | 1.36 (0.59–3.12) | ||
| Don't know/missing | 10/49 (20.4%) | 2.19 (1.08–4.47) | 2.01 (0.97–4.19) | ||
| Cardiovascular disease | |||||
| No | 159/1594 (10.0%) | 1 | 1 | ||
| Ever‐diagnosed | 18/112 (16.1%) | 1.73 (1.02–2.94) | 0.043 | 1.57 (0.90–2.73) | 0.11 |
| Diabetes | |||||
| No | 147/1565 (9.4%) | 1 | 1 | <0.0001 | |
| Ever‐diagnosed | 28/135 (20.7%) | 2.52 (1.61–3.96) | <0.0001 | 2.43 (1.50–3.93) | |
| Asthma or COPD | |||||
| No | 133/1434 (9.3%) | 1 | 1 | ||
| Ever‐diagnosed | 49/306 (16.0%) | 1.87 (1.31–2.66) | 0.001 | 1.85 (1.28–2.65) | 0.001 |
| BMI (self‐reported) | |||||
| <30 kg/m2 | 127/1333 (9.5%) | 1 | 1 | ||
| Obese (≥30 kg/m2) | 59/380 (15.5%) | 1.75 (1.25–2.43) | 0.001 | 1.62 (1.13–2.32) | 0.009 |
| Depressive symptoms | |||||
| No | 119/1497 (7.9%) | 1 | 1 | ||
| Yes (PHQ‐9 ≥10) | 78/324 (24.1%) | 3.67 (2.68–5.04) | <0.0001 | 3.80 (2.74–5.28) | <0.0001 |
| Anxiety symptoms | |||||
| No | 142/1585 (9.0%) | 1 | 1 | ||
| Yes (GAD‐7 ≥10) | 56/237 (23.6%) | 3.14 (2.23–4.44) | <0.0001 | 3.12 (2.18–4.46) | <0.0001 |
| Number of sexual partners in the last 3 months | |||||
| 0 | 71/480 (14.8%) | 1 | 0.023 | 1 | 0.11 |
| 1 | 52/625 (8.3%) | 0.52 (0.36–0.76) | 0.56 (0.38–0.84) | ||
| 2–5 | 23/316 (7.3%) | 0.45 (0.28–0.74) | 0.52 (0.31–0.88) | ||
| >6 | 25/228 (11.0%) | 0.71 (0.44–1.15) | 0.83 (0.49–1.39) | ||
| Number of COVID vaccine doses | |||||
| Sufficient (3 or 4) | 164/1560 (10.5%) | 1 | 1 | ||
| Insufficient (0, 1 or 2) | 34/268 (12.7%) | 1.24 (0.83–1.83) | 0.29 | 1.14 (0.75–1.74) | 0.54 |
| Incomplete COVID‐19 vaccine uptake ( | |||||
|---|---|---|---|---|---|
|
| Number with incomplete vaccine uptake / number of participants (%) | Unadjusted odds ratio (95% CI) |
| Adjusted |
|
| Age group (years) | |||||
| 18–34 | 95/310 (30.6%) | 1.60 (1.19–2.14) | <0.0001 | 1.60 (1.17–2.19) | <0.0001 |
| 35–44 | 173/798 (21.7%) | 1 | 1 | ||
| 45–54 | 194/1220 (15.9%) | 0.68 (0.54–0.86) | 0.65 (0.51–0.83) | ||
| 55–64 | 146/1262 (11.6%) | 0.47 (0.37–0.60) | 0.51 (0.39–0.66) | ||
| 65+ | 41/531 (7.7%) | 0.30 (0.22–0.43) | 0.39 (0.27–0.57) | ||
| Demographic group | |||||
| GBMSM | 232/2449 (9.5%) | 1 | <0.0001 | 1 | <0.0001 |
| Black African heterosexual men | 64/250 (25.6%) | 3.29 (2.40–4.50) | 3.74 (2.70–5.19) | ||
| Other heterosexual men | 65/346 (18.8%) | 2.21 (1.63–2.99) | 2.83 (2.07–3.88) | ||
| Black African women | 149/543 (27.4%) | 3.61 (2.87–4.56) | 3.61 (2.83–4.61) | ||
| Other women | 116/435 (26.7%) | 3.47 (2.70–4.47) | 3.67 (2.83–4.75) | ||
| Non‐binary, other or undisclosed gender or sexuality | 23/98 (23.5%) | 2.93 (1.80–4.77) | 2.88 (1.75–4.75) | ||
| Ethnicity | |||||
| White | 311/2722 (11.4%) | 1 | <0.0001 | 1 | <0.0001 |
| Black African | 225/848 (26.5%) | 2.80 (2.31–3.40) | 1.88 (1.48–2.38) | ||
| Black other | 41/112 (36.6%) | 4.48 (2.99–6.69) | 3.62 (2.38–5.51) | ||
| Asian | 18/161 (11.2%) | 0.98 (0.59–1.62) | 0.72 (0.43–1.21) | ||
| Mixed | 22/124 (17.7%) | 1.67 (1.04–2.69) | 1.30 (0.79–2.12) | ||
| Other including undisclosed | 32/154 (20.8%) | 2.03 (1.35–3.05) | 1.53 (1.00–2.34) | ||
| Gender | |||||
| Male | 372/3089 (12.0%) | 1 | <0.0001 | 1 | <0.0001 |
| Female | 265/978 (27.1%) | 2.71 (2.27–3.24) | 1.95 (1.57–2.42) | ||
| Non‐binary, other or undisclosed gender | 12/54 (22.2%) | 2.09 (1.09–4.00) | 1.61 (0.82–3.15) | ||
| Region of HIV care | |||||
| London | 328/1955 (16.8%) | 1 | 0.0001 | 1 | 0.0030 |
| Midlands and East | 115/696 (16.5%) | 0.98 (0.78–1.24) | 0.84 (0.66–1.08) | ||
| North | 119/651 (18.3%) | 1.11 (0.88–1.40) | 1.12 (0.88–1.43) | ||
| South | 83/774 (10.7%) | 0.60 (0.46–0.77) | 0.65 (0.50–0.85) | ||
| Scotland/Wales/unknown | 4/45 (8.9%) | 0.48 (0.17–1.36) | 0.44 (0.15–1.27) | ||
| Highest education level | |||||
| Education to age 16 | 159/965 (16.5%) | 1 | 0.0001 | 1 | 0.0001 |
| Education to age 18 or post‐16 qualification | 178/1068 (16.7%) | 1.01 (0.80–1.28) | 1.01 (0.79–1.29) | ||
| Undergraduate degree | 149/937 (15.9%) | 0.96 (0.75–1.22) | 0.84 (0.65–1.09) | ||
| Postgraduate degree | 114/965 (11.8%) | 0.68 (0.52–0.88) | 0.62 (0.47–0.81) | ||
| Other/missing | 49/186 (26.3%) | 1.81 (1.25–2.62) | 1.41 (0.95–2.10) | ||
| Employment status | |||||
| Employed | 406/2700 (15.0%) | 1 | <0.0001 | 1 | <0.0001 |
| Unemployed | 91/304 (29.9%) | 2.41 (1.85–3.15) | 2.18 (1.64–2.89) | ||
| Retired | 39/553 (7.1%) | 0.43 (0.30–0.60) | 0.95 (0.61–1.47) | ||
| Not working due to sickness/disability | 60/359 (16.7%) | 1.13 (0.84–1.53) | 1.58 (1.15–2.16) | ||
| Other including student, carer | 35/129 (27.1%) | 2.10 (1.41–3.15) | 1.47 (0.96–2.25) | ||
| Having money for basic needs | |||||
| Yes, always | 229/2178 (10.5%) | 1 | <0.0001 | 1 | <0.0001 |
| Most of the time | 178/1062 (16.7%) | 1.71 (1.39–2.12) | 1.43 (1.15–1.79) | ||
| Some of the time | 137/531 (25.8%) | 2.96 (2.33–3.75) | 1.89 (1.46–2.46) | ||
| No | 81/271 (29.9%) | 3.63 (2.70–4.87) | 2.57 (1.88–3.53) | ||
| Household composition | |||||
| Living alone | 185/1408 (13.1%) | 1 | <0.0001 | 1 | 0.010 |
| 2 people | 210/1710 (12.3%) | 0.93 (0.75–1.14) | 0.81 (0.65–1.01) | ||
| 3–5 people | 207/853 (24.3%) | 2.12 (1.70–2.64) | 1.21 (0.95–1.54) | ||
| 6 people or more | 26/62 (41.9%) | 4.77 (2.82–8.09) | 2.69 (1.54–4.69) | ||
| Year of HIV diagnosis | |||||
| 2014–2023 | 182/915 (19.9%) | 1 | <0.0001 | 1 | 0.021 |
| 2008–2013 | 162/1078 (15.0%) | 0.71 (0.56–0.90) | 0.71 (0.55–0.91) | ||
| 2002–2007 | 198/1087 (18.2%) | 0.90 (0.72–1.12) | 0.92 (0.71–1.19) | ||
| 1996–2001 | 72/604 (11.9%) | 0.55 (0.41–0.73) | 0.69 (0.50–0.95) | ||
| 1995 or earlier | 35/437 (8.0%) | 0.35 (0.24–0.51) | 0.61 (0.40–0.91) | ||
| Last plasma HIV‐RNA | |||||
| <50 cp/mL | 563/3834 (14.7%) | 1 | <0.0001 | 1 | <0.0001 |
| ≥50 cp/mL | 36/139 (25.9%) | 2.03 (1.38–3.00) | 1.87 (1.24–2.81) | ||
| Don't know/missing | 50/148 (33.8%) | 2.96 (2.08–4.22) | 2.52 (1.73–3.68) | ||
| Cardiovascular disease | |||||
| No | 535/3379 (15.8%) | 1 | 0.13 | 1 | 0.091 |
| Ever‐diagnosed | 44/346 (12.7%) | 0.77 (0.56–1.08) | 1.36 (0.95–1.94) | ||
| Diabetes | |||||
| No | 538/3358 (16.0%) | 1 | 0.16 | 1 | 0.43 |
| Ever‐diagnosed | 45/343 (13.1%) | 0.79 (0.57–1.10) | 0.87 (0.61–1.23) | ||
| Asthma or COPD | |||||
| No | 492/3098 (15.9%) | 1 | 0.12 | 1 | 0.23 |
| Ever‐diagnosed | 95/701 (13.6%) | 0.83 (0.66–1.05) | 0.86 (0.67–1.10) | ||
| BMI (self‐reported) | |||||
| <30 kg/m2 | 385/2815 (13.7%) | 1 | 1 | ||
| Obese (≥30 kg/m2) | 158/886 (17.8%) | 1.37 (1.12–1.68) | 0.002 | 0.95 (0.76–1.19) | 0.64 |
| Depressive symptoms | |||||
| No | 449/3213 (14.0%) | 1 | <0.0001 | 1 | <0.0001 |
| Yes (PHQ‐9 ≥10) | 179/831 (21.5%) | 1.69 (1.39–2.05) | 1.69 (1.38–2.07) | ||
| Anxiety symptoms | |||||
| No | 500/3439 (14.5%) | 1 | 0.0001 | 1 | <0.0001 |
| Yes (GAD‐7 ≥10) | 126/602 (20.9%) | 1.56 (1.25–1.94) | 1.51 (1.20–1.90) | ||
| Number of sexual partners in the last 3 months | |||||
| 0 | 191/1239 (15.4%) | 1 | 0.012 | 1 | 0.06 |
| 1 | 225/1309 (17.2%) | 1.14 (0.92–1.41) | 0.85 (0.67–1.06) | ||
| 2–5 | 63/578 (10.9%) | 0.67 (0.50–0.91) | 0.68 (0.49–0.95) | ||
| >6 | 45/377 (11.9%) | 0.74 (0.53–1.05) | 0.76 (0.52–1.10) | ||
| Ever positive COVID‐19 test | |||||
| No | 333/2071 (16.1%) | 1 | 1 | ||
| Yes | 316/2050 (15.4%) | 0.95 (0.80–1.12) | 0.55 | 0.92 (0.77–1.10) | 0.35 |
- —National Institute for Health Research 10.13039/501100000272
- —Gilead Sciences 10.13039/100005564
Peer Reviews
No public reviews on file for this paper yet. If you reviewed it on a platform where reviews are public (OpenReview, ICLR, NeurIPS, ICML), you can paste yours below so the community can read it here.
Videos
No videos yet. Explain this paper in a talk, walkthrough, or lecture? Add one.
Taxonomy
TopicsLong-Term Effects of COVID-19 · COVID-19 Clinical Research Studies · SARS-CoV-2 and COVID-19 Research
INTRODUCTION
The COVID‐19 pandemic was one of the most serious public health events of the 21st century, resulting in more than 250 000 deaths in the United Kingdom [1, 2]. From early in the pandemic, people with HIV were identified as a clinical risk group and prioritized for vaccination [3]. Evidence for an increased risk of COVID‐19 morbidity and mortality in people with HIV has been mixed. One systematic review and meta‐analysis, in which most studies were from the United States or Europe, found no association between HIV status and risk of death [4], whereas another using global data from hospitalized people found HIV to be an independent risk factor for severe COVID‐19 at admission and in‐hospital mortality [5].
Increased susceptibility to severe COVID‐19 in people with HIV may partly relate to risk factors that also affect the general population, such as being male, older age and having the presence of comorbid conditions (including diabetes, obesity, hypertension, and pulmonary, liver and cardiovascular diseases) [5, 6, 7]. HIV‐specific risk factors for more severe disease include having a current CD4+ T‐cell count <200 cells/mm^3^ [5, 8, 9, 10]. In people with HIV with CD4 T‐cell counts above this cut‐off, associated comorbidities and age were the most important predictors of COVID‐19 severity, although increased immune activation and persistent chronic inflammation may also play a role [9]. However, COVID‐19 and HIV both disproportionately affect people of minoritized ethnicity and those impacted by socio‐economic deprivation [11, 12, 13, 14]. In addition, disruption of healthcare provision had additional consequences for people with long‐term health conditions such as HIV, as it led to reduced face‐to‐face consultations, reduced blood monitoring and extended durations between appointments [15].
COVID‐19 vaccines are highly effective in preventing severe forms of disease and reducing mortality [16, 17]. The vaccines are safe, with no significant difference in side effects for people with HIV compared to the general population [18]. Individuals on virally suppressive antiretroviral therapy (ART) with good CD4 counts generate an effective immune response following vaccination, similar to people without HIV [19]. Immune response is less robust in people with low CD4 counts (<200/mm^3^) with evidence suggesting that a third primary dose of the COVID‐19 vaccine is effective in boosting a protective immune response against severe COVID‐19 disease in this group [19, 20]. In the United Kingdom, further booster doses were also recommended for all people with HIV [21].
Globally, COVID‐19 vaccine uptake among people with HIV has been varied. Several studies in people with HIV reported that factors such as race/ethnicity, gender and level of education, as well as mistrust of vaccination, were associated with COVID‐19 vaccine hesitancy, which aligns with what is seen in the general population [22, 23, 24, 25, 26].
Using data from the Positive Voices 2022 study, the largest UK national survey in people with HIV accessing outpatient care, we describe the reported impact of the COVID‐19 pandemic on daily life among people with HIV and investigate the prevalence and factors associated with: having a history of COVID‐19, having persisting symptoms post infection (long COVID) and incomplete COVID‐19 vaccination uptake.
METHODS
Study design, setting and participants
Positive Voices is a multi‐site, cross‐sectional questionnaire study conducted in adults living with HIV attending 101 outpatient NHS HIV specialist clinics in England, Wales and Scotland, carried out from April 2022 to March 2023. A random sample of people was selected for recruitment at each participating study site using the clinic's most recent year HIV and AIDS Reporting System (HARS) national UK surveillance return. From December 2022, 14 clinics in London adopted a sequential recruitment strategy to increase recruitment. All participants self‐completed a confidential questionnaire (both paper and online options were available) on demographic, socio‐economic, HIV‐related, health and lifestyle factors, health service needs and usage and sexual behaviour. The study was approved by the London Harrow Research Ethics Committee (ref. 13/LO/0279) and the methods have been published elsewhere [27].
Impact of COVID‐19 on daily life
The survey asked about the impact of the pandemic on different areas of life. Participants were asked to indicate whether they had experienced any of the following because of COVID‐19: loss of employment/income; increased workload; having to work from home; housing insecurity; financial insecurity; food insecurity; difficulty accessing healthcare/medication; worse mental health; reduced access to support services; relationship/family problems; increased caring responsibilities; lack of social contact; bereavement.
History of COVID‐19
Participants were asked if they had ever had COVID‐19, with possible response options: ‘Yes, I've had a positive test’; ‘I had symptoms but no positive test’; ‘I had symptoms but never tested’; ‘No’; ‘Don't know’. A history of COVID‐19 was considered positive only for those who indicated that they had a previous positive test.
Post COVID‐19 syndrome (long COVID)
All participants who reported that they had previously had a positive COVID‐19 test were asked to give the date (month and year) when they first had COVID‐19 (either positive test result or onset of symptoms). They were then asked, ‘Are you continuing to experience symptoms due to your COVID infection?’. Post COVID‐19 syndrome (‘long COVID’) is defined as symptoms that develop during or after COVID‐19, continue for more than 12 weeks and are not explained by an alternative diagnosis [28, 29]. In this analysis, we considered participants had long COVID if they indicated the presence of ongoing symptoms due to COVID‐19 and the date reported for the first positive COVID‐19 test or onset of symptoms was at least 3 months prior to the questionnaire date.
COVID‐19 vaccine uptake
Participants were asked how many COVID‐19 vaccine doses they had received with response options of zero to four vaccine doses. At the time the survey was conducted (2022–2023), the current Joint Committee on Vaccination and Immunisation (JCVI) and British HIV Association (BHIVA) guidance was for people with HIV to have received three or four doses depending on CD4 count, detectable HIV viraemia, recent serious HIV related illness and non‐receipt of ART [21]. Therefore, a complete course of vaccination was defined as having received three or more doses. Participants who had received zero, one or two doses were classified as having incomplete vaccination uptake. Participants who indicated they had not received all the recommended COVID‐19 vaccine doses were asked to state reasons for not doing so by ticking all that applied out of the following options: ‘Side effects after one or more of the doses’; ‘Not been offered one or more of the recommended doses’; ‘Cannot receive all recommended doses for medical reasons’; ‘Planning to receive all recommended doses but have not done so yet’; ‘Do not want to have all recommended doses’; ‘I do not wish to be vaccinated’; and final option of ‘Other’ with the option of free text to provide further detail.
Demographic, socio‐economic, HIV‐related, health and lifestyle factors
Other factors considered in analyses included: age group (18–34, 35–44, 45–54, 55–64, 65+ years), gender (male, female, non‐binary and other, undisclosed), ethnicity (White, Black African, Black other, Asian, mixed, other including undisclosed), region (London, Midlands and East, North, South, Scotland/Wales/unknown), highest level of education (to age 16, to age 18 or post‐16 qualification, undergraduate degree, postgraduate degree, other/missing), employment status (employed, unemployed, retired, not working due to sickness or disability, other including student and carer), having enough money to meet basic needs (yes always, most of the time, some of the time, no), household composition (living alone, 2 people living in household, 3–5 people, >6 people), year of HIV diagnosis (1995 or earlier, 1996–2001, 2002–2007, 2008–2013, 2014–2023), self‐reported viral load (undetectable, detectable, unknown/missing), ever‐diagnosed with cardiovascular disease, diabetes, asthma or chronic obstructive pulmonary disease (COPD), self‐reported body mass index based on self‐reported height and weight (BMI; ≥30 kg/m^2^, <30 kg/m^2^) and number of sexual partners in the last 3 months (0, 1, 2–5, >6 people). Symptoms of depression and anxiety were assessed using PHQ‐9 and GAD scores respectively using a definition of total score >=10 in each case. We also defined a variable ‘demographic group’ based on gender, sexuality and ethnicity, with seven categories as follows: GBMSM (gay, bisexual and other men‐who‐have‐sex‐with‐men), Black African heterosexual men, other heterosexual men, Black African women, other women, non‐binary or other gender or undisclosed gender or sexuality.
Statistical analysis
Characteristics were summarized for the study population. Associations of demographic, socio‐economic, HIV‐related, health and lifestyle characteristics with: (i) COVID‐19 history, (ii) ongoing symptoms consistent with long COVID among those with a history of COVID‐19 and (iii) incomplete vaccine uptake, were assessed using logistic regression, with unadjusted and adjusted odds ratios (aORs) with 95% confidence intervals (95% CI). In multivariable models, each factor of interest was included in a separate model adjusted for four pre‐defined ‘core variables’ only: age group, gender, ethnicity and year of HIV diagnosis group. All statistical analyses were performed in STATA version 18.0 (Stata Corp, College Station, TX, USA).
RESULTS
In all, 4271 of 4622 (92.4%) survey participants answered at least one question on COVID‐19. We excluded a further 83 participants due to missing age or year of HIV diagnosis, resulting in a final sample size for this analysis of 4188, who are described in Table 1. Of these people, there were 2486 (59.4%) GBMSM, 251 (6.0%) Black African heterosexual men, 351 (8.4%) other heterosexual men, 555 (13.3%) Black African women, 445 (10.6%) other women, 28 (0.7%) people with non‐binary or other gender, and 72 (1.7%) with undisclosed gender or sexuality. Overall, 2768 (66.1%) people were of White ethnicity, 977 (23.3%) of Black ethnicity and 443 (10.6%) of other or undisclosed ethnicity. The median age of participants was 53 years (inter‐quartile range, IQR 44–60). Nearly all (4146; 99.0%) participants were currently taking ART with a median duration of 12 years (IQR 8–18) and 3893 (93.0% of all participants) self‐reported a suppressed viral load. Just under half of participants reported some level of financial insecurity: 1888 (45.1%) did not always have enough money to meet basic needs, and 276 (6.6%) never had enough money. One in 5 (843/4107 20.5%) participants had depressive symptoms (PHQ‐9 score ≥ 10) and 610/4105 (14.9%) had anxiety symptoms (GAD‐7 score ≥ 10).
Impact of the pandemic on daily life
The most frequently reported impact of the COVID pandemic was lack of social contact (1825/4188, 43.6%), followed by worse mental health (1238/4188 29.6%), difficulties accessing healthcare/medication (1094/4188 26.1%), financial insecurity (1027/4188 24.5%) and having to work from home (942/4188 22.5%). Factors reported by 15% to 20% of participants were loss of employment/income, increased workload and relationship/family problems. (Figure 1). Between 10% and 15% of participants reported bereavement, reduced access to support services, and food insecurity.
Impact of COVID‐19 pandemic on multiple areas of daily life (n = 4188).
History of COVID‐19 and associated factors
In all, 2068 of 4188 (49.4%; 95% CI: 47.9%‐50.9%) reported a previous positive COVID‐19 test. In adjusted analysis, a COVID‐19 history was more frequent among younger participants, GBMSM compared to all other demographic groups, people with a higher level of education, people in employment, people who always had money to meet basic needs, people who lived in a household of two or more compared to living alone, people with self‐reported undetectable viral load compared to detectable or unknown and those with a higher number of sexual partners in the last 3 months. A COVID‐19 history was less common among people of Black ethnicity compared to White or other ethnicities, people whose gender was non‐binary/other or undisclosed compared to men and women, among those diagnosed with a cardiovascular disease, asthma or COPD and among those with symptoms of depression or anxiety (Table 1).
Post COVID‐19 syndrome (long COVID) among those with a history of COVID‐19
Out of the 2068 participants who indicated previously testing positive for COVID‐19, 1844 gave a reliable date of infection (between 2020 and date of survey completion) and had also answered questions regarding ongoing COVID‐19 symptoms. Among this group with a history of COVID‐19, 200/1844 (10.8%), 95% CI (9.5%–12.4%) reported they were continuing to experience symptoms at the time of survey completion and met the definition of long COVID (i.e., date of first COVID‐19 infection at least 3 months prior to the questionnaire date). Of the 200 people with long COVID defined in this way, 35 (17.5%), 46 (23.0%), 62 (31.0%) and 57 (28.5%) reported the date of first COVID or onset of symptoms to be 3–6 months, 6–12 months, 1–2 years and >2 years prior to the questionnaire date, respectively. In adjusted analyses, factors associated with having long COVID among those with a history of COVID‐19 were female gender compared to male, being unemployed or not working due to sickness/disability, not having money for basic needs, earlier HIV diagnosis date, having had a diagnosis of diabetes, asthma or COPD, having self‐reported BMI ≥30 kg/m^2^ and symptoms of depression and anxiety (Table 2).
COVID‐19 vaccine uptake and predictors of incomplete vaccine uptake
Overall, 4121 participants completed the question regarding the number of COVID‐19 vaccines received. Of these, 95.8% (3946) had received at least one dose, indicating that levels of COVID‐19 vaccine uptake were very high. Uptake of at least one dose of vaccine by ethnicity was 96.4%, 94.8%, 86.6%, and 98.8% among White, Black African, Black other, and Asian ethnicity respectively; by gender was 96.5% in men and 94.0% in women; and by age was 93.2%, 93.2%, 95.8%, 96.8%, and 98.3% among 18–34, 35–44, 45–54, 55–64, and over 65‐year‐olds respectively. Of those that had had at least one dose (n = 3946), 0.8% (n = 32) received one dose only; 11.2% (n = 442) received two doses, 46.6% (n = 1840) received three doses, and 41.4% (n = 1632) had received four or more doses.
Overall, 84.3% (3472/4121) of participants reported sufficient uptake of COVID‐19 vaccination (defined as at least three vaccine doses for people with HIV), and 649 (15.7%, 95% CI: 14.6%‐16.9%) had not (Table 3). The most common reasons given for incomplete vaccine uptake were not wishing to be vaccinated (147/649, 22.7%), not wanting to have all recommended doses (126/649, 19.4%) (Figure 2) and experiencing vaccine side effects after one or more doses (87/649, 13.4%). Only 0.9% of participants declared a medical contraindication to the vaccine.
Reasons given for not having received all the recommended doses of SARS‐CoV‐2 vaccine (n = 649).
In terms of demographic factors, incomplete COVID‐19 vaccine uptake was more likely among women, participants who were younger and those of Black ethnicity. For the demographic group classification, incomplete vaccine uptake was more likely among all other groups compared to GBMSM (Table 3). In adjusted analysis, demographic factors associated with incomplete vaccine uptake were younger age (aOR 1.60, 95% CI 1.17–2.19 for participants aged 18–34 compared with those aged 35–44), female gender (aOR 1.95, 95% CI 1.57–2.42 compared with men), Black ethnicity (aOR 1.88, 95% CI 1.48–2.38 for Black African ethnicity and aOR 3.62, 95% CI 2.38–5.51 for Black other ethnicity compared with White ethnicity) and demographic group. Indicators of poor socio‐economic status were also strongly associated with incomplete vaccine uptake: financial hardship (aOR 2.57, 95% CI 1.88–3.53 for not having money for basic needs compared with always having money for basic needs), non‐employment (aOR 2.18, 95% CI 1.64–2.89 for unemployment and aOR 1.58, 95% CI 1.15–2.16 for not working due to sickness/disability compared with those employed), lower education level (aOR 0.62, 95% CI 0.47–0.81 for postgraduate degree vs. education to age 16) and living in a household of six people or more (aOR 2.69, 95% CI 1.54–4.69 compared with people who lived alone). We also found that incomplete vaccine uptake was more likely among those in London and the Northern region compared to the Southern region, among those with a more recent HIV diagnosis, among those with self‐reported detectable or unknown viral load compared to undetectable, and among participants with symptoms of depression or anxiety.
DISCUSSION
Positive Voices 2022 is the largest UK survey in people with HIV and took place directly following a highly disruptive episode for health and social care systems due to the COVID‐19 pandemic. Overall, the pandemic had profound impacts on general population health and wellbeing with a disproportionate effect on many who already faced disadvantage and financial hardship [30]. COVID‐19 and its wide‐ranging impacts also exacerbated health inequalities in people with HIV. In this study, the most commonly reported impacts of the pandemic on daily life among people with HIV were lack of social contact and adverse effects on mental health, access to healthcare, and financial security.
At the time of the survey, half of the participants reported having previously tested positive for COVID‐19. This was more common among participants who were younger, identified as GBMSM, were employed, had higher education levels, were financially secure, shared their housing with other people, and had more than one sexual partner in the last 3 months. Many of these factors are known to be associated with greater levels of social mixing, which increase the risk of being infected with COVID‐19 [31]. The presence of other comorbidities and of symptoms of depression or anxiety may reduce levels of social mixing, which would explain the lower prevalence of a history of COVID‐19 associated with these factors in this study. In particular, during the pandemic period, people with HIV who had other health conditions may have avoided or reduced social contact to reduce the risk of acquiring a COVID‐19 infection.
In this study, 11% (200/1844) of people with HIV who had a history of COVID‐19, reported ongoing symptoms of COVID‐19 at 12 weeks or more since the onset of COVID‐19, consistent with long COVID [32]. Symptoms of long COVID include fatigue, cognitive impairment, and autonomic dysfunction as well as other physical and psychological manifestations [32, 33], but the underlying pathogenesis and therapeutic options remain unclear [34]. The reported prevalence of long COVID varies widely. The UK's Office for National Statistics (ONS) reported in March 2023 that approximately 2.6% of the UK population reported long COVID symptoms 12 weeks or more after COVID‐19 infection [2]. However, the WHO has reported a prevalence of 10%–20%, and studies that used matched control groups (without previous COVID‐19 infection) estimate the prevalence of long COVID symptoms after 12 weeks in the general population of 12.6% in a Dutch study and 6.6% at 6 months in a study using Scottish data [34, 35], which is more consistent with our findings. There are clinical, socio‐demographic, and immunological factors that may place people with HIV at increased risk of long COVID. Some studies, though often based on small cohorts, suggested a higher incidence of long COVID in people with HIV compared to HIV‐negative individuals, but findings have varied [32, 33].
We found several socio‐demographic and health‐related factors were associated with reporting long COVID, including female gender, financial hardship, unemployment, earlier HIV diagnosis date, living with other comorbidities such as diabetes, asthma/COPD, being obese (BMI ≥30) and having symptoms of depression or anxiety. The association of long COVID with symptoms of anxiety and depression has been reported elsewhere [33, 34], though the cross‐sectional nature of our study makes it impossible to identify if symptoms of anxiety and depression predated or followed the development of long COVID. However, while there remains a lack of treatment options for long COVID, screening for and treating symptoms of anxiety and depression in people with HIV with long COVID may give symptomatic benefit. The association of increased risk of long COVID in those of female gender has also been previously reported [36]; associations between ethnicity and long COVID remain less clear currently [37].
Overall, we found 95.8% of participants in PV2022 had received at least one dose of a COVID‐19 vaccine, and this was high (>86%) across all ethnic groups. In the general UK adult population, by the end of August 2022, 93.6% had received at least one dose of a COVID‐19 vaccine and 88.2% also had a second dose, though this varied by ethnicity, geographical location, and socio‐economic circumstances [2]. In particular, uptake of one dose of a COVID‐19 vaccine in Black African individuals in the United Kingdom was 60%–65% and for people of Black Caribbean ethnicity even lower at 55%–60% [2] compared to over 90% in people of White ethnicity. Additionally, REACT‐2, which was a repeated cross‐sectional community survey of adults in England, also reported that vaccine confidence varied by ethnicity and was highest in those of White ethnicity at 92.6% and lowest in those of Black ethnicity at 72.5% [38]. Vaccine confidence also varied by age and sex in REACT‐2 (higher in older groups and lower in women). The most cited reasons in REACT‐2 for declining the vaccine were concerns about long‐term health effects or side effects, with additional free text comments highlighting concerns about pregnancy and future fertility.
Notably, PV2022 found a higher prevalence of receiving at least one dose of the COVID‐19 vaccine among people with HIV of Black African ethnicity (94.8%), compared to people of Black ethnicity in the UK general population (65%). This may be linked to higher levels of engagement with healthcare services among people living with HIV, as well as high levels of trust and satisfaction with HIV services: PV2022 participants gave a mean HIV clinic satisfaction rating of 9.4 out of 10, with very high satisfaction across a range of patient‐reported experience measures [39]. This level of trust and engagement in HIV care may have facilitated the dissemination of information about the benefits of COVID‐19 vaccination and helped address any misinformation people may have received. However, it may also be an indication that people with HIV considered themselves at higher risk of severe outcomes from COVID‐19 as they were prioritized for earlier vaccination schedules [21] than national prioritization based on age criteria.
While single doses of COVID‐19 vaccines offered some protection, receiving the full recommended course of COVID‐19 vaccination, including boosters, substantially reduced the risk of severe disease and hospitalization in the general population and in people with HIV [40]. In PV2022, we found an incomplete vaccine course uptake (less than three vaccine doses) was reported by 16% of participants. Compared to GBMSM, incomplete vaccine uptake was more likely in all other demographic groups, including Black African heterosexual men, other heterosexual men, Black African women and other women. Younger age, lower educational attainment, unemployment, financial insecurity, living with at least six others, more recent HIV diagnosis, having detectable or unknown viral load, and symptoms of depression and anxiety were also associated with incomplete vaccine uptake, although the diagnosed comorbidities were not. It is possible that lower uptake of the complete vaccine course in women in our study may be partly related to inconsistent early messaging and misinformation around vaccine use and pregnancy and/or fertility. A recent meta‐analysis [22] of factors associated with COVID‐19 vaccine acceptance in people with HIV reported similar results to ours, that men had a higher likelihood of vaccine acceptance than women (odds ratio (OR), 2.06; 95% CI, 1.16–3.66); people with HIV aged less than 40 years had significantly lower odds of acceptance than those aged 40 years and above (OR, 0.70; 95% CI, 0.54–0.90); and those with a lower level of education had a lower likelihood of acceptance (OR, 0.60; 95% CI, 0.40–0.89). The review also found that participants' vaccine‐related perceptions and attitudes, including concerns about vaccine efficacy and safety or fear of contracting COVID‐19, were significantly negatively predictive of vaccine acceptability and uptake.
LIMITATIONS
Although largely representative of people with HIV currently in care in the United Kingdom, PV2022 slightly underrepresented people of Black African ethnicity, younger adults and heterosexual individuals compared with the overall UK population with HIV [39]. Those who participated in the survey and completed the sections on COVID‐19 may differ from those who did not with respect to socio‐demographic and health factors. Data on COVID‐19 infection and on vaccine uptake were self‐reported rather than linked to laboratory and immunization records. We also did not collect information on multiple episodes of COVID‐19. In addition, limited data were collected on persistent symptoms following COVID‐19 infection in order to meet the basic definition for long COVID, but more detail such as duration, severity and specific symptoms was not collected. The cross‐sectional survey design means causal inference is not possible, and the data are susceptible to recall bias, which may limit interpretation of results. Furthermore, we did not collect information on biomedical factors that may have influenced the development of post‐COVID syndrome, so we could not investigate factors such as SARS‐CoV‐2 persistence, neuroinflammation, abnormal clotting and immune dysfunction. Finally, the quantitative nature of the study prevented us from fully capturing the diversity of barriers and facilitators to the uptake of vaccination.
CONCLUSIONS
Our results indicate a that a significant proportion of people living with HIV felt the COVID‐19 pandemic had a negative impact on their social contact, mental health, healthcare access and financial security, which may suggest a widening of existing inequality among people with HIV. We found 11% of those who had previously tested positive for COVID‐19 had ongoing symptoms more than 3 months after COVID‐19 onset (long COVID) which was associated with several key factors including female gender, socio‐economic disadvantage, living with other comorbidities such as diabetes, lung disease and obesity and having poor mental health. In the United Kingdom, cultural contexts impacted levels of COVID‐19 vaccine uptake in the general population. The high uptake of at least one dose of the COVID‐19 vaccine across all ethnic groups in PV2022 compared to the UK general population might reflect the important role of HIV healthcare staff as a trusted source of information to address vaccine concerns, build vaccine confidence and combat the proliferation of misleading and false information, particularly through social media, termed an ‘infodemic’ by WHO [22]. However, we also documented incomplete COVID‐19 vaccine uptake of all recommended doses in 16% of participants, with lower uptake in women, young people, Black African individuals, those with socio‐economic disadvantage and those with symptoms of poor mental health. This suggests that there was a need for appropriately targeted vaccine uptake interventions among key population groups.
AUTHOR CONTRIBUTIONS
Study concept and design: M. Kall, C. Smith, C. Kelly, F. C. Lampe and A. J. Rodger. Statistical analysis: F. Nakagawa and R. Palich. Acquisition of data: M. Kall, J. Sewell, C. Kelly, A. Aghaizu, N. Mackie, F. C. Lampe and A. J. Rodger. Interpretation of data: F. Nakagawa, R. Palich, M. Kall, J. Sewell, C. Smith, A. Pelchen‐Matthews, A. Aghaizu, A. Sparrowhawk, C. Humphreys, F. C. Lampe and A. J. Rodger. Drafting of the manuscript: F. Nakagawa, R. Palich and A. J. Rodger. Critical revision of the manuscript for important intellectual content: All authors. Full access to all the data and responsibility for its integrity and the data analysis: F. Nakagawa.
FUNDING INFORMATION
This study represents independent research funded by the National Institute for Health Research (Programme Grants for Applied Research, A person‐centred Needs Informed model of Care for people with HIV, to improve wellbeing, mental health and reduce socio‐economic disadvantages and stigma, [NICHE]: NIHR202038). The views expressed in this publication are those of the authors and not necessarily those of the NHS, the National Institute for Health Research or the Department of Health and Social Care. Funding was also received from Gilead Sciences Ltd.
CONFLICT OF INTEREST STATEMENT
The authors declare no conflicts of interest.
Supporting information
Data S1. Supporting information.
The reference list from the paper itself. Each links out to its DOI / PubMed record.
- 1UKHSA Dashboard . Coronavirus (COVID‐19) in the UK. Accessed November 6, 2024. https://coronavirus.data.gov.uk
- 2Office for National Statistics . Coronavirus (COVID‐19). Accessed November 20, 2024. https://www.ons.gov.uk/peoplepopulationandcommunity/healthandsocialcare/conditionsanddiseases
- 3COVID‐19: The Green Book, Chapter 14a. Accessed November 20, 2024. https://www.gov.uk/government/publications/covid-19-the-green-book-chapter-14a
- 4Favara G , Barchitta M , Maugeri A , Faro G , Agodi A . HIV infection does not affect the risk of death of COVID‐19 patients: a systematic review and meta‐analysis of epidemiological studies. J Glob Health. 2022;12:05036.35972980 10.7189/jogh.12.05036 PMC 9380965 · doi ↗ · pubmed ↗
- 5Bertagnolio S , Thwin SS , Silva R , et al. Clinical features of, and risk factors for, severe or fatal COVID‐19 among people living with HIV admitted to hospital: analysis of data from the WHO Global Clinical Platform of COVID‐19. Lancet HIV. 2022;9:e 486‐e 495.35561704 10.1016/S 2352-3018(22)00097-2PMC 9090268 · doi ↗ · pubmed ↗
- 6Theodore DA , Branche AR , Zhang L , et al. Clinical and demographic factors associated with COVID‐19, severe COVID‐19, and SARS‐Co V‐2 infection in adults: a secondary cross‐protocol analysis of 4 randomized clinical trials. JAMA Netw Open. 2023;6(7):e 2323349. doi:10.1001/jamanetworkopen.2023.23349 37440227 PMC 10346130 · doi ↗ · pubmed ↗
- 7Petrilli CM , Jones SA , Yang J , et al. Factors associated with hospital admission and critical illness among 5279 people with coronavirus disease 2019 in New York City: prospective cohort study. BMJ. 2020;369:m 1966. doi:10.1136/bmj.m 1966 32444366 PMC 7243801 · doi ↗ · pubmed ↗
- 8Yang X , Sun J , Patel RC , et al. Associations between HIV infection and clinical spectrum of COVID‐19: a population level analysis based on US National COVID Cohort Collaborative (N 3C) data. Lancet HIV. 2021;8:e 690‐e 700.34655550 10.1016/S 2352-3018(21)00239-3PMC 8514200 · doi ↗ · pubmed ↗