A haplotype-resolved genome assembly and gene expression map of Cushion willow
Jindan Wang, Kaiyun Chen, Rengang Zhang, Yuan Huang, Jiahui Chen

TL;DR
This paper presents a high-quality, haplotype-resolved genome and gene expression map for Cushion willow, a plant adapted to alpine environments.
Contribution
The study provides a near telomere-to-telomere genome assembly and a detailed transcriptomic map for Cushion willow.
Findings
The Cushion willow genome is now haplotype-resolved and nearly complete.
A high-quality gene expression atlas was created to support future research.
The updated genome enhances potential for studying alpine adaptation and sex determination.
Abstract
Salix brachista, commonly known as Cushion willow, is a common component of subnival alpine assemblages and a dioecious or monoecious plant with a creeping stem and numerous lateral branches. Cushion willow takes cuttings more easier and has a specific sex system, making it a suitable system for studying the evolution of plant sex determination, adaptive evolution of alpine plants, and mining stress resistance gene resource that cope with the hostile alpine environment. Therefore, Cushion willow has potential value in genetic improvements for willows used as bioenergy crops, in gardening, and as ornamental plants. However, the genome of Cushion willow still contains some un-assembled repetitive sequences, and there is limited availability of a gene expression atlas, which hinders its potential use for the aforementioned purposes. Here, we updated the genome of Cushion willow to be…
Genes, proteins, chemicals, diseases, species, mutations and cell lines named across the full text — each resolved to its canonical identifier and authoritative record.
Click any figure to enlarge with its caption.
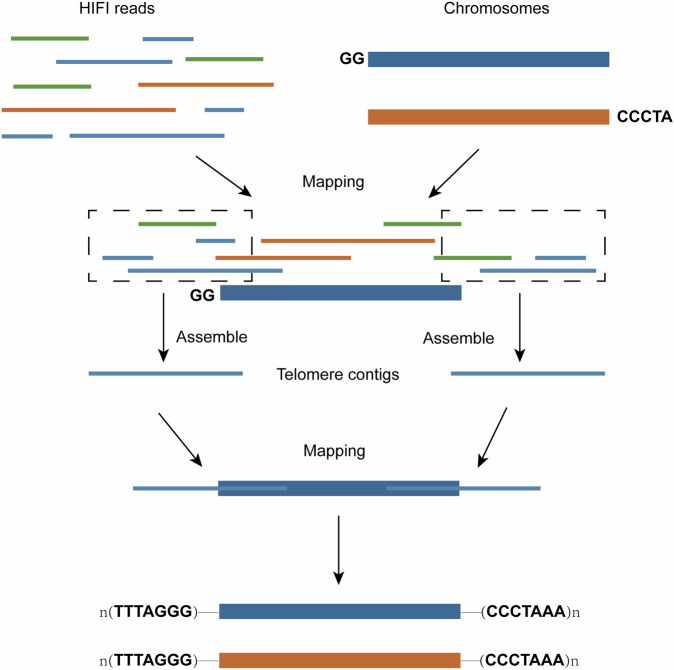 Figure 1
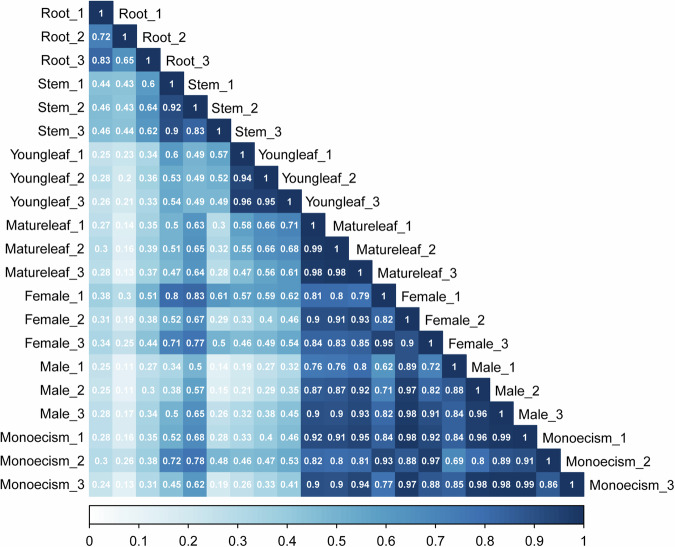 Figure 2
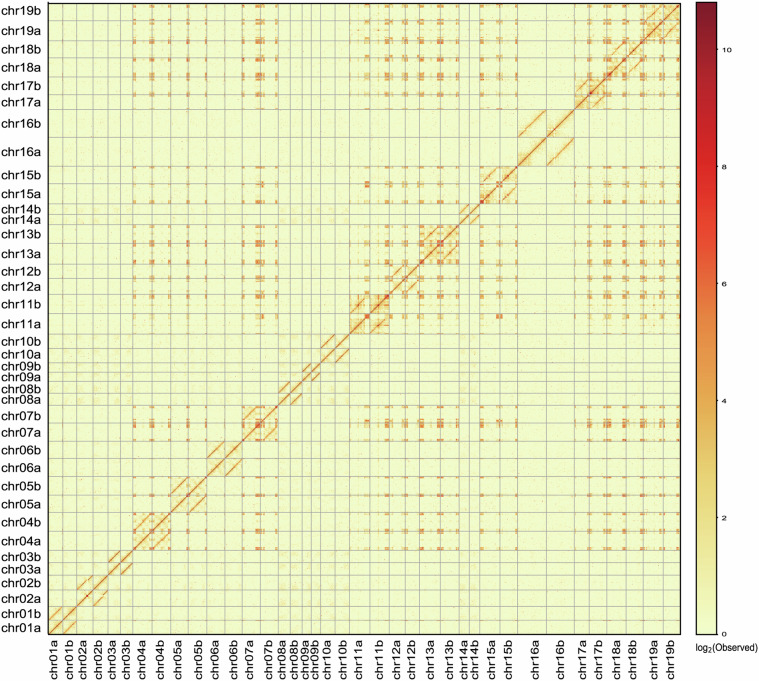 Figure 3
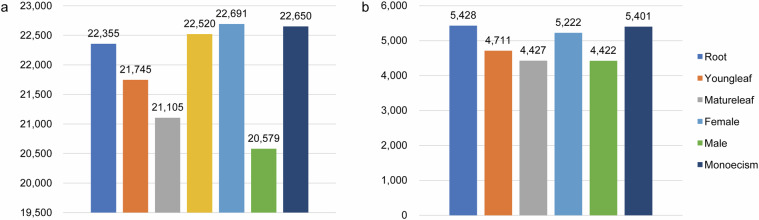 Figure 4
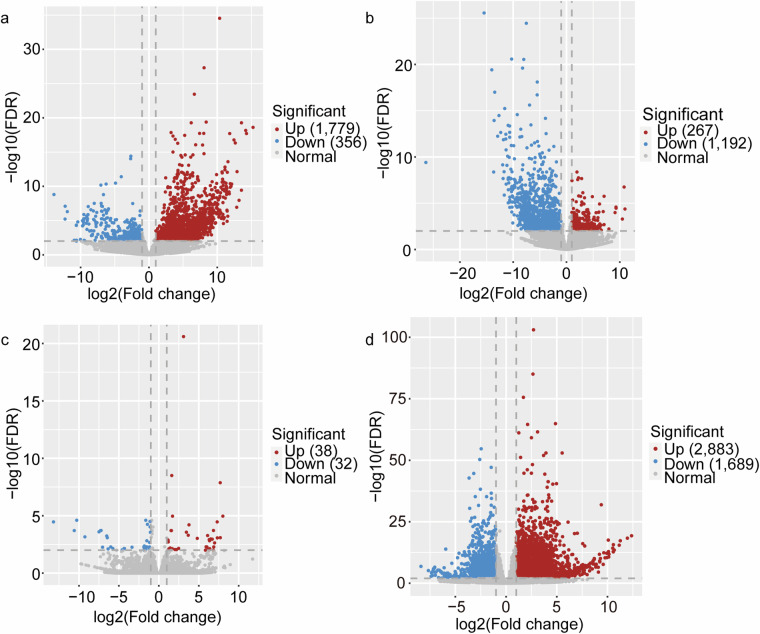 Figure 5
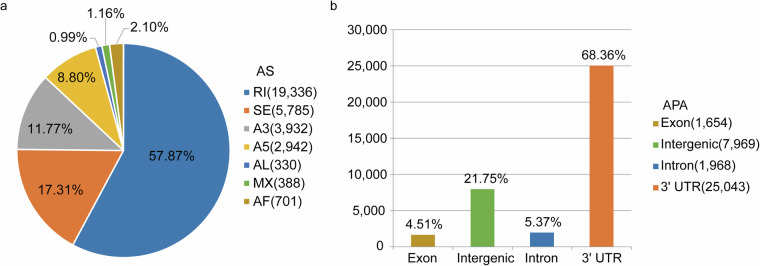 Figure 6
- —Second Tibetan Plateau Scientific Expedition and Research (STEP) program (2024QZKK0200), NSFC (32070226), Yunnan Fundamental Research Projects (202101AS070032), the CAS “Light of West China” Program (
Peer Reviews
No public reviews on file for this paper yet. If you reviewed it on a platform where reviews are public (OpenReview, ICLR, NeurIPS, ICML), you can paste yours below so the community can read it here.
Videos
No videos yet. Explain this paper in a talk, walkthrough, or lecture? Add one.
Taxonomy
TopicsBioenergy crop production and management · Genomics and Phylogenetic Studies · Chromosomal and Genetic Variations
Background & Summary
Salix L. (commonly known as willows) is the largest genus of woody plants in the Northern Hemisphere within the family Salicaceae s.str., comprising ca. 400–520 species^1^. Willows have significant economic value due to their use in ornamental use, landscaping, soil engineering, wind prevention, etc^1–3^. Shrub willows have been identified as a promising biomass crop and are widely used for biomass production due to their ease of propagation and ability to grow quickly in short rotation coppice cycles with minimal fertilizer inputs. Therefore, they are considered the most suitable woody bioenergy crops and are widely planted^4^. To fully utilize the potential of renewable energy, it is important to maintain willows free of pests and diseases while improving yields without significantly increasing the need for fertilizers and water^5^. Willows are dioecious, though some species are monoecious, making them an excellent taxon for studying plant sex determination evolution in recent years. Willows exhibit both ZW and XY sex systems, and the location of their sex-determining regions is dynamic and varies among species^6–10^. Furthermore, willows are capable of vegetative reproduction from stumps, branches or roots, which allows for the simple generation of clones with the same genetic material^2^. These features make them convenient for control experiments aimed at studying gene functions.
Cushion willow (Salix brachista C. K. Schneider) is a common component of alpine subnival assemblages of the genus Salix L. It is a cushion plant with a creeping stem and a large number of lateral branches, growing to a height of usually no more than 5 cm^10^. Although mostly dioecious, we observed hermaphrodite flowers in one population, indicating that its sex determination region may be undergoing dynamic evolution. This makes it a very suitable system for studying willow sex determination evolution. It is mainly distributed in subnival zones with an elevation of around 4000 m (and occasionally found in lower elevations around 3000 m) in the Hengduan Mountains and adjacent areas, i.e. the eastern Himalaya and middle Yunnan Plateau. These high-altitude areas, such as the alpine subnival zone, are characterized by harsh environments, including strong solar radiation, strong winds, low temperatures, dramatic daily temperature fluctuations, hypoxia, poor soil, and uneven humidity and precipitation^11^. Plants in the alpine subnival zone, such as the Cushion willow, must cope with the harsh alpine environment. As a result, they have accumulated numerous stress resistance genes in their genome during their adaptive evolution to the alpine environment^12–14^.
In summary, Cushion willow is a suitable system for studying the evolution of plant sex determination, adaptive evolution of alpine plants, mining stress resistance genes in alpine plants, and studying related gene functions. Therefore, this species could have potential value in genetic improvements for willows used as bioenergy crops, in gardening, and as ornamental plants. However, the previously reported genome of Cushion willow still contains several repetitive sequences, such as telomeres and 5S rDNA, which remain un-assembled. Furthermore, there is a limited availability of a gene expression atlas. These factors hinder its potential value as mentioned above.
In this study, we present a high-quality genome and a transcriptome map of the Cushion willow, resolved by haplotype. (a) The haplotype-resolved, chromosome level genome was assembled using PacBio Revio System in circular consensus sequence, Illumina high-throughput chromosome conformation capture sequencing (Hi-C), Illumina high-throughput RNA-seq, and Nanopore full-length transcript technologies. We assembled 38 chromosomes that were classified as haplotype A and haplotype B. This result is consistent with previous karyotyping results (2n = 38)^15^. Haplotype A has a genome size of 401.5 Mb and contig N50 length of 22.6 Mb, while haplotype B has a genome size of 386.2 Mb and contig N50 length of 21.8 Mb (Table 1). The high-resolution genome annotated to 57,169 genes that contained 53,238 protein-coding genes and 3,931 RNAs (Supplement Table 5) (b) Transcripts were obtained from seven different organs, and full-length transcripts were obtained for mixed samples of these tissues. A total of 28,587 non-redundant transcripts were obtained from seven organs using Illumina sequencing. Additionally, 164.5 million full-length transcripts were obtained through Nanopore sequencing, with a mean read length of 981 bp and an N50 length of 1,194 bp. The Kyoto Encyclopedia of Genes and Genomes (KEGG) and Gene Ontology (GO) databases were used to annotate these transcripts and determine their function. Additionally, differentially expressed genes (DEGs) were identified in pairs of organs, and 33,414 alternative splicing (AS) events and 36,634 alternative polyadenylation (APA) sites were detected using full-length transcripts, which are more accurate than Illumina data (Figs. 5 and 6). The genome and transcriptome map of Cushion willow, resolved by haplotype, will provide valuable reference material for studying genetic improvement of Cushion willow plants and other alpine Salix species, as well as exploring the adaptive evolution of alpine extreme environments on the Qinghai-Tibet Plateau.Table 1. Summary of the S. brachista genome assembly data.StatisticHaplotype AHaplotype BTotal size (bp)401,494,730386,222,989Number of gaps11Size of gaps (bp)100100GC content (%)34.8834.88CharacteristicScaffoldScaffoldNumber of chromosomes1919Max. (bp)36,017,66634,689,865Mean (bp)21,131,30220,327,526Min. (bp)11,424,55711,622,248N10 (bp)25,909,80824,071,074N50 (bp)22,629,16821,845,516N90 (bp)15,550,44714,821,491L1022L5088L901617
Methods
Sample collection
For the extraction of genomic DNA, fresh young leaves of S. brachista were collected from Tianbao Mountain, Shangri-La Country, Yunnan Province, China. Additionally, we collected RNA from seven organs (roots, stems, young leaves, mature leaves, monoecious flowers, female flowers and male flowers) of Cushion willow plants. For each organ, three biological replicates were collected from different plants. The newly obtained materials were promptly frozen in liquid nitrogen. The related sequences were obtained from Kaitleai Mingjing Gene Technology (Beijing) Co., Ltd.
Genome and transcriptome sequencing
For the genome, we extracted total DNA using the CTAB method for sequencing^16^. Before long-read sequencing, the DNA was purified by DNeasy Plant Mini Kit (Qiagen, Germantown, MD, USA). The purity and integrity of the DNA were subsequently assessed by 1% agarose gel electrophoresis. Qubit 2.0 fluorometer (Life Technologies, Carlsbad, CA, USA) was using to assess the concentration of DNA. Following the positive assessment result, we constructed a PacBio long-read library and generated 38.3 Gb (~2.11 million reads) of HiFi raw data on the PacBio Sequel II platform (Supplementary Table 1). We prepared a Hi-C library following standard protocols^17^. The library was subsequently sequenced on the Illumina NovaSeq 6000 platform. Approximately 49.7 Gb (330.98 million reads) of Hi-C raw data were obtained (Supplementary Table 1).
For the transcriptome sequencing of seven tissues, total RNA was extracted from 21 individual samples across seven organs using the Plant RNA Kit. The RNA quality and concentration were determined using a Nanodrop spectrophotometer and 1% agarose gel electrophoresis. In order to construct cDNA Illumina libraries, Oligo(dT) magnetic beads were utilized to eliminate rRNA, tRNA, and microRNA from the high-quality RNA. The mRNA was then reverse transcribed to yield cDNA by reverse transcriptase, and poly (A) and adapters were introduced. Finally, the cDNA was amplified by PCR to generate the cDNA library, which was subsequently sequenced on the Illumina NovaSeq. 6000 platform. Approximately 5 Gb of raw data were obtained from each sample (Supplementary Table 2). For Nanopore transcriptome sequencing, we first mixed the total cDNA from the five different organs (roots, mature leaves, young leaves, female flowers, and stems) of Cushion willow. The main step was adding a rapid adapter to each cDNA sequence to construct a 1D full-length library. This 1D library was run on an Oxford Nanopore PromethION. Finally, a total of ~16 Gb (16 million reads) of clean full-length transcripts was obtained (Supplementary Table 1).
Haplotype genome assembly
We assembled the Cushion willow genome by combining PacBio single-molecule real-time long-read sequences, high-throughput chromatin conformation capture (Hi-C) sequences and Illumina short-read sequences from the National Center for Biotechnology Information (NCBI) Sequencing Read Archive (SRA) database (Project: PRJNA472210, Run: SRR9021434)^18^. First, we used HiFi data to initially assemble contigs using Hifiasm (v_0.16.1-r375)^19^. The Hi-C reads were compared with the contigs using Juicer^20^ and assisted in chromosome assembly using 3D-DNA (v_180922)^21^. We manually checked and adjusted the incorrect assemblies using Juicebox^22^. After two rounds of assisted assembly and manual correction, haplotype chromosome frames were generated. The gap in the chromosome was subsequently closed using TGS-GapCloser^23^ software based on the HiFi data (parameters:–ne–min_match 1000). Because of the chromosomes with unassembled telomeres or shorter telomeres, the HiFi reads were reused for comparison with the above-described assembled haplotype chromosomes by Minimap2^24^. Hifiasm software was used to reassemble the sequences near the telomeres, and the contigs obtained from the assembly were compared with the chromosomes to extend the chromosome telomeres outward and assemble a more complete telomere sequence TTTAGGG (Fig. 1)^25,26^. The assembled genome was subjected to two rounds of error correction using the software Nextpolish^27^ with Illumina data. Redundans^28^ was used to remove redundant sequences (rRNA fragments and low average coverage fragments)^25^. Finally, the two haplotype genomes were fully resolved at the chromosome level. The chromosome number and orientation were renamed according to the chromosome assembly of the Cushion willow published previously^15^. GetOrganelle (v_1.7.5)^29^ was used to assemble the chloroplast and mitochondrial genomes. The sizes of the chloroplasts and mitochondria were 155,612 bp and 630,081 bp, respectively (Supplementary Table 3).Fig. 1. The schematic of assemble telomere to telomere.
Gene identification and functional annotation
Before annotating the genomic information, we prepared two datasets for annotation. (1) We used publicly available homologous protein sequences from 17 species of the Salicaceae (S. brachista, S. dunnii, S. purpurea, S. suchowensis, S. viminalis, Populus alba, P. alba var. pyramidalis, P. alba x P. glandulosa, P. davidiana x P. alba var. pyramidalis, P. deltoides, P. euphratica, P. ilicifolia, P. pruinosa, P. simonii, P. tremula, P. tremuloides, P. trichocarpa) and Arabidopsis thaliana to combine 278,011 non-redundant protein sequences as homologous protein evidence for gene annotation. (2) The Oxford Nanopore Technology (ONT) transcriptome data were aligned to the reference genome using Minimap2^24^, followed by the use of Stringtie2 (v_2.2.1)^30^ to infer the transcript structure and assemble 85,880 transcripts. The Illumina RNA-seq data were downloaded from SRR7341541 in the SRA database^18^, which included 330,394 transcripts. Using PASA^31^, the above transcript data were merged into a set of transcript sequences containing 194,516 transcripts with structural annotations. Transposon elements were identified from scratch using EDTA^32^ (parameters:–sensitive 1–anno 1) to generate a TE library. Then, repeat regions in the genome were identified using RepeatMasker (http://www.repeatmasker.org/RepeatMasker/). A total of 1,138,238 repetitive sequences were identified, with a total length of 420,868,210 bp, accounting for 53.38% of the total genome length (Supplementary Table 4).
In the process of genome annotation, we undertook the following tasks: annotation, integration, and upgrading of genomes. Initially, we employed the MAKER2^33^ annotation pipeline to preliminarily integrate three types of annotations: ab initio gene prediction, homologous protein, and transcript evidence. We then masked repetitive sequence regions in the genome using RepeatMasker (default parameters). The AUGUSTUS^34^ software was utilized for ab initio prediction of the coding genes. The BLASTN and TBLASTX methods were employed for expression gene annotation, which was based on transcript evidence alignment with the genome. Exonerate^35^ was used to polish the annotation of expressed genes. Subsequently, AUGUSTUS was run again using the previous prediction results of expressed genes. Alternative splicing and UTR sequences were added to the predicted genes according to transcript evidence. The EVidenceModeler (EVM)^36^ was then run to integrate the results of gene annotation by MAKER2 and transcript evidence by PASA. Finally, the consistency gene annotation integrated results by EVM underwent two rounds of iterative upgrades using PASA. Upon obtaining these results, we removed coding frames containing stop codons, those without start codons or stop codons, and filtered overly short sequences less than 150 bp. Moreover, we used tRNAScan-SE^37^ to annotate tRNAs, Barrnap (v_0.9) (https://github.com/tseemann/barrnap) to annotate rRNAs and RfamScan^38^ to annotate various noncoding RNAs. In summary, we obtained 53,238 protein-coding genes, 1,414 rRNAs, 1,301 tRNAs and 1,216 ncRNAs (Supplementary Table 5).
After the genes were identified, their functional and structural characteristics needed to be annotated. This step involved the annotation of gene function using the homologous gene database eggNOG-mapper^39^ for GO and KEGG annotation. Furthermore, we obtained structural information about the genes through motif and domain annotations. This was achieved by employing InterProScan^40^ to compare structural domain similarities based on sub-databases of InterPro, such as the PRINTS, Pfam, SMART, and PANTHER databases. To determine the best alignment of the genes, Diamond^41^ was used to align protein sequences with several protein databases (Swiss_Prot, TrEMBL, NR and Arabidopsis) using the parameters identity > 30% and E value < 1e-5.
Identification and expression analysis of allele genes
We identified alleles by the AlleleFinder pipeline (https://github.com/sc-zhang/AlleleFinder) based on the above high-quality haplotype genomes. Briefly, allele data were obtained from MCScanX^42^, GMAP^43^ and NCBI BLAST + based on two strategies: similarity and collinearity. First, using MCScanX, genes in syntenic regions were considered to be alleles. Then, the GMAP was used for further screening. Subsequently, alleles with more than 80% sequence similarity were recognized as pairs of alleles.
The RNA-seq data from the mature leaves of Cushion willow were used to analyze allele expression in both haplotypes. Initially, the adapters were trimmed, and the low-quality reads (<50 bp) were filtered out using Trimmomatic (v_0.39)^44^ software. Subsequently, the transcripts of the alleles were aligned to the homologous genome using HISAT2 (v_2.2.1)^45^ software. The fragments per kilobase of exon model per million mapped reads (FPKM) values were calculated to show allele expression levels via Stringtie2.
Transcript alignment and assembly
To obtain better analysis results, it is essential to filter the RNA-seq raw data by removing the adapters and trimming the low-quality reads via Trimmomatic. Then, through the use of the quality control software FastQC (v_0.11.9) (http://www.bioinformatics.babraham.ac.uk/projects/fastqc/) and MultiQC (v_1.12)^46^, we obtained information on the clean data, including GC content and base sequence quality (Supplementary Table 2), of each sample. This information helped us to determine whether the results met the downstream analysis requirements.
The clean data from 21 samples were aligned, and the transcripts were assembled. First, HISAT2 was used to align the clean data with the reference genome (choosing the high-quality haploid genome A), thereby obtaining positional information about the transcripts. Then, using SAMtools (v_1.15)^47^, we obtained sorted binary bam files that revealed detailed information about the alignment results. Moreover, Stringtie2 was used to assemble the aligned reads to obtain the assembled transcripts of each sample. Overall, 28,587 non-redundant transcripts were assembled from seven organs.
It is necessary to conduct a repeated correlation test and eliminate samples with large differences in replicates to ensure the accuracy and value of the results. We computed the Pearson correlation coefficients among three biological replications based on the gene’s FPKM. The results revealed that the lowest Pearson’s correlation coefficient (r^2^) was 0.65, implying that all other correlation coefficients exceeded this value, this indicates robust replication among the biological replicates (Fig. 2).Fig. 2. Correlation analysis of 21 RNA-seq samples from S. brachista. The dark blue color signifies greater similarity and repeatability between the two replicates.
Determination of relative gene expression levels
The relative expression levels of each gene were calculated for various aspects, including high expression, organ-specific expression and differential expression. All calculations were based on the normalization of gene expression by FPKM values, which eliminated feature length and library size effects. We obtained gene expression tab files with FPKM values using the ‘-A’ parameter of Stringtie2. First, genes were screened and identified as expressed if FPKM > 0.3. Using a cutoff of FPKM > 20, distinctly high expression genes were detected in the root, stem, young leaf, mature leaf, monoecism flower, female flower and male flower of Cushion willow. Then, we subsequently compared and calculated the organ-specific expression of the genes via the R package Venn (v_1.10). Additionally, the differentially expressed genes (DEGs) were identified by the R package DESeq2 (v_1.32.0)^48^. Unlike FPKM, DESeq2 employs a negative binomial as its reference distribution and offers a unique normalization method called read count. Benjamini and Hochberg’s approach was used to adjust the resulting P values, thereby controlling the false discovery rate (FDR). The DEGs were designated as having an FDR < 0.01 and a log_2_ |fold change| > = 1 according to DESeq2.
GO and KEGG enrichment analysis
To predict the functions and pathways of genes across varying expression levels (highly expressed, organ-specifically expressed, differentially expressed), we annotated these genes using the GO and KEGG background files, which consist of three columns of information on gene ID, term and function/pathway extracted from the above genomic annotations. Using the R package clusterProfiler (v_4.0.5)^49^, the functions and pathways of genes at different expression levels were annotated by the GO and KEGG background files, respectively (pvalue: 0.05, padjustmethod: Benjamini-Hochberg). Finally, we compiled lists of the most notable gene annotations.
Identification of AS events and APA sites
Based on the ONT full-length transcriptome data and the haplotype A genome of S. brachista, we performed an identification analysis of AS events and APA sites. First, we used the python script cdna_classifier.py in Pychopper2 (v_2.7.2) (https://github.com/epi2me-labs/pychopper) to trim and identify full-length transcripts. The full-length transcripts were self-corrected using the Flair (v_2.0.0)^50^ analysis process. Finally, the above full-length transcripts were utilized for the identification of variable AS events using the software package SUPPA2 (v_2.3)^51^ with default parameters. AS events were classified into seven categories: skipping exon (SE), mutually exclusive exon (MX), alternative 3’ splice site (A3), alternative 5’ splice site (A5), alternative first exon (AF), alternative last exon (AL) and retained intron (RI). APA sites were identified using LAPA (v_0.0.5)^52^.
Data Records
The relevant raw data reported in this paper have been deposited in the National Genomics Data Center (NGDC)^53^, Beijing Institute of Genomics, Chinese Academy of Sciences/China National Center for Bioinformation under the BioProject accession number PRJCA022812 and PRJCA023075. The raw sequence data of genomic, including PacBio HiFi long-reads, Hi-C reads, have been deposited in the Genome Sequence Archive (GSA)^54^ at NGDC under the accession number CRA014642^55^. And raw sequence data of transcriptomic, which includes RNA-seq data from seven organs and Nanopore full-length transcript data, have also been deposited in the Genome Sequence Archive (GSA) at NGDC under the accession number CRA014607^56^. Genome assembly and annotation data has been deposited in the Genome Warehouse (GWH) in NGDC under the accession number GWHERDS00000000^57^. The allele genes data has been deposited in the figshare database^58^. The transcriptomic map data includes the FPKM of gene among seven tissues^59^, the GO and KEGG enrichment results of different expression levels^60^, AS events and APA sites^61^ can be store in the figshare database. The above data have been deposited in NCBI. The genomic raw data can be found in Sequence Read Archive (SRA) under the SRR32329603^62^ and SRR32329604^63^, while the assembly data has been deposited at GenBank under the accession JBLWMQ000000000^64^ and JBLWMR000000000^65^, and the genome’s annotation information is available in the figshare^66^. Additionally, the transcriptomic raw data have been deposited in the SRA under the accessions from SRR32340655 to SRR32340676^67–88^, and annotation files, read count files, FPKM files, and other processed files can be accessed through the GEO accession GSE289615^89^.
Technical Validation
Evaluation of the assembled and the annotated genome
The assembled haplotype genomes contained two high-quality haploid genomes, haplotype A and haplotype B. Haplotype A had 19 chromosomes with a genomic size of 401 Mb, while Haplotype B consisted of 19 chromosomes with a genomic size of 386 Mb. The GC content of both haploid genomes was 34.88% (Table 1). The scaffold N50 lengths of haplotype A and haplotype B were 22.63 Mb and 21.85 Mb, respectively (Table 1). Only one gap was found on the chromosome 15 of haplotype A and haplotype B (Supplementary Table 3).
The short reads and long reads were mapped to the assembled genome to evaluate genomic coverage by BWA^90^ and Minimap2. The RNA-seq reads were aligned to the assembled genome using HISAT2. After filtering out the non-primary alignment reads, we obtained a higher map ratio and coverage of sequencing reads (Table 2). We calculated the heterozygosity and single base error rate using Illumina reads, yielding a heterozygosity rate of approximately 0.0079% and an error rate of about 9.6e-06 (Q50). Using Hifi, Illumina and ONT data, we valued the GC content and sequencing depth under different GC content. The findings revealed no significant GC bias (Supplementary Fig. 1). The evaluation of the assembled genome was performed by BUSCO (v_2.0.1)^91^ with 1,440 groups from the lineage dataset embryophyta_odb10. The assembled genome BUSCO results indicated that complete core genes (including single-copy and multiple-copy genes) accounted for 96.0%, while the missing genes accounted for 3.2% (Table 3). This is consistent with previous WGD studies, suggesting that most of the genome of the Cushion willow has experienced duplication throughout its evolutionary history^15^. These BUSCO results showed a relatively high degree of gene completeness.Table 2. The map ratio and coverage of reads obtained by different sequencing methods.DatasetReads mapped (%)Bases mapped (%)> = 1× (%)> = 5× (%)> = 10× (%)> = 20× (%)Illumina98.798.799.9599.393.943.5HiFi99.699.699.9599.999.798.3ONT66.795.399.999.396.784.1RNA-seq92.797.822.313.110.78.4Table 3BUSCO evaluation of the assembled genome and the annotated proteome.TypeGenomeProteomeComplete BUSCOs (C)96.0%97.7%Complete and single-copy BUSCOs (S)6.5%2.4%Complete and duplicated BUSCOs (D)89.5%95.3%Fragmented BUSCOs (F)0.8%0.9%Missing BUSCOs (M)3.2%1.9%Total BUSCO groups14401440
By mapping the Hi-C data to the final assembled genome with Juicer, we observed strong chromosomal clustering and assembly (Fig. 3). A comparison of sequences from the published genome and the two haploids was conducted using Minimap2. The results indicated that the chromosome order was identical in both instances (Supplementary Fig. 2). Characteristic sequences such as telomeres, tandem repeats, and 5S and 8-5.8-28S rDNAs were identified on the chromosomes (Supplementary Fig. 3). In summary, the two haplotypes exhibited comprehensive and well-assembled assemblies. The high-quality Cushion willow genome can serve as a reference for studies in the future.Fig. 3. Hi-C heatmap of the two final assembly haploids. The colors from yellow (low) to red (high) indicate the strength of the interaction.
A total of 52,715 protein-coding genes were identified across various databases, accounting for 99.02% of the total (Table 4). The assessment of the annotated proteome was conducted using BUSCO, revealing that 97.7% of the complete BUSCOs were present in the annotated proteome (Table 3).Table 4. Summary of predicted gene annotations in the S. brachista genome.Annotation methodDatabaseGene numberPercentage (%)All protein-coding genes53,238100Annotated by eggNOG-mapperGO26,39049.57KEEG pathway15,06328.29KEEG_KO24,41345.86eggNOG47,65689.52COG51,32696.41EC10,63519.98Unannotated1,9123.59Annotated by DiamondSwiss_Prot39,50374.20TrEMBL51,79997.30NR51,76297.23A. thaliana47,54389.30Unannotated1,3622.56Annotated by InterProScanPfam43,49481.70CDD19,11635.91PRINTS7,68014.43PIRSF3,5756.71PANTHER50,18994.27Interpro45,70985.85Phobius19,08835.85Gene3D36,20268.00SUPERFAMILY34,16564.17TIGRFAM5,64310.60MobiDBLite23,68844.49Coils8,60116.16TMHMM13,00324.42SMART17,53232.93Unannotated9501.78TotalAnnotated52,71599.02Unannotated5230.98
To characterize the assembly of alleles in the two haplotype genomes, we performed allele genes by the AlleleFinder pipeline. In total, 23,744 allele genes were identified, comprising 1,459 paralog and 647 tandem genes (Supplementary Table 6). The 17,885 pair of allele genes expressed.
Evaluation of the assembled transcriptome
The clean data from 21 samples were aligned to haplotype genome A using HISAT2, yielding an average mapping rate of 86.63%. This suggests a significant proportion of the mapped clean reads (Supplementary Table 7). Following the use of the reference assembly, we obtained 28,587 non-redundant transcripts. The mean number of expressed genes per tissue was determined as 21,949 using the threshold FPKM > 0.3, with highly expressed genes comprising 22.62% of all expressed genes (FPKM > 20) (Fig. 4). Using Venn showed the organ-specific expression genes (Supplementary Fig. 4). Furthermore, we identified 17,387 DEGs across seven organs (Supplementary Fig. 5). We classified the expressed genes based on GO terms and KEGG pathways. Our analysis showed that genes with different expression levels were enriched in various metabolic pathways and functions, with a significant proportion of DEGs being associated with specific pathways and functions in both KEGG and GO (Fig. 5). Full-length transcript data can identify more accurately AS and APA sites, which are crucial for researching the regulatory mechanisms of gene expression. Using the ONT full-length transcripts, we discovered a total of 33,414 AS events, including RI, 19,336; SE, 5,785; A3, 3,932; A5, 2,942; AL, 330; MX, 355; and AF, 701 (Fig. 6a). Through the use of LAPA, we identified 36,634 poly (A) sites distributed across intergenic regions, 3’ UTRs, introns, and exons (Fig. 6b).Fig. 4. The expression levels of genes across seven organs of S. brachista. (a) The gene profiles of seven various organs (FPKM > 0.3). (b) Genes with high expression levels in seven different organs. (FPKM > 20).Fig. 5. Volcano plots of DEGs in each pairwise comparison of different flowering lines and young leaves vs. mature leaves. (a) Female vs. Male. (b) Female vs. Monoecism. (c) Male vs. Monoecism. (d) Young leaf vs. Mature leaf. Blue is up, red is down, and gray is not significant.Fig. 6. The types and numbers of AS events and APA sites. (a) Alternative splicing events. SE, skipping exon; MX, mutually exclusive exon; A3, alternative 3’ splice site; A5, alternative 5’ splice site; AF, alternative first exon; AL, alternative last exon; RI, retained intron. (b) APA, Alternative polyadenylation sites.
The aforementioned evidence collectively indicates that the transcriptomic map is both dependable and precise. The preliminary transcriptomic map of the Cushion willow offers invaluable resources for elucidating the adaptation strategies of this species to environments at extremely high altitudes.
Supplementary information
Supplementary information of A haplotype-resolved genome assembly and gene expression map of Cushion willow
The reference list from the paper itself. Each links out to its DOI / PubMed record.
- 1Skvortsov, A. K. Willows of Russia and adjacent countries. University of Joensuu, Joensuu, Finland (1999).
- 2Fang, Z. F., Zhao, S. D. & Skvortsov, A. K. Flora of China: Salicaceae. 139–274 (Science Press, 1999).
- 3Wilkerson, D. G., Taskiran, B., Carlson, C. H. & Smart, L. B. Mapping the sex determination region in the Salix F 1 hybrid common parent population confirms a ZW system in six diverse species. G 3 (Bethesda)1210.1093/g 3journal/jkac 071 (2022).10.1093/g 3journal/jkac 071PMC 915708835333299 · doi ↗ · pubmed ↗
- 4Xu, M. et al. TGS-Gap Closer: A fast and accurate gap closer for large genomes with low coverage of error-prone long reads. Gigascience 910.1093/gigascience/giaa 094 (2020).10.1093/gigascience/giaa 094PMC 747610332893860 · doi ↗ · pubmed ↗
- 5Danecek, P. et al. Twelve years of SA Mtools and BC Ftools. Giga Science 1010.1093/gigascience/giab 008 (2021).10.1093/gigascience/giab 008PMC 793181933590861 · doi ↗ · pubmed ↗
- 6Çelik, M. H. & Mortazavi, A. Analysis of alternative polyadenylation from long-read or short-read RNA-seq with LAPA. bio Rxiv 10.1101/2022.11.08.515683 (2022).
- 7Li, H. Aligning sequence reads, clone sequences and assembly contigs with BWA-MEM. ar Xiv: Genomics (2013).