Evaluation of LncRNAs CBR3-AS1 and PCA3 expression in Gastric cancer and their correlation to clinicopathological variables
Parisa Najari, Sama Akbarzadeh, Ali Rajabi, Samaneh Tayefeh-Gholami, Elaheh Malek Abbaslou, Tooraj Ghasemzadeh, Mohammadali Hosseinpourfeizi, Reza Safaralizadeh

TL;DR
This study examines the expression of two long non-coding RNAs, CBR3-AS1 and PCA3, in gastric cancer and finds they are elevated in tumor tissues, suggesting potential roles as biomarkers.
Contribution
The study identifies elevated CBR3-AS1 and PCA3 expression in gastric cancer tissues compared to healthy tissues, proposing their potential as diagnostic biomarkers.
Findings
PCA3 and CBR3-AS1 lncRNAs are significantly overexpressed in gastric cancer tumor tissues compared to adjacent healthy tissues.
The AUC values of 0.68 and 0.79 for PCA3 and CBR3-AS1 suggest moderate diagnostic potential for gastric cancer.
No significant correlation was found between lncRNA expression and clinicopathological variables.
Abstract
Background: Gastric cancer (GC) is a multifactorial disease with a high death rate due to the unknown mechanisms involved in the developing, progressing, and late diagnosing GC. Several cancers have been linked to Long non-coding RNAs (lncRNAs), including GC, through differential expression. They play a crucial role in tumorigenesis pathways as modulatory factors, making them intriguing clinical and diagnostic biomarkers for many malignancies. This study’s objective is to compare the lncRNAs CBR3-AS1 and PCA3 expression levels in tumoral tissues to marginal tissues and the clinicopathological features of patients. Methods and Results: 100 GC patients’ tumoral and marginal tissue samples from Tabriz’s Valiasr Hospital were gathered for this case-control research. To determine the expression level of PCA3 and CBR3-AS1 lncRNAs in GC, total RNA was extracted, and the qRT-PCR technique was…
Genes, proteins, chemicals, diseases, species, mutations and cell lines named across the full text — each resolved to its canonical identifier and authoritative record.
Click any figure to enlarge with its caption.
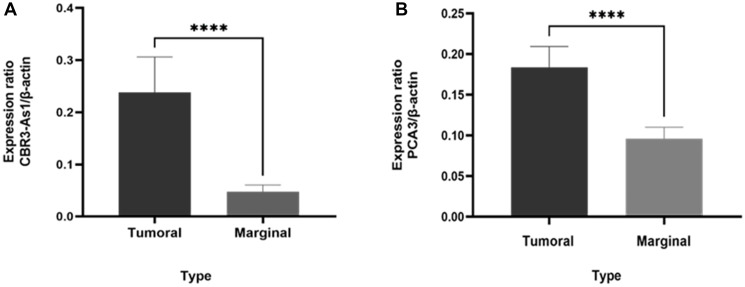 Figure 1
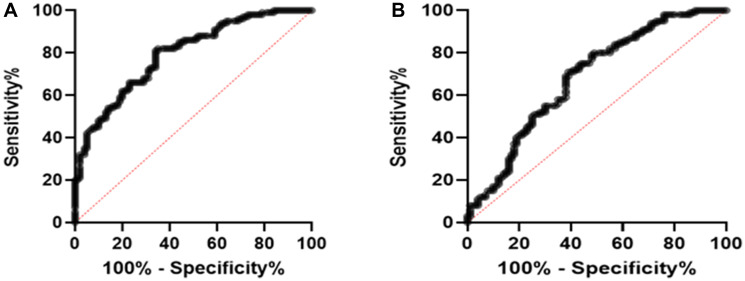 Figure 2
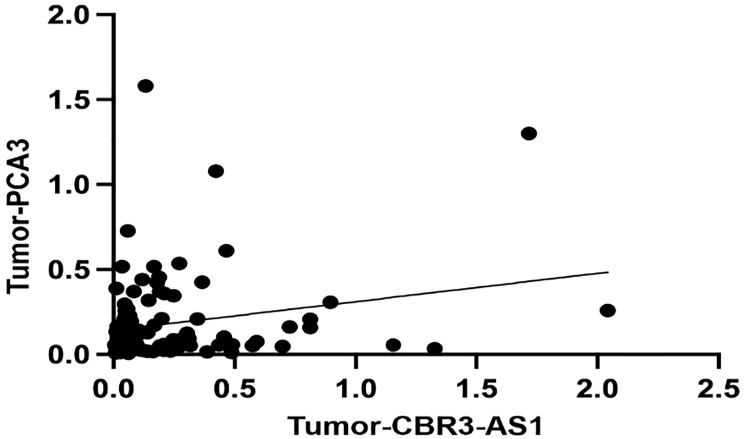 Figure 3
| Clinical parameters |
| Expression Mean LncRNA CBR3-AS1 Tumoral (±SD) | Expression Mean LncRNA CBR3-AS1 Marginal (±SD) | Expression Mean LncRNA PCA3 Tumoral (±SD) | Expression Mean LncRNA PCA3 Marginal (±SD) | ||
|---|---|---|---|---|---|---|---|
| Age | 0.469 | 0.611 | |||||
| ≤50 | 43 | 0.256 | 0.516 | 0.168 | 0.108 | ||
| >50 | 57 | 0.223 | 0.044 | 0.195 | 0.086 | ||
| Gender | 0.471 | 0.87 | |||||
| Male | 57 | 0.24 | 0.050 | 0.181 | 0.107 | ||
| Female | 43 | 0.235 | 0.043 | 0.186 | 0.080 | ||
| Different tumor size | 0.261 | 0.764 | |||||
| ≤5 cm | 30 | 0.155 | 0.057 | 0.195 | 0.091 | ||
| >5 cm | 70 | 0.273 | 0.043 | 0.178 | 0.097 | ||
| Lymph involvement | 0.88 | 0.558 | |||||
| Negative | 27 | 0.261 | 0.043 | 0.199 | 0.094 | ||
| Positive | 73 | 0.172 | 0.059 | 0.139 | 0.099 | ||
| TNM (Tumor stage) | 0.87 | 0.69 | |||||
| Stage I and II | 67 | 0.2044 | 0.0458 | 0.8308 | 0.083 | ||
| Stage III and IV | 33 | 0.03054 | 0.0514 | 0.1220 | 0.122 | ||
| Helicobacter pylori infection | 0.96 | 0.108 | |||||
| Positive | 67 | 0.230 | 0.468 | 0.20 | 0.09 | ||
| Negative | 33 | 0.251 | 0.493 | 0.148 | 0.106 | ||
| Lauren type | 0.493 | 0.383 | |||||
| Intestinal | 76 | 0256 | 0.046 | 0.170 | 0.101 | ||
| Diffuse | 24 | 0.223 | 0.052 | 0.225 | 0.077 |
| Gene | Primer type | Sequences of primers |
|---|---|---|
| LncRNA CBR3-AS1 | Forward | 5′-GAGCGGGAGTCTTCCTTAGC-3′ |
| Reverse | 5′-AGTTTTCCTTATGGGGTGTCCA-3′ | |
| LncRNA PCA3 | Forward | 5′-AGGGGAGATTTGTGTGGCTG-3′ |
| Reverse | 5′-ATGTCCTTCCCTCACAAGCG-3′ | |
| β-actin | Forward | 5′-AGAGCTACGAGCTGCCTGAC-3′ |
| Reverse | 5′-AGCACTGTGTTGGCGTACAG-3′ |
Peer Reviews
No public reviews on file for this paper yet. If you reviewed it on a platform where reviews are public (OpenReview, ICLR, NeurIPS, ICML), you can paste yours below so the community can read it here.
Videos
No videos yet. Explain this paper in a talk, walkthrough, or lecture? Add one.
Taxonomy
TopicsCancer-related molecular mechanisms research
INTRODUCTION
Gastric cancer (GC), a multifactorial disease, is affected by environmental and genetic factors and is frequently identified at advanced stages due to poor prognosis [1]. The fifth most typical malignant tumor worldwide was GC. 1.1 million additional cases and 800,000 fatalities are projected by GLOBOCAN 2020 [2]. Regular endoscopic screening, lowering H. pylori infection rates, targeted therapies, and immune therapies can affect the patient’s survival rate with GC; however, surgery is still the primary approach to treatment [3–5]. Numerous individuals deal with GC metastases because of the poor prognosis of the disease, making it crucial to identify biomarkers that contribute exclusively to the GC prognosis and target therapies [6]. Long non-coding RNAs (lncRNAs) are defined as non-coding RNAs comprising 200 nucleotides or longer [7]. These transcripts do not produce proteins and can regulate biological processes such as translation, posttranslational modifications, transcription, epigenetic alterations, cell division, proliferation, and stem cell pluripotency [8]. LncRNAs express abnormally in various tumors, some cancer-specific, and are found in plasma, urine, and body fluids, indicating disease severity [9]. Because lncRNAs may regulate GC cell proliferation, cycle, apoptosis, invasion, and metastasis, they may be useful as diagnostic and cancer treatment targets. This is due to their genome-wide expression patterns [10–14].
PCA3 (prostate cancer antigen 3), or DD3, is a lncRNA controlled by steroid receptors that is transcription of 9q21.22. In 95% of prostate cancer cases, it is overexpressed, and both benign and malignant prostate cancer patients have it detected in their urine [15]. Through the process of adenosine deaminase, this gene controls the amounts of prune2 in the body. Prune2 is downregulated by PCA3 overexpression, whereas prune2 is upregulated by PCA3 silence. In contrast, silencing of prune2 caused a rise in cell proliferation in prostate cancer cells [16]. Other studies also show that this lncRNA regulates p53 signaling and modulates the production of miR-1261, miR-132-3p, PRKD3, SREBP1, and LAP2α, all of which have critical implications on the development of prostate cancer [17].
lncRNA CBR3 antisense RNA 1 (CBR3-AS1) is situated in carbonyl reductase 3’s antisense region (CBR3), which is found in chromosome 21 (21q22.12) [18]. Research has indicated that CBR3-AS1 stimulates the growth, migration, and invasion of cancer cells. As a potential oncogene in several malignant tumors such as gestational choriocarcinoma, lung, breast, cervical, and colorectal cancer, CBR3-AS1 plays an important role [19–23]. As a result, CBR3-AS1 has been proposed as a possible biomarker for cancer diagnosis and prognosis [19].
Considering the role of lncRNAs in cancer, this study aims to evaluate PCA3 and CBR3-AS1 expression levels and diagnostic biomarker values in patients with GC from Iran.
RESULTS
CBR3-AS1 and PCA3 expression levels in GC samples
The levels of CBR3-AS1 and PCA3 were evaluated in both cancerous tissues and the adjacent marginal tissues of 100 patients diagnosed with GC (Figure 1). Through statistical analyses, when comparing the expression levels in the tumor tissues to the adjacent marginal tissues, it was found that there was a noticeable overexpression (p-value < 0.0001).
Comparison of CBR3-AS1 and PCA3 expression levels in patients with GC and marginal tissue.(A) CBR3-AS1 (P-value < 0.0001), (B) PCA3 (P-value < 0.0001).
Association between lncRNA expression and clinical variables
In this study, the characteristics of GC patients were examined, specifically the correlation between the expression pattern of CBR3-AS1 and PCA3 and various clinicopathological features, such as age, tumor size, sex, TNM staging, H. pylori infection, lymph node metastasis, and histology. The findings indicate that no significant correlation was discovered between the expression levels of these lncRNAs and their respective traits of the clinicopathology. Table 1 provides a comprehensive overview of the relative expression ratios of the previously identified lncRNAs and subgroups.
The ROC analysis
A ROC curve was constructed to assess the potential prognostic significance of CBR3-AS1 and PCA3 in individuals diagnosed with GC. The area under the curve (AUC) for CBR3-AS1 was calculated to be 0.79 (with a sensitivity of 81%, specificity of 66%, and 95% CI = 0.7359 to 0.8561), while the AUC for PCA3 was determined to be 0.68 (with a sensitivity of 69%, specificity at 62%, and 95% CI = 0.6086 to 0.7562). These findings suggest that CBR3-AS1 and PCA3 expressions are promising diagnostic biomarkers in GC patients (Figure 2).
Roc covers the analysis of (A) CBR3-AS1 (AUC = 0.79 (sensitivity = 81%, specificity = 66%, and 95% CI = 0.7359 to 0.8561)) and (B) PCA3 (AUC = 0.68 (sensitivity = 69%, specificity = 62%, and 95% CI = 0.6086 to 0.7562)) to evaluate their biomarker potential in GC patients.
Correlation
There is no significant correlation between the expression of the CBR3-AS1 and PCA3 in GC patients (r = 0.1777, P-value = 0.0769), according to Spearman’s correlation analysis (Figure 3).
Correlations between the expression levels of CBR3-AS1 and PCA3 in GC patients (r = 0.1777, P-value = 0.0769).
DISCUSSION
GC is a multifactorial disease that poses a challenge to the oncology domain due to its high mortality rate and late diagnosis caused by a lack of effective biomarkers [24, 25]. Researchers show that the complex tumorigenesis may be connected to how lncRNAs interact with multiple biomolecules [26]. The current investigation demonstrates that PCA3 and CBR3-AS1 may play a carcinogenic role in individuals with GC since tumor tissue showed higher levels of PCA3 and CBR3-AS1 expression than marginal tissues. These findings suggest that both lncRNAs serve as moderate biomarkers for GC.
However, no significant correlation was found between the expression levels of CBR3-AS1 and PCA3 and clinicopathological parameters. This lack of correlation can be associated with several factors, including biological heterogeneity and small subgroup sizes within specific clinicopathological categories (Lymph involvement, TNM stages, and Lauren type). This may lead to variable gene expression patterns and prevent potential associations with clinical characteristics.
According to CAI Yi-Pin et al.’s research, cervical cancer tissue has a higher expression level of CBR3-AS1. They also suggest that the lncRNA CBR3-AS1/miR-3163/LASP1 pathway is critical in controlling the proliferation of cells and their stem cell-like characteristics [22]. According to another study that used qRT-PCR and western blot techniques, CBR3-AS1 modifies the miR-140-5p/DDX54-NUCKS1-mTOR signaling pathway network, hence potentially contributing to an oncogenic function in osteosarcoma [27]. Xu L. and her colleagues detected that in tissues and cell lines from breast cancer, CBR3-AS1 was upregulated and associated with a better prognosis [28]. Overexpression of CBR3-AS1 in NSCLC tissues lowers proliferation, invasion, and migration while it increases apoptosis. In vivo tests revealed that CBR3-AS1 accelerated tumor development and may control the activity of the miR-409-3p target gene SOD1. It has been noted that the CBR3-AS1/miR-409-3p/SOD1 pathway enables CBR3-AS1 to play an oncogenic role [29]. Also, based on findings by Y Guan et al., upregulation of CBR3 AS1 has been linked to larger tumors, advanced TNM stages, lymph node metastases, and shorter survival periods. CBR3-AS1 knockdown increased apoptosis and tumorigenicity while suppressing proliferation, migration, and invasiveness. It has been suggested that the CBR3-AS1/miR-509-3p/HDAC9 pathway is a valuable target for the therapy of NSCLC since it promotes tumor growth through the development and progression of NSCLC [30].
PCA3 is a particular lncRNA for the detection of prostate cancer in a urine test approved by the FDA. By altering the expression of miR-132-3p, miR-1261, SREBP1, PRKD3, and LAP2, as well as controlling p53 signaling, this lncRNA has significant implications on prostate carcinogenesis [17, 31]. Liu Y et al. Studies discovered that the expression of the lncRNA PCA3 was higher in epithelial ovarian cancer tissues than in healthy ovarian tissue. The siRNA-mediated knockdown of PCA3 dramatically reduced cell proliferation, migration, and invasion. MiR-106b-5p may bind to the 3′UTR of PCA3 and decrease the protein production of genes controlled by miR-106b; therefore, PCA3 might be a useful diagnostic biomarker for treating epithelial ovarian cancer [32].
MATERIALS AND METHODS
Sampling of human gastric tissue
Endoscopy samples from 100 patients with stomach cancer were taken from their tumors and marginals at the Valiasr Hospital in Tabriz, Iran (total n = 200). Before surgery, no patient had undergone anti-tumor treatment as soon as the samples were resected. To extract the RNA, they were kept at −80°C and quickly frozen in liquid nitrogen. This investigation received clearance from the University of Tabriz’s Medical Ethics Committee and was conducted following the norms of Good Clinical Practice guidelines and the Declaration of Helsinki (approval number: IR. TABRIZU. REC. 1398.015). The histologic features of the samples were evaluated and categorized by a skilled pathologist. Every patient of GC signed an informed consent form.
RNA extraction
Total RNA was extracted from the GC and adjacent marginal tissue samples using Trizol, as directed by the manufacturer. (Invitrogen, MA, USA). Thermo Fisher Scientific’s nanodrop spectrophotometer and 2% agarose gel electrophoresis were used to qualitatively and quantitatively evaluate the extracted RNAs. After that, every RNA sample was kept at −80 C until cDNA synthesis and DNaseI treatment were performed on them.
cDNA synthesis and quantitative RT-PCR
A cDNA synthesis kit (Yektatajhiz, Iran) was used to synthesize complementary DNA (cDNA) from extracted RNA in accordance with the manufacturer’s instructions. Later, until the polymerase chain reaction (PCR), the synthesized cDNAs were kept at –20°C. The Gene Runner and Primer BLAST programs were used to design the oligonucleotide primers. To avoid producing non-specific PCR products, the primers were verified using the BLAST tool available on the NCBI website. The housekeeping gene β-actin was chosen as the baseline for normalizing gene expression. Table 2 displays the particular primers and product lengths for CBR3-AS1, PCA3, and β-actin.
The expression levels of CBR3-AS1 and PCA3 were measured by quantitative real-time reverse transcription-PCR (qRT-PCR), following the manufacturer’s instructions and utilizing Thermo Fisher Scientific’s Maxima SYBR-Green qRT-PCR master mix. The reaction mixtures, including 1 μL of cDNA (100 ng/μL), 5.4 μL of ddH2O, 0.6 μL of particular primers for β-actin (10 μM) and CBR3-AS1, and 14 μL of 7 μL of SYBR Green Master Mix (2×), were incubated at 95°C for 10 min. Subsequently, there were 40 amplification cycles carried out, with each cycle lasting 30 seconds at 95°C, 60°C, 72°C, and 72°C for 5 minutes. For PCA3 and β-actin, the identical procedure was carried out again. Gene expression was measured using the 2−ΔCT computation, where CT was the threshold cycle.
Statistical evaluation
The expression of lncRNAs was determined through qRT-PCR results utilizing the 2^−ΔCt^ method. The data were statistically analyzed using the Mann-Whitney U-test using GraphPad Prism 9. The Mann-Witney U-test and one-way ANOVA were used to investigate the association between the lncRNAs and clinicopathological features using SPSS (version 26). In addition, to analyze the correlation between two lncRNAs in tumoral tissues, the Spearman rho assay was performed using GraphPad Prism 9. The receiver operating characteristic (ROC) curve test was used to examine the biomarker potential of lncRNAs in GC patients using the GraphPad Prism 9 software. In every experiment, the p-value of less than 0.05 is deemed significant.
Data availability statements
Data are available upon request.
CONCLUSIONS
To sum up, this study focuses on the expression of CBR3-AS1 and PCA3 in GC tumoral and marginal healthy tissues. The expression levels of these genes were found to be remarkably higher in GC tumor samples compared to noncancerous marginal tissues. However, no significant correlation was found between the expression levels of both lncRNAs and the clinicopathological characteristics. Despite the promising diagnostic potential of CBR3-AS1 and PCA3 in GC, the current study has some limitations, including its single-center cohort, lack of functional validation assays (such as gene knockdown/overexpression, RNA-sequencing, and pathway analysis). Additionally, despite moderate AUC values, validation in independent patient cohorts is necessary to establish their reliability as biomarkers. Future studies should include multi-center validation, functional assays, and larger sample sizes to support our findings further and explore the underlying molecular mechanisms.
The reference list from the paper itself. Each links out to its DOI / PubMed record.
- 1Ajani JA, D’Amico TA, Bentrem DJ, Chao J, Cooke D, Corvera C, Das P, Enzinger PC, Enzler T, Fanta P, Farjah F, Gerdes H, Gibson MK, et al. Gastric Cancer, Version 2.2022, NCCN Clinical Practice Guidelines in Oncology. J Natl Compr Canc Netw. 2022; 20:167–92. 10.6004/jnccn.2022.0008. 35130500 · doi ↗ · pubmed ↗
- 2Ilic M, Ilic I. Epidemiology of stomach cancer. World J Gastroenterol. 2022; 28:1187–203. 10.3748/wjg.v 28.i 12.1187. 35431510 PMC 8968487 · doi ↗ · pubmed ↗
- 3Machlowska J, Baj J, Sitarz M, Maciejewski R, Sitarz R. Gastric Cancer: Epidemiology, Risk Factors, Classification, Genomic Characteristics and Treatment Strategies. Int J Mol Sci. 2020; 21:4012. 10.3390/ijms 21114012. 32512697 PMC 7312039 · doi ↗ · pubmed ↗
- 4Noh CK, Lee E, Lee GH, Lim SG, Park B, Shin SJ, Cheong JY, Lee KM. Association of Regular Endoscopic Screening with Interval Gastric Cancer Incidence in the National Cancer Screening Program. J Clin Med. 2021; 11:230. 10.3390/jcm 11010230. 35011973 PMC 8745904 · doi ↗ · pubmed ↗
- 5Johnston FM, Beckman M. Updates on Management of Gastric Cancer. Curr Oncol Rep. 2019; 21:67. 10.1007/s 11912-019-0820-4. 31236716 · doi ↗ · pubmed ↗
- 6Dastmalchi N, Tayefeh-Gholami S, Rajabi A, Safaralizadeh R. PVT 1 and ZFAS 1 lnc RN As expressions and their biomarker value in gastric cancer tissue sampling among Iranian population. Mol Biol Rep. 2021; 48:7171–77. 10.1007/s 11033-021-06709-y. 34546507 · doi ↗ · pubmed ↗
- 7Akbarzadeh S, Tayefeh-Gholami S, Najari P, Rajabi A, Ghasemzadeh T, Hosseinpour Feizi M, Safaralizadeh R. The expression profile of HAR 1A and HAR 1B in the peripheral blood cells of multiple sclerosis patients. Mol Biol Rep. 2023; 50:2391–98. 10.1007/s 11033-022-08182-7. 36583781 · doi ↗ · pubmed ↗
- 8Bridges MC, Daulagala AC, Kourtidis A. LN Ccation: lnc RNA localization and function. J Cell Biol. 2021; 220:e 202009045. 10.1083/jcb.202009045. 33464299 PMC 7816648 · doi ↗ · pubmed ↗