Effect of Oral Insulin on Early Combined Glucose and C-Peptide Endpoints in Individuals at High-Risk for Type 1 Diabetes
Taylor M. Triolo, Laura M. Jacobsen, David Cuthbertson, Emily K. Sims, Heba M. Ismail, Maria J. Redondo, Markus Lundgren, Linda A. DiMeglio, Peter A. Gottlieb, Mark A. Atkinson, Jeffrey P. Krischer, Desmond A. Schatz, Jay M. Sosenko

TL;DR
Oral insulin may delay type 1 diabetes in high-risk individuals by improving glucose and C-peptide levels within a year.
Contribution
A novel combination of glucose and C-peptide markers shows early therapeutic benefit of oral insulin in high-risk individuals.
Findings
Glucose levels rose and C-peptide declined in the placebo group, but not in the oral insulin group.
Combined glucose and C-peptide metrics showed significant differences between groups after one year.
Centroid ratio analysis revealed a favorable effect of oral insulin on metabolic markers.
Abstract
Background: The TrialNet Oral Insulin (OI) prevention trial showed no overall treatment effect, using the diagnosis of type 1 diabetes as an endpoint. A significant delay in onset was only found in a high-risk stratum (termed secondary stratum 1) of participants with low first-phase insulin release (FPIR). Methods: Since trials with an endpoint of type 1 diabetes take years to complete, in this post hoc analysis, we assessed whether a novel combination of glucose and C-peptide markers could identify a therapeutic benefit after 1 year of follow-up (trial participants followed for a median 2.7 years). Results: Participants were relatives with multiple islet autoantibodies and low FPIR (n = 40). Glucose rose, and C-peptide declined in the placebo group, whereas glucose rose minimally, and C-peptide increased in the OI group. When glucose and C-peptide were plotted on two-dimensional…
Genes, proteins, chemicals, diseases, species, mutations and cell lines named across the full text — each resolved to its canonical identifier and authoritative record.
Click any figure to enlarge with its caption.
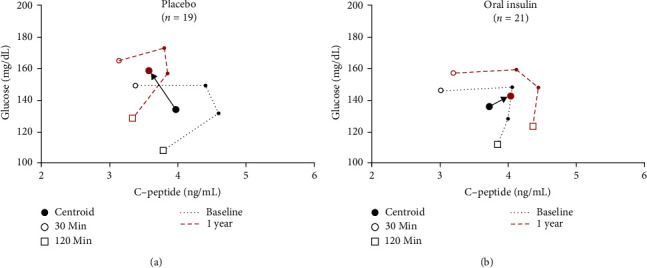 Figure 1
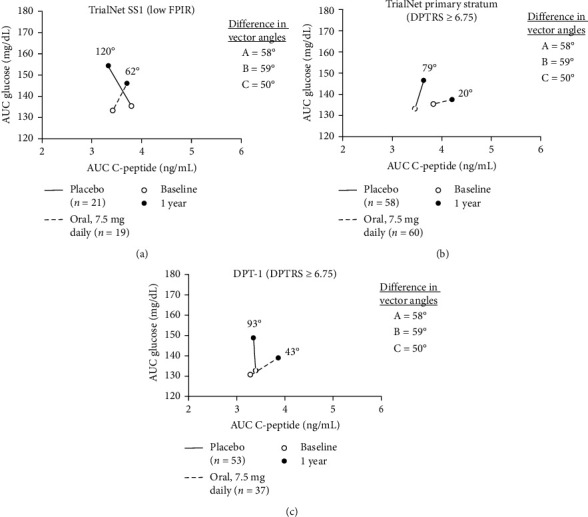 Figure 2
- —NIDDK K23
- —National Institutes of Health
- —National Institute of Diabetes and Digestive and Kidney Diseases
- —National Institute of Allergy and Infectious Diseases
- —Eunice Kennedy Shriver National Institute of Child Health and Human Development
- —JDRF
Peer Reviews
No public reviews on file for this paper yet. If you reviewed it on a platform where reviews are public (OpenReview, ICLR, NeurIPS, ICML), you can paste yours below so the community can read it here.
Videos
No videos yet. Explain this paper in a talk, walkthrough, or lecture? Add one.
Taxonomy
TopicsDiabetes and associated disorders · Pancreatic function and diabetes · Diabetes Management and Research
1. Introduction
Even among high-risk multiple autoantibody-positive individuals, type 1 diabetes prevention trials can take years to complete due to the time for type 1 diabetes onset to occur. TrialNet conducted a large, multicenter, randomized, placebo-controlled trial to assess whether oral insulin (OI) could prevent or delay diabetes onset. This study was designed to encompass multiple strata. The primary stratum (PS) included relatives with multiple autoantibodies and normal first-phase insulin response (FPIR) on intravenous glucose tolerance testing (IVGTT). Within the PS, individuals who received OI had a similar rate of type 1 diabetes compared to those who received placebo (i.e., no overall therapeutic benefit) [1]. In addition, there was a planned exploratory subgroup, named secondary stratum 1 (SS1), which included participants with a similar autoantibody profile but low FPIR. In SS1, participants in the OI group had a lower rate of diabetes than those in the placebo group [1].
Combination markers, such as Index60 [2–4] or area under the curve (AUC) C-peptide/AUC glucose (AUC ratio), can provide more specificity regarding beta-cell function and prediction of type 1 diabetes progression than either glucose or C-peptide alone. Also, in post hoc analyses of the high-risk participants in the Diabetes Prevention Trial-Type 1 (DPT-1) OI trial and TrialNet OI trial PS with AUC ratio after 1 year of follow-up as the endpoint, the OI groups in both trials appeared to have delayed metabolic progression [5]. Since combination markers appear to better characterize the progression to type 1 diabetes [6], we sought to assess those and other measures as indicators of a therapeutic benefit earlier, after 1 year, in the TrialNet OI SS1 prevention trial [7].
2. Research Design and Methods
The multicenter Type 1 Diabetes TrialNet OI study (NCT00419562) included multiple autoantibody-positive relatives of individuals with type 1 diabetes who were treated with 7.5 mg/day of OI or placebo for a median follow-up of 2.7 years and monitored for diabetes development. At-risk relatives had either (1) insulin autoantibodies (mIAA) and islet cell autoantibodies or (2) mIAA with insulinoma-associated 2 autoantibodies (IA2A) and glutamic acid decarboxylase autoantibodies. Participants in SS1 (n = 55) had normal glucose tolerance on oral glucose tolerance testing (OGTT) but low FPIR on IVGTT, where the sum of the 1- and 3-min insulin values was <60 μU/mL for parents of probands and relatives <8 years old or <100 μU/mL if relatives (other than parents) were ≥8 years old as previously described [1].
OGTTs were performed every 6 months until the development of type 1 diabetes, based on the American Diabetes Association criteria, or conclusion of the trial. Glucose and C-peptide measurements were obtained at 0, 30, 60, 90, and 120 min after ingestion of a 1.75 g/kg carbohydrate drink (maximum 75 g). Participants were typed for HLA class II DRB1, DQA1, and DQB1 alleles using DNA-based typing with oligonucleotide probes, as previously described [8, 9]. Subjects were stratified by the presence of the high-risk HLA genotype DR3 DQA1 ^∗^05:01 DQB1 ^∗^02:01/DR4 DQA1 ^∗^03:01 DQB1 ^∗^03:02 (abbreviated here DR3/4 ^∗^0302).
Glucose and C-peptide response curves (GCRCs) from two-dimensional plots of OGTT C-peptide and glucose mean values at 30, 60, 90, and 120-min were used [10] to visually depict treatment differences between OI and placebo. Combination glucose and C-peptide endpoints studied included (1) AUC ratio, (2) Index60, and (3) the newly developed centroid ratio. The AUC ratio includes all time points from the 120-min OGTT and a decrease in the measure denotes worsening beta-cell function. Index60, developed from DPT-1 data using a proportional hazards regression model, is less than zero in a metabolically healthy state (0.3695 × [log fasting C-peptide] + 0.0165 × [60-min glucose] − 0.3644 × [60-min C-peptide]) [2]. A centroid is the central point of the GCRC shape, the latter constituted by 30–120-min OGTT time points and was calculated as reported in Sims et al. [11]. The C-peptide and glucose coordinates that define the centroid location are used to form the centroid ratio (C-peptide coordinate/glucose coordinate); the centroid ratio can be compared between groups and over time. A decrease in the measure is indicative of a worsening metabolic state. Other noncombination measures were also assessed: AUC C-peptide, AUC glucose, 30–0 min C-peptide, and peak C-peptide (highest value from the 120-min OGTT).
To provide comparisons with previous studies, the mean AUC glucose and mean AUC C-peptide values at baseline and 1 year were plotted. A vector connecting these points allowed for a scaled angle that is determined from the right horizontal line/x-axis (0°). This same plot was utilized in the prior report [5] that compared placebo and OI groups in both the TrialNet PS and DPT-1 OI trial cohorts that had an elevated metabolic risk (DPT-1 risk score [DPTRS] ≥ 6.75), and the differences in vector angles were determined.
The change in each metabolic measure from baseline to 1 year was compared between the placebo and OI arms. Participants were excluded if they did not have baseline or 12-month data or if they developed type 1 diabetes prior to or at 12 months (n = 15). Of these, seven were removed due to missing data at baseline or 12 months (three placebo; four treated) and eight due to development of diabetes at or before 12 months (five placebo; three treated). Adjustments using ANOVA were conducted by including baseline age, BMI Z-score, C-peptide, and glucose in the regression model. ANOVA was used to compare the continuous measures (age, BMI Z-score, and metabolic measures), while the chi-square statistic was used for comparing categorical variables (sex and race/ethnicity). p-Values less than 0.05 were considered significant. All statistical analyses were performed using SAS version 9.4 (Cary, NC).
3. Results
Of the 40 subjects included in this analysis of TrialNet OI SS1, 19 were in the placebo arm and 21 in the OI arm. Seventy-three percent of participants (29/40) went on to develop type 1 diabetes after the initial 12 months (79% in the placebo group and 67% in the OI group). Participants were followed for 3.5 ± 1.9 years (mean ± SD). Baseline characteristics are shown in Table 1. There were no significant differences in age, sex, and race/ethnicity between those who received placebo and those treated with OI. BMI Z-scores were 0.10 ± 0.65 in the placebo treated subjects and –0.45 ± 0.92 in the OI treated subjects (p=0.048). There was no difference in the presence of the high-risk HLA haplotypes. At baseline, the combination and noncombination metabolic markers were not significantly different between placebo and OI.
We analyzed mean glucose and C-peptide values at 30, 60, 90, and 120-min time points from OGTTs performed at baseline and 1 year of follow-up, using GCRCs on two-dimensional grids. The 1-year time from baseline was chosen since an OI effect was evident at that time point in the prior study of OI [1]. Figure 1A shows the change from baseline to 1 year in those who received placebo. Over the year, the mean glucose increased, and the mean C-peptide decreased at all time points. In contrast, among those treated with OI (Figure 1B), the mean glucose increased marginally, while the mean C-peptide increased at all time points. This treatment effect is visually demonstrated by the difference between the placebo and OI groups in the directionality of the vectors from the centroid at baseline to the centroid at 1 year.
We examined the change in mean values for combination and noncombination glucose and C-peptide markers from baseline to 1 year of follow-up (Table 2). Unlike changes in AUC ratio and Index60, the centroid ratio demonstrated significant difference from baseline to 1 year. Those given placebo had a change in centroid ratio of –0.005 ± 0.01 compared to those treated with OI 0.001 ± 0.01 (p=0.018 unadjusted, p=0.037 adjusted). Measures in which C-peptide and glucose were not combined (AUC C-peptide, AUC glucose, 30–0 min C-peptide, or peak C-peptide) did not differ significantly between treatment arms over 1 year. Hazard ratios (and 95% confidence intervals) were calculated using univariable Cox models for the change in each metabolic measure from baseline to 12 months and the eventual risk of diabetes development (n = 29 with complete data). Only Index60 (HR 2.049 [1.254, 3.350], p=0.004) and AUC glucose (HR 1.013 [1.003, 1.024], p=0.014) were associated with progression to type 1 diabetes.
The difference between the placebo and OI treatment group vectors in SS1was compared with the vector differences previously observed in the analyses of TrialNet PS and DPT-1 (5). Since mean AUC glucose and mean AUC C-peptide were the bidirectional axes used for plotting vectors in that study, we utilized the same axes to plot the vectors in SS1 (Figure 2). The angle of the difference between the placebo and OI vectors from baseline to 1 year in SS1 (58°) was similar to the angle of the difference between the placebo and OI vectors from baseline to 1 year in analyses of those at high risk in the PS (59°) and DPT-1 (50°) trials.
4. Discussion
A difference at 1 year between placebo and OI groups in the TrialNet OI SS1 was detected quantitatively by the change in the centroid ratio, a newly developed combination glucose and C-peptide measure. In that year, the vectors on the two-dimensional grid showed the GCRC of the placebo group moved in a pathological direction, upward and leftward (i.e., increasing glucose and decreasing C-peptide). In contrast, the GCRC of the OI group moved only slightly upward and rightward. These findings illustrate the importance, both quantitatively and qualitatively, of assessing glucose and C-peptide in the context of each other.
Previously, prevention studies have focused on the clinical outcome of the development of type 1 diabetes in high-risk relatives [12]. The centroid ratio, a combination C-peptide and glucose marker, differed between treatment arms earlier than the clinical outcome of type 1 diabetes—at 1 year versus the average time to diabetes in SS1 which was 2.65 years. Thus, the centroid ratio has potential utility, in research, as an early signal of efficacy in prevention trials which could save time and money.
OI trials have not met primary endpoints to delay or prevent type 1 diabetes in those at risk [1, 13]. However, subgroups within these trials have shown some benefit [13–15]. Subjects with high IAA titers in DPT-1 and those with loss of FPIR in TrialNet (the cohort study herein) in post hoc analyses are suggested to have delayed progression to type 1 diabetes [1]. Our study is consistent with a prior analysis, which showed evidence (using AUC ratio) suggesting that individuals at high risk (i.e., DPTRS ≥6.75) benefitted from OI therapy [5]. Since SS1 was preplanned and showed delayed progression to diabetes in the OI group, the metabolic findings at 1 year can be viewed as corroborative. This suggests that measurements of early metabolic endpoints could be of value if specified in protocols for prevention trials.
The two-dimensional grid of mean AUC glucose and mean AUC C-peptide provided the basis for this unique, qualitative means of interpreting prevention trial outcomes. Visual evidence for the similarities in the findings from analyses of TrialNet SS1 and the two other OI trials [5] is apparent. The difference in vector angles for change between the OI and placebo groups was similar for the three studies (DPT-1, 50°; TrialNet PS, 59°; and SS1, 58°).
This study was limited by small participant numbers available for analysis. Multiple test corrections were not performed due to the exploratory nature of this work, and confirmatory studies are needed. As indicated above, the metabolic endpoint findings are consistent with the high risk (DPTRS ≥6.75) DPT-1 and TrialNet PS participants. Similarly, combined glucose and C-peptide endpoints provided evidence of a teplizumab effect at 3 months [11]. Thus, the analyses of combination metabolic endpoints in SS1 would appear to add to the growing evidence that combination metabolic endpoints are useful for showing early efficacy of preventive treatments in therapies that have thus far been unsuccessful. Future prospective studies could be stratified by these metabolic criteria to further evaluate the utility of these measures.
5. Conclusions
Overall, in the large trials, OI did not delay or prevent type 1 diabetes. However, post hoc analyses of those trials and of SS1 suggest that individuals at high-risk (e.g., low FPIR and elevated DPTRS) can derive the benefit of delayed metabolic progression from OI. Our findings support the further study of such combination glucose and C-peptide measures as short-term endpoints in prevention trials. Continued advancement of OI for clinical application should be considered, either alone or in combination with other immunomodulatory agents.
The reference list from the paper itself. Each links out to its DOI / PubMed record.
- 1Study G. Krischer J. P. Schatz D. A. Bundy B. Skyler J. S. Greenbaum C. J. Writing Committee for the Type 1 Diabetes Trial Net Oral Insulin, Effect of Oral Insulin on Prevention of Diabetes in Relatives of Patients With Type 1 Diabetes: A Randomized Clinical Trial JAMA 2017318191891190210.1001/jama.2017.170702-s 2.0-8503651554429164254 PMC 5798455 · doi ↗ · pubmed ↗
- 2Sosenko J. M. Skyler J. S. Di Meglio L. A. et al. A New Approach for Diagnosing Type 1 Diabetes in Autoantibody-Positive Individuals Based on Prediction and Natural History Diabetes Care 201538227127610.2337/dc 14-18132-s 2.0-8492189614825519451 PMC 4302258 · doi ↗ · pubmed ↗
- 3Nathan B. M. Boulware D. Geyer S. et al. Dysglycemia and Index 60 as Prediagnostic End Points for Type 1 Diabetes Prevention Trials Diabetes Care 201740111494149910.2337/dc 17-09162-s 2.0-8503322221328860125 PMC 5652585 · doi ↗ · pubmed ↗
- 4Redondo M. J. Nathan B. M. Jacobsen L. M. et al. Index 60 as an Additional Diagnostic Criterion for Type 1 Diabetes Diabetologia 202164483684410.1007/s 00125-020-05365-433496819 PMC 7940596 · doi ↗ · pubmed ↗
- 5Sosenko J. M. Skyler J. S. Herold K. C. et al. Slowed Metabolic Decline After 1 Year of Oral Insulin Treatment Among Individuals at High Risk for Type 1 Diabetes in the Diabetes Prevention Trial-Type 1 (DPT-1) and Trial Net Oral Insulin Prevention Trials Diabetes 20206981827183210.2337/db 20-016632439823 PMC 7372067 · doi ↗ · pubmed ↗
- 6Jacobsen L. M. Bocchino L. Evans-Molina C. et al. The Risk of Progression to Type 1 Diabetes Is Highly Variable in Individuals With Multiple Autoantibodies Following Screening Diabetologia 202063358859610.1007/s 00125-019-05047-w 31768570 PMC 7229995 · doi ↗ · pubmed ↗
- 7Jacobsen L. Cuthbertson D. Sims E. et al. 589-P: Effect of Oral Insulin (OI) on Combined Glucose and C-Peptide Endpoints in Individuals at High-Risk for Type 1 Diabetes (T 1D) Diabetes 202170 Supplement_1p. 589p 10.2337/db 21-589-P · doi ↗
- 8Rewers A. Babu S. Wang T. B. et al. Ethnic Differences in the Associations Between the HLA-DRB 1 ∗04 Subtypes and Type 1 Diabetes Annals of the New York Academy of Sciences 20031005130130910.1196/annals.1288.0472-s 2.0-194250716814679080 · doi ↗ · pubmed ↗