Modeling lifetime and count data using a unified flexible family: Its discrete counterpart, properties, and inference
Ahmed Z. Afify, Maha M. Helmi, Hassan M. Aljohani, Sara M. A. Alsheikh, Hisham A. Mahran

TL;DR
This paper introduces new statistical models for analyzing lifetime and count data, showing they outperform existing models in various real-world applications.
Contribution
The paper proposes two new flexible families of distributions with an extra shape parameter for modeling monotonic and non-monotonic hazard rates.
Findings
The MKM-G and DMKM-G families offer better flexibility in modeling real data from multiple fields.
Simulation results confirm the effectiveness of the proposed estimation methods.
Real data analysis shows the new models fit better than existing continuous and discrete distributions.
Abstract
In this article, two flexible classes called the modified Kavya–Manoharan-G (MKM-G) and discrete modified Kavya–Manoharan-G (DMKM-G) families are investigated. The two proposed families provide more flexibility for modeling real-lifetime and count data from environmental, medical, engineering, and educational fields. Due to the new extra shape parameter of the two proposed families, their special sub-models are capable of modeling monotonic and non-monotonic hazard rates. The basic properties of the MKM-G family are studied. Eight classical approaches of estimation are used for estimating the MKM-exponential (MKME) parameters. The performances of the estimators are explored using simulation results. Additionally, the DMKM-exponential (DMKME) distribution is defined. Finally, the importance and flexibility of the MKME and DMKME distributions are addressed by fitting seven real-lifetime…
Genes, proteins, chemicals, diseases, species, mutations and cell lines named across the full text — each resolved to its canonical identifier and authoritative record.
Click any figure to enlarge with its caption.
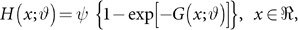 Figure 1
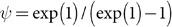 Figure 2
 Figure 3
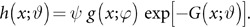 Figure 4
 Figure 5
 Figure 6
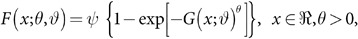 Figure 7
 Figure 8
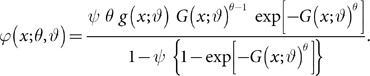 Figure 9
 Figure 10
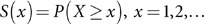 Figure 11
 Figure 12
 Figure 13
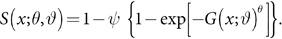 Figure 14
 Figure 15
 Figure 16
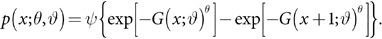 Figure 17
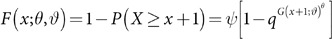 Figure 18
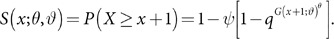 Figure 19
 Figure 20
 Figure 21
 Figure 22
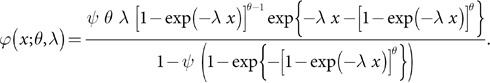 Figure 23
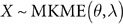 Figure 24
 Figure 25
 Figure 26
 Figure 27
 Figure 28
 Figure 29
 Figure 30
 Figure 31
 Figure 32
 Figure 33
 Figure 34
 Figure 35
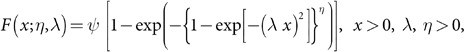 Figure 36
 Figure 37
 Figure 38
 Figure 39
 Figure 40
 Figure 41
 Figure 42
 Figure 43
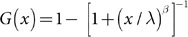 Figure 44
 Figure 45
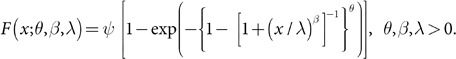 Figure 46
 Figure 47
 Figure 48
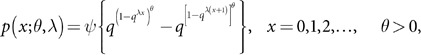 Figure 49
 Figure 50
Peer Reviews
No public reviews on file for this paper yet. If you reviewed it on a platform where reviews are public (OpenReview, ICLR, NeurIPS, ICML), you can paste yours below so the community can read it here.
Videos
No videos yet. Explain this paper in a talk, walkthrough, or lecture? Add one.
Taxonomy
TopicsStatistical Distribution Estimation and Applications · Probabilistic and Robust Engineering Design · Statistical Methods and Bayesian Inference