PET/MRI is superior to PET/CT in detecting oesophago and gastric carcinomas: a meta-analysis
Bo Peng, Hui Sun, Jian Hou, Jian-Xing Luo

TL;DR
PET/MRI is better than PET/CT for detecting oesophago and gastric cancers, with similar staging accuracy and less radiation.
Contribution
Demonstrates PET/MRI's superior detection accuracy for these cancers compared to PET/CT.
Findings
PET/MRI showed higher sensitivity in primary lesion detection (RR = 1.14, 95% CI 1.01–1.29).
PET/MRI and PET/CT had no significant differences in TNM staging accuracy.
PET/MRI reduces radiation exposure compared to PET/CT.
Abstract
To compare the accuracy rates of the detection and staging of oesophago and gastric carcinomas between PET/MRI and PET/CT. An extensive librarian-led literature search of PubMed, Embase, Web of Science, the Cochrane Central Library, and CNKI was performed and a meta-analysis was done. Six studies, including 123 participants, were analyzed. PET/MRI had a comparatively high sensitivity in primary lesion detection compared with PET/CT. (RR = 1.14, 95% CI 1.01–1.29, P = 0.036).PET/MRI had no significant statistical differences in all aspects of TNM staging compared with PET/CT. This systematic review confirmed the advantage of PET/MRI in detecting oesophago and gastric carcinomas.Compared with PET/CT, it can reduce unnecessary radiation exposure and can be used in relevant patients without contraindications of MRI.
Genes, proteins, chemicals, diseases, species, mutations and cell lines named across the full text — each resolved to its canonical identifier and authoritative record.
Click any figure to enlarge with its caption.
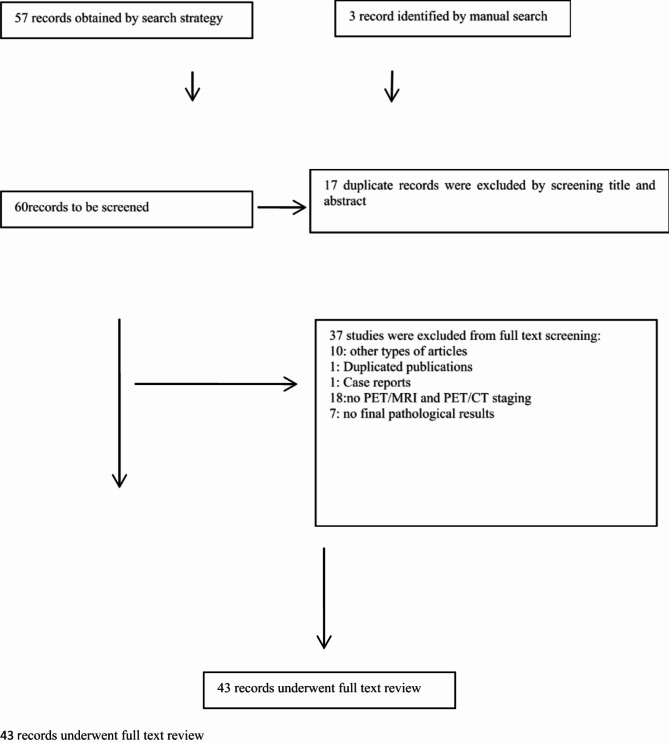 Figure 1
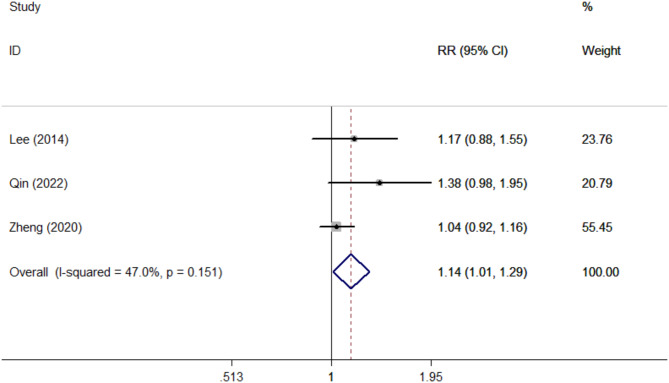 Figure 2
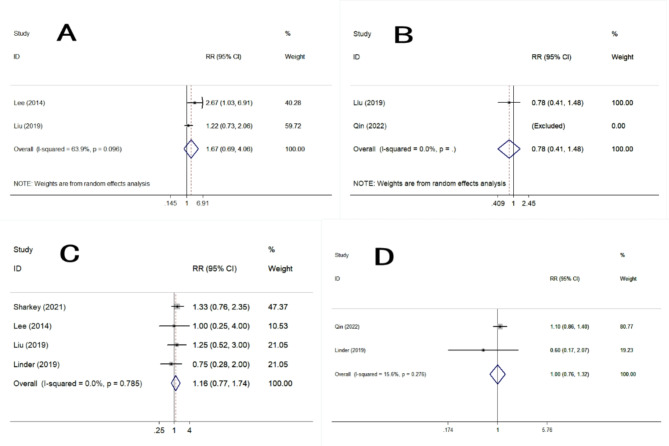 Figure 3
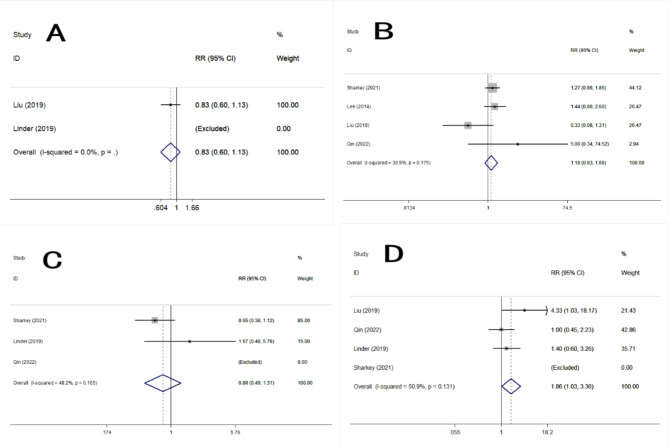 Figure 4
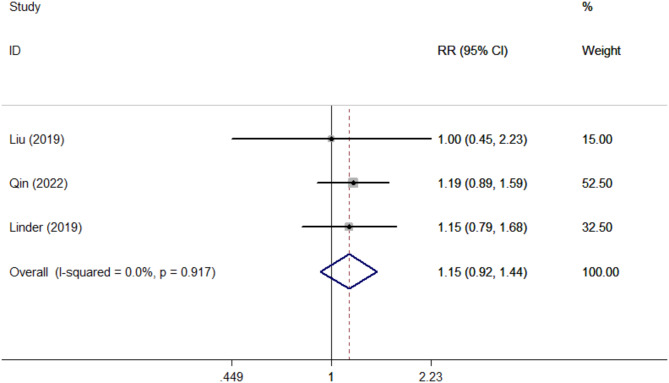 Figure 5
Peer Reviews
No public reviews on file for this paper yet. If you reviewed it on a platform where reviews are public (OpenReview, ICLR, NeurIPS, ICML), you can paste yours below so the community can read it here.
Videos
No videos yet. Explain this paper in a talk, walkthrough, or lecture? Add one.
Taxonomy
TopicsEsophageal Cancer Research and Treatment · Gastric Cancer Management and Outcomes · Radiomics and Machine Learning in Medical Imaging
Introduction
Oesophago and Gastric carcinomas are the common malignant tumor of the digestive system which has a high morbidity and mortality rate[1, 2]. Early surgery or endoscopic resection is the primary treatment for oesophago and gastric carcinomas, so early diagnosis and accurate staging has a significant impact on the prognosis [3].
Traditional examination methods for digestive system tumors mainly include X-ray barium meal, CT and Endoscopic ultrasound, but their common limitations means that new imaging technologies are needed to improve the delineation of disease extent, the detection of lymph node metastases, and the assessment of treatment response.In recent years, with the update of MRI scanning technology, its application in digestive system tumors has gradually been recognized [4]. Whole-body fully integrated PET/MRI combining with the advantages of PET imaging with MRI has the advantage of superior soft tissue contrast, and it can provide crucial information such as tumour depth and nodal involvement, as well as tumor function and metabolism, which has been widely introduced in the clinical practice in recent years [5]; however, there are still few literatures focus on the application of PET/MRI in the detection and staging of digestive system tumors[6, 7].
This article searched the comparative studies comparing PET/MRI and PET/CT in the detection and staging of oesophago and gastric carcinomas. We discussed the difference in the detection rate of the primary tumor, lymph node metastasis, and the other metastasis. This article aimed to provide a better choice for patients with oesophago and gastric carcinomas in the screening, condition evaluation and treatment effect monitoring, and finally improving of the survival benefit.
Materials and methods
The protocol of this meta-analysis was registered in PROSPERO (CRD42024598923).
This systematic review was based on the Preferred.
Reporting Items for Systematic Reviews and Meta-analysis (PRISMA) statements.
Study selections
The related studies were retrieved in the following databases: PubMed, Embase, Web of Science, the Cochrane Central Library, and CNKI from inception to 1st September 2024.For all databases, the search strategy includes the use of the following terms:“PET/MRI”,“PET/CT”,“Oesophago Carcinomas”or“Gastric Carcinomas”.To prevent missed cases, we also increased manual search, manual search strategy only includes the “PET/MRI”,“Oesophago Carcinomas”or“Gastric Carcinomas”.This meta-analysis was in line with the Critical Appraisal Skills Programme Checklist.Data extraction and conformity assessment were conducted by two independent reviewers.The differences among the reviewers were resolved through group discussion.
Inclusion and exclusion criteria
Two independent reviewers assessed eligibility and reached a consensus by discussing differences with a third investigator.The evaluation was repeated twice. First of all, the title and abstract were preliminarily evaluated, and the full text was evaluated after the potentially qualified study was selected. No reviewers were blinded to the authors of these studies.
Inclusion criteria
(1) Type of study
The analysis included only comparative trials published in fully peer-reviewed journals before 1st September 2024.
(2) Language
Only English and Chinese articles were included.
(3) Type of intervention
Both two different diagnostic techniques for detection and staging of oesophago and gastric carcinomas.
(4) Type of participants
Patients who developed oesophago or gastric carcinomas were the target population for the meta-analysis.
Exclusion criteria
(1) Non-comparative trials and unpublished studies were excluded.
(2)No final pathological staging results were excluded.
(3)No relevant results(Did not contain all the PET/MRI staging details and PET/CT staging details)were found.
Data collection
We extracted the following data: first author, year of the study, country of origin, number of participants, age, radiopharmaceuticals, final pathological staging results, PETMRI/CT staging results. Two authors independently extracted and cross-checked all data. The differences were resolved through in-depth discussions with a third reviewer until we reached a consensus.
Evaluation of quality of evidence
Two independent reviewers blindly evaluated the methodological quality of the selected studies. Differences were discussed among the groups and resolved by a third evaluator. The risk of bias tool suggested by the Cochrane Handbook for Systematic Reviews of Interventions was used to adjudicate the methodological quality of RCTs [8]. The Newcastle-Ottawa Scale was used to assess the methodological quality of non-RCTs [9].
Statistical analysis
Stata software ver.12 was used to conduct statistical analysis. The Q test and I2 statistic were used to assess the heterogeneity of the detecting effects. Significant heterogeneity was defined as p < 0.1 and I2 > 50%, and the random effect model was used, otherwise, the fixed effect model was used. The relative risk and their 95% confidence interval were calculated. Publication bias was assessed qualitatively by Funnel plot, and statistically using Egger’s and Begg’s test. Sensitivity analysis was conducted by excluding a single study and recalculating the pooled estimates. P < 0.05 was considered to be significant (p values were two-sided).
Results
Characteristics of studies
As shown in the flow diagram (Fig. 1), 57 clinical studies were identified by search strategy, 3 studies were identified by manual search. And finally a total of 6 studies were finalized based on the predefined inclusion and exclusion criteria.
Fig. 1. Flow diagram
There were 123 patients in the 6 studies[6–7, 10–13], which all included PET/MRI and PET/CT. Among them, 5 studies compared PET/MRI staging, PET/CT staging, and pathological staging; 1 study compared PET/MRI with PET/CT staging but not compared pathological staging [13]. The study characteristics are shown in Table 1.
Table 1. The characteristics of studiesFirst authorYearCountryNo. of patientsAgeRadiopharmaceuticalsPathologicalPETMRI/CT Staging or notLee2014Korea1568.1 ± 7^18^F-FDG-PET/MRI^18^F-FDG-PET/CTOesophageal CancerStagingLinder2019Sweden1665(46–78)^18^F-FDG-PET/MRI^18^F-FDG-PET/CTOesophageal and gastroesophageal junctional cancerStagingLiu2019China2634–76^18^F-FDG-PET/MRI^18^F-FDG-PET/CTGastric CancerStagingQin2022China1435–70^68^Ga-DOTA-FAPI-04-PET/MR^18^F-FDG-PET/CTGastric CancerStagingSharkey2021UK2268.8 ± 8.7^18^F-FDG-PET/MRI^18^F-FDG-PET/CTOesophageal/Gastro‑oesophageal cancerStagingZheng2020China3034–76^18^F-FDG-PET/MRI^18^F-FDG-PET/CTGastric CancerNo Staging
Primary outcomes
Sensitivity in primary lesion detection.
Three of the included studies reported the primary lesion detection evaluations(Table 2). PET/MRI had a comparatively high sensitivity in primary lesion detection evaluations compared with PET/CT. (RR = 1.14, 95% CI 1.01–1.29, P = 0.036) (Fig. 2).
Table 2. The characteristics of primary lesion detection evaluationsFirst authorYearCountryNo. of PET/MRI findingNo. of PET/CT findingNo. of Pathological findingLee2014Korea141215Qin2022China141014Zheng2020China292830
Fig. 2. Forest plots of primary lesion detection evaluations
Accuracy of TNM staging.
Five studies reported the accuracy of TNM staging. PET/MRI had no significant statistical differences in all aspects of TNM staging compared with PET/CT: T1(RR = 1.67, 95% CI 0.69–4.06, P = 0.030), T2(RR = 0.78, 95% CI 0.41–1.48, P = 0.444), T3(RR = 1.16, 95% CI 0.77–1.74, P = 0.480), T4(RR = 1.00, 95% CI 0.76–1.32, P = 1.000), N0(RR = 0.83, 95% CI 0.60–1.13, P = 0.232), N1(RR = 1.18, 95% CI 0.83–1.68, P = 0.368), N2(RR = 0.80, 95% CI 0.49–1.31, P = 0.377), N3(RR = 1.86, 95% CI 1.03–3.36, P = 0.041), M1(RR = 1.15, 95% CI 0.92–1.44, P = 0.226).(Table 3, 4; Figs. 3, 4 and 5).
Table 3. The detection evaluations of T stagingFirst authorNo. of PET/MRI findingNo. of PET/CT findingNo. of Pathological findingT1T2T3T4T1T2T3T4T1T2T3T4Lee842037209240Linder0123108440862Liu53513464125488Qin003110001001211Sharkey051250129100184
Table 4. The detection evaluations of N and M stagingFirst authorNo. of PET/MRI findingNo. of PET/CT findingNo. of Pathological findingN0N1N2N3M1N0N1N2N3M1N0N1N2N3M1Lee9600011400096000Linder562375812656237Liu916103125813114564Qin524312704310334412Sharkey39551037831029839
Fig. 3. Forest plots of detection evaluations of T staging. A: T1. B: T2. C: T3. D: T4
Fig. 4. Forest plots of detection evaluations of N staging. A: N0. B: N1. C: N2. D: N3
Fig. 5. Forest plots of detection evaluations of M1 staging
Discussion
In recent years, as PET/MRI has been gradually used in clinical, its advantages, such as higher soft tissue contrast and no risk of radiation exposure, have been gradually recognized compared to PET/CT. Now PET/MRI has been gradually used in various diseases throughout the body detection and staging of tumors [14]. However, previous studies have shown that the application of PET/MRI in gastric cancer and esophageal cancer is limited due to motion artifact interference caused by respiratory movement or gastrointestinal motility [15]. In recent years, with the continuous updating of MRI scanning technology, such as respiratory gating technology, studies have shown that PET/MRI is better than PET/CT in detecting gastric cancer and esophageal cancer [5, 13, 16]. In this study, the detection rate of PET/MRI for primary tumors of gastric and esophageal cancer was greater than that of PET/CT(P < 0.05), which is consistent with previous studies.
In terms of tumor T staging, most previous studies believe that PET/MRI is equivalent to PET/CT [14, 17]. Some studies even believe that PET/MRI is more accurate than PET/CT. They believe that PET/MRI has better soft tissue resolution, which can more clearly display the structure of each layer of the esophagus and gastric wall as well as the relationship between the tumor and surrounding tissues, and the display of the details of the tumor itself (such as shape, edges, etc.) is also better than PET/CT, so that it can be performed more accurately T staging [18–20]. In this study the results of Table 3 showed that PET/MRI classified more T3 stages than PET/CT (conversely for T2 stages), this could be related to higher spatial resolution of MRI and soft-tissue definition, but the meta-analysis statistical results of Fig. 3 showed that the the difference between them were not statistically significant, so we believe that the accuracy of PET/MRI in T1-4 stages were equivalent to that of PET/CT. It is speculated that it may be related to the sample size, so larger studies are necessary to fully assess the benefit of PET/MRI in N staging of oesophago and gastric cancer.
In terms of tumor N staging, previous studies have reported that PET/MRI is more accurate than PET/CT in N staging. It is speculated that in addition to providing lymph node size and metabolic uptake, PET/MRI also has more parameters for lymph node classification and judgment of metastasis, such as DWI and ADC values [21]. In this study the results of Table 4 showed that the PET/MRI demonstrates more N3 stages than PET/CT (which classifies more N2 patients), especially in the study by Liu 2019,this could be related to lymph node morphological characteristics, or DWI or post-gadolinium contrast behaviour, that are interpreted as possible metastasis, and which are not apparent on PET/CT in case these lymph nodes are metabolically negative on PET imaging.But the meta-analysis statistical results of Fig. 4 showed that the the difference between them were not statistically significant, it is speculated that the reason may be that the judgment of lymph node metastasis by imaging examination is more complicated, not simply relying on size or metabolic uptake criteria [22], and although PET/MRI can provide more judgment parameters, there is no unified judgment standard for each parameter [23], so its judgment on lymph node metastasis needs to be further studied.
In terms of tumor M staging, the results of this study showed that both PET/MRI and PET/CT had higher accuracy in detecting distant metastasis of tumors, and the difference between them was not statistically significant. It is also due to the high accuracy provided by MRI and the high specificity provided by PET, which enable PET/MRI to detect almost all bone metastases and distant organ metastases [24], which is consistent with our study.
This study had limitations: (1) The overall sample size of this study was relatively small, and studies with larger sample sizes are needed in the future to further confirm the application value of PET/MRI in the detection and staging of gastric and esophageal cancer. (2) The different PET radiopharmaceuticals may cause deviations to the results in this study. Some classification studies have shown that the new [68 Ga]Ga-FAPI-04 contrast agent may have better gastrointestinal tumor-promoting properties than the traditional [18 F]-FDG [25, 26]. So the PET/MRI using [68 Ga]Ga-FAPI-04 in this study [11] may achieve a higher detection rate and more accurate staging of gastric and esophageal cancer, but unfortunately, there is only one article which cannot be included in the meta-analyzed, so in the next step we will also conduct comparative studies on PET/MRI or PET/CT using different PET radiopharmaceuticals. (3) At present, compared with PET/CT, PET/MRI still lacks an internationally certified standardized scanning protocol. In this analysis, PET/MRI scanning protocols were also different, and some studies [27]reported the scanning plan or sequence might influence the results in detecting primary lesions and lymph nodes, so standardized PET/MRI protocols are needed to promote the quality and consistency of PET/MRI across centers, also to help streamline examinations and limit acquisition times.
Conclusion
This systematic review confirmed the advantage of PET/MRI in detecting oesophago and gastric carcinomas.Compared with PET/CT, it can reduce unnecessary radiation exposure and can be used in relevant patients without contraindications of MRI.
The reference list from the paper itself. Each links out to its DOI / PubMed record.
- 1Smyth EC, Nilsson M, Grabsch HI,Grieken NC, Lordick F. Gastric cancer. lancet. 2020;396(10251):635–48.10.1016/S 0140-6736(20)31288-532861308 · doi ↗ · pubmed ↗
- 2Valkema MJ Sablonière, QG,Valkema R, et al. 18 F-FDG PET/MRI for restaging esophageal cancer after neoadjuvant chemoradiotherapy. Nucl Med Commun. 2024;45(2):128–38.10.1097/MNM.000000000000179337982560 · doi ↗ · pubmed ↗
- 3Julian PT, Higgins. Sally Green.Cochrane Handbook for Systematic Reviews of Interventions Version 6.3.2022. Available at:http://training.cochrane.org/handbook/current
- 4Wells G, Shea BJ,O'Connell D et al. The Newcastle-Ottawa Scale (NOS) for assessing the quality of nonrandomised studies in meta-analyses.2000.Available at:http://www.ohri.ca/programs/clinical_epidemiology/oxford.asp
- 5Liu Y, Zheng D, Liu JJ et al. Comparing PET/MRI with PET/CT for pretreatment staging of gastric cancer. Gastroenterol Res Pract 2019:9564627.10.1155/2019/9564627 PMC 637805030863443 · doi ↗ · pubmed ↗
- 6Singnurkar AMDCM. MPH Head-to-Head comparison of the diagnostic performance of FDG PET/CT and FDG PET/MR in patients with cancer: A systematic review and Meta-Analysis. AJR 10.2214/AJR.24.3151910.2214/AJR.24.3151939016450 · doi ↗ · pubmed ↗
- 7Ateş SG, Aydos U,Akdemir ÜÖ et al. Respiratory-gated 18F Fluorodeoxyglucose positron emission omography/magnetic resonance imaging in evaluation of primary gastric lesions and gastric lymph nodes in patients with gastric cancer.clin oncol (R Coll Radiol). 2022;34(12):810–8.10.1016/j.clon.2022.09.04436192283 · doi ↗ · pubmed ↗
- 8Du T, Zhang S, Cui XM et al. Comparison of [68Ga]Ga-DOTA-FAPI-04 and [18F]FDG PET/MRI in the preoperative diagnosis of gastric cancer. Can J Gastroenterol Hepatol. 2023:6351330.10.1155/2023/6351330 PMC 1011889237090103 · doi ↗ · pubmed ↗