Use of Patient Portal Messaging and Self-Reported Copays Among US Adults 50 Years or Older
Terrence Liu, Matthias Kirch, Erica Solway, Dianne C. Singer, J. Scott Roberts, Jeffrey T. Kullgren, Tammy Chang

TL;DR
The study examines how often US adults aged 50 or older report copays for using patient portal messaging, based on their health insurance type.
Contribution
It provides new insights into the association between health insurance types and copay reporting for portal messaging use.
Findings
Prevalence of reported copays varied by insurance type.
Older adults using patient portals may face financial barriers depending on their coverage.
Abstract
This survey study characterizes the prevalence of reported copays for portal messages by health insurance type among US adults aged 50 years or older who used portal messaging.
Genes, proteins, chemicals, diseases, species, mutations and cell lines named across the full text — each resolved to its canonical identifier and authoritative record.
Click any figure to enlarge with its caption.
 Figure
| Characteristic | Respondents, No. (n = 3212) | Weighted % (95% CI) |
|---|---|---|
| Having a patient portal | 2478 | 76.2 (72.9-79.1) |
| Sent a portal message | 1628 | 64.7 (62.3-67.2) |
| Charged copays for a portal message | 180 | 13.1 (11.4-15.0) |
| Age, y | ||
| 50-64 | 1482 | 53.2 (47.8-58.6) |
| 65-101 | 1730 | 46.8 (41.4-52.2) |
| Gender identity | ||
| Male | 1436 | 46.7 (43.4-50.0) |
| Female | 1756 | 53.3 (49.9-56.6) |
| Race and ethnicity | ||
| Hispanic | 414 | 11.1 (9.6-12.8) |
| Non-Hispanic Black | 597 | 10.2 (9.3-11.1) |
| Non-Hispanic White | 2067 | 70.6 (68.9-72.3) |
| Non-Hispanic other | 134 | 8.1 (6.9-9.4) |
| Educational level | ||
| High school or lower | 672 | 39.9 (36.9-42.9) |
| Some college | 1334 | 28.1 (26.9-29.4) |
| Bachelor’s degree or higher | 1206 | 32.1 (28.9-35.4) |
| Annual household income, $ | ||
| <60 000 | 1546 | 48.4 (46.9-50.0) |
| ≥60 000 | 1666 | 51.6 (49.9-53.2) |
| Living in an MSA | ||
| Yes | 2724 | 85.1 (82.3-87.5) |
| No | 488 | 14.9 (12.5-17.7) |
| Having broadband internet at home | ||
| Yes | 2900 | 89.9 (88.1-91.4) |
| No | 312 | 10.1 (8.6-11.9) |
| Past-year health care utilization | ||
| 0 | 212 | 7.7 (6.5-9.1) |
| 1-2 | 1033 | 33.2 (31.6-34.8) |
| ≥3 | 1949 | 59.1 (57.4-60.8) |
| Self-rated physical health | ||
| Excellent, very good, or good | 2586 | 81.1 (79.2-82.8) |
| Fair or poor | 620 | 18.9 (17.2-20.8) |
| Self-rated mental health | ||
| Excellent, very good, or good | 2814 | 89.2 (88.2-90.3) |
| Fair or poor | 333 | 10.7 (9.7-11.8) |
| Health insurance type | ||
| Private | 1141 | 40.1 (36.5-43.8) |
| Medicare Advantage | 855 | 23.5 (20.4-26.9) |
| Traditional Medicare with supplemental insurance | 522 | 15.4 (13.6-17.3) |
| Traditional Medicare without supplemental insurance | 142 | 4.2 (3.5-5.1) |
| Dual-eligible or only Medicaid | 310 | 9.6 (8.0-11.5) |
| VA or military | 242 | 7.3 (6.6-8.0) |
Peer Reviews
No public reviews on file for this paper yet. If you reviewed it on a platform where reviews are public (OpenReview, ICLR, NeurIPS, ICML), you can paste yours below so the community can read it here.
Videos
No videos yet. Explain this paper in a talk, walkthrough, or lecture? Add one.
Taxonomy
TopicsMobile Health and mHealth Applications · Health Literacy and Information Accessibility · Healthcare Systems and Technology
Introduction
Secure portal messages allow patients to connect with their health care teams between clinic visits. Older adults, who often have multiple chronic conditions, may particularly benefit from portal messages, given challenges with accessing care and addressing all health issues comprehensively in a single office visit. In 2020, telemedicine reimbursement expanded, allowing clinicians to bill for portal messages that require clinician time for medical decision-making.^1,2^ However, copays associated with portal messages may discourage patients, especially individuals with low income, from communicating important health information through the portal. Furthermore, coverage for billed portal messages vary by insurance plan. Our objective was to characterize the prevalence of reported copays for portal messages by health insurance type among US adults aged 50 years or older who used portal messaging.
Methods
From February 22 to March 12, 2024, we conducted a cross-sectional survey using a probability-based sample of US adults aged 50 years or older (43.7% completion rate [eMethods in Supplement 1]) through the University of Michigan National Poll on Healthy Aging and weighted the sample to reflect population figures from the US Census Bureau.^3^ The University of Michigan institutional review board deemed this study exempt and waived informed consent because the data were deidentified. We followed the AAPOR reporting guideline.
Older adults were asked if they had a patient portal, had messaged a health care professional (the term health care provider was used in our survey) through the portal, and whether they were charged a copay for sending a message. Self-reported sociodemographic information and health insurance information were collected. We used multivariable logistic regression with average marginal effects to estimate associations between having been charged a copay for sending a portal message (primary outcome) and health insurance type (main variable; eMethods in Supplement 1). We used sample weights to account for probability-based sampling design and survey nonresponse. Two-sided P < .05 was considered statistically significant. Analyses were conducted using Stata, version 18.
Results
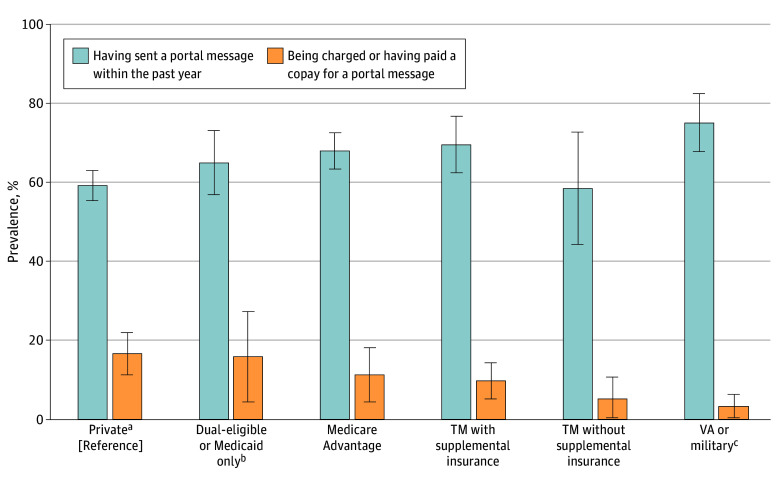
Of the 3212 respondents (mean age, 65 [95% CI, 64-66] years; weighted, 53.3% women and weighted, 46.7% men), 76.2% (95% CI, 72.9%-79.1%) of respondents reported having a patient portal and 64.7% (95% CI, 62.3%-67.2%) reported sending a portal message in the past year (Table). Across health insurance types, most older adults reported having sent a portal message in the past year, ranging from 58.6% (95% CI, 44.3%-72.8%) of those with traditional Medicare without supplemental insurance to 75.2% (95% CI, 67.9%-82.5%) of those with Veterans Affairs coverage (Figure). A lower proportion of older adults (13.1% [95% CI, 11.4%-15.0%]) reported being a charged a copay for sending a portal message (Table), with the highest estimate being 16.6% (95% CI, 11.2%-21.9%) for those privately insured, followed by 15.9% (95% CI, 4.5%-27.4%) for those dual-eligible or with Medicaid (Figure).
Self-Reported Use of Portal Messages and Charged Copays by Health InsuranceThe adjusted estimated prevalence of having sent a portal message in the past year and being charged or having paid a copay for a portal message is shown. The models were adjusted for age, gender identity, race and ethnicity, educational level, income, living in a metropolitan statistical area, having home internet, number of times receiving medical care from a health care professional in the past year, and self-reported health status. Private health insurance was used as the reference group for analyses. Error bars indicate 95% CIs. TM indicates traditional Medicare; VA, Veterans Affairs.aIncludes respondents selecting retiree health plans, employer-sponsored insurance, or individual insurance plans purchased directly by individuals including from an online marketplace.bIncludes respondents selecting Medicaid as their only insurance, or Medicaid in addition to another type of insurance.cIncludes respondents selecting VA and TRICARE coverage. This category includes respondents who reported having VA or TRICARE coverage in addition to another type of insurance.
Discussion
In this nationally representative survey study of adults aged 50 years or older, most individuals reported sending a portal message to their health care professional in the past year, with a minority reporting ever having a copay for such messages. The low prevalence of copays in our study is consistent with prior studies showing full coverage of portal message out-of-pocket costs among privately insured patients over 80% of the time, with estimates ranging from 40 per message when not covered.^4^ We found that Medicaid-eligible individuals had similar estimated prevalences of reported copays compared with privately insured individuals. Although we lack data on self-reported out-of-pocket costs, our findings highlight a potential gap where Medicaid-eligible individuals may not experience the same degree of cost-sharing reduction they typically receive for many other clinical services.^5^ Limitations include inability to identify nonbillable messages and data being self-reported and subject to possible recall bias, which may underestimate the true prevalence of charged copays.^6^ Future research should explore how variation in portal message copays across payers, particularly Medicaid, impact health care utilization among individuals with low income.
The reference list from the paper itself. Each links out to its DOI / PubMed record.
- 1Liu T, Zhu Z, Holmgren AJ, Ellimoottil C. National trends in billing patient portal messages as e-visit services in traditional Medicare. Health Aff Sch. 2024;2(4):qxae 040. doi:10.1093/haschl/qxae 04038756169 PMC 11034524 · doi ↗ · pubmed ↗
- 2Holmgren AJ, Oakes AH, Miller A, Adler-Milstein J, Mehrotra A. National trends in billing secure messages as e-visits. JAMA. 2024;331(6):526-529. doi:10.1001/jama.2023.26584 38198195 PMC 10782378 · doi ↗ · pubmed ↗
- 3Technical overview of the Ameri Speak Panel: NORC’s probability-based household panel. University of Chicago. Accessed August 3, 2024. https://amerispeak.norc.org/content/dam/amerispeak/about-amerispeak/pdf/amerispeak-technical-overview.pdf
- 4Lo J, Amin K, Cox C. Charges for emails with doctors and other healthcare providers. Peterson-KFF Health System Tracker. March 6, 2024. Accessed June 4, 2024. https://www.healthsystemtracker.org/brief/charges-for-emails-with-doctors-and-other-healthcare-providers/
- 5Brooks T, Roygardner L, Artiga S, Pham O, Dolan R. Medicaid and CHIP eligibility, enrollment, and cost sharing policies as of January 2020: findings from a 50-state survey: premiums and cost sharing—9428. KFF. March 26, 2020. Accessed August 2, 2024. https://www.kff.org/report-section/medicaid-and-chip-eligibility-enrollment-and-cost-sharing-policies-as-of-january-2020-findings-from-a-50-state-survey-premiums-and-cost-sharing/
- 6Berk ML, Schur CL, Mohr P. Using survey data to estimate prescription drug costs. Health Aff (Millwood). 1990;9(3):146-156. doi:10.1377/hlthaff.9.3.146 2121635 · doi ↗ · pubmed ↗