First Complete Mitochondrial Genome Analysis of Tree Frog, Dryophytes flaviventris and Comparison with Dryophytes suweonensis
Nakyung Yoo, Kang-Rae Kim, Biet Thanh Tran, Keun-Yong Kim, Mi-Sook Min, Ju-Duk Yoon, Keun-Sik Kim

TL;DR
This paper reports the first complete mitochondrial genome of Dryophytes flaviventris and compares it with D. suweonensis, finding no genetic differentiation between the two species.
Contribution
The study provides the first complete mitogenome data for Dryophytes flaviventris and reveals that it is not genetically distinct from D. suweonensis.
Findings
The mitogenomes of Dryophytes flaviventris and D. suweonensis are nearly identical in size and structure.
Phylogenetic analysis shows that the two species do not form distinct clades, indicating no genetic differentiation.
Mitochondrial DNA cannot differentiate between D. flaviventris and D. suweonensis, suggesting they are not reciprocally monophyletic.
Abstract
Mitochondrial genomes (mitogenomes) play a key role in species identification and phylogenetic studies due to their stable gene arrangements and evolutionary insights. Dryophytes flaviventris, classified in 2020 and closely related to D. suweonensis, lacks mitochondrial DNA data for differentiation. This gap hinders accurate species identification, highlighting the need for further genomic studies. The complete mitogenome size of two D. flaviventris were 18,616–18,617 bp and those for two D. suweonensis were 18,610–18,616 bp, the mitogenomes of the two species consisting of 13 protein-coding genes (PCGs), two ribosomal RNA genes, 22 transfer RNA (tRNA) genes, and a D-loop. Phylogenetic analysis confirmed that the mitochondrial DNA of all four individuals formed a monophyletic group, showing no genetic differentiation. As a result, the two species do not form distinct clades, and…
Genes, proteins, chemicals, diseases, species, mutations and cell lines named across the full text — each resolved to its canonical identifier and authoritative record.
Click any figure to enlarge with its caption.
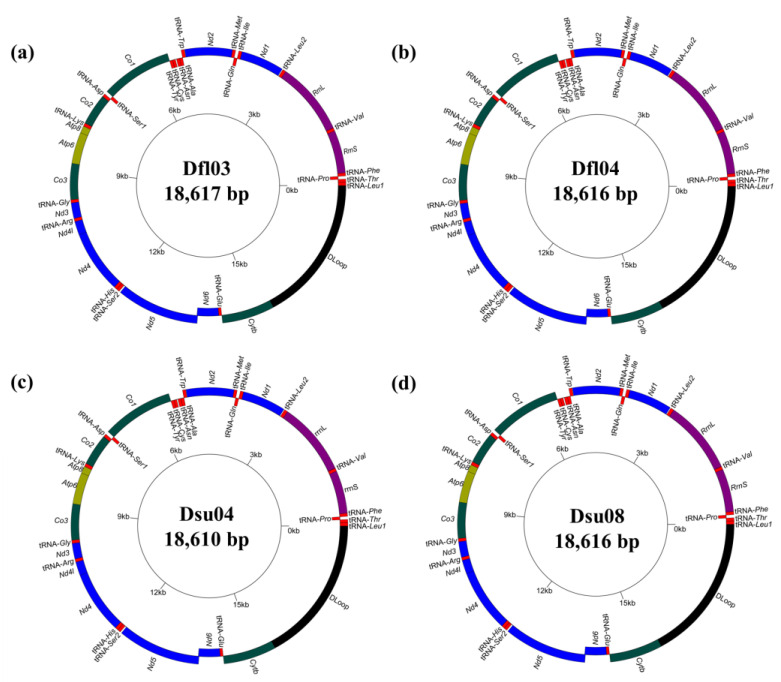 Figure 1
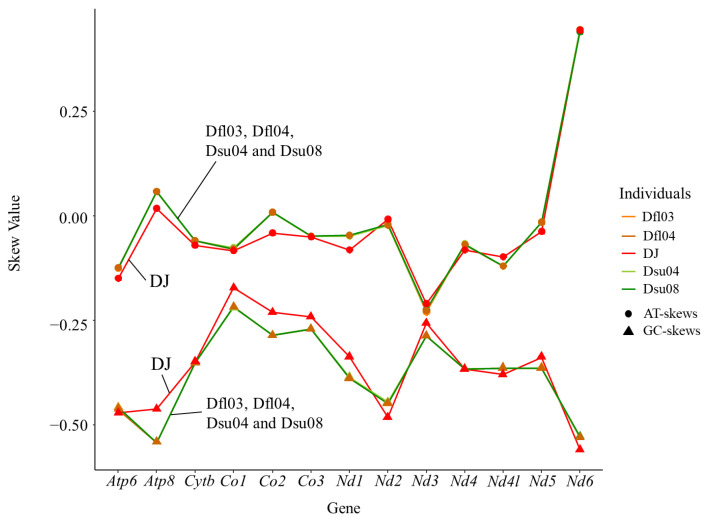 Figure 2
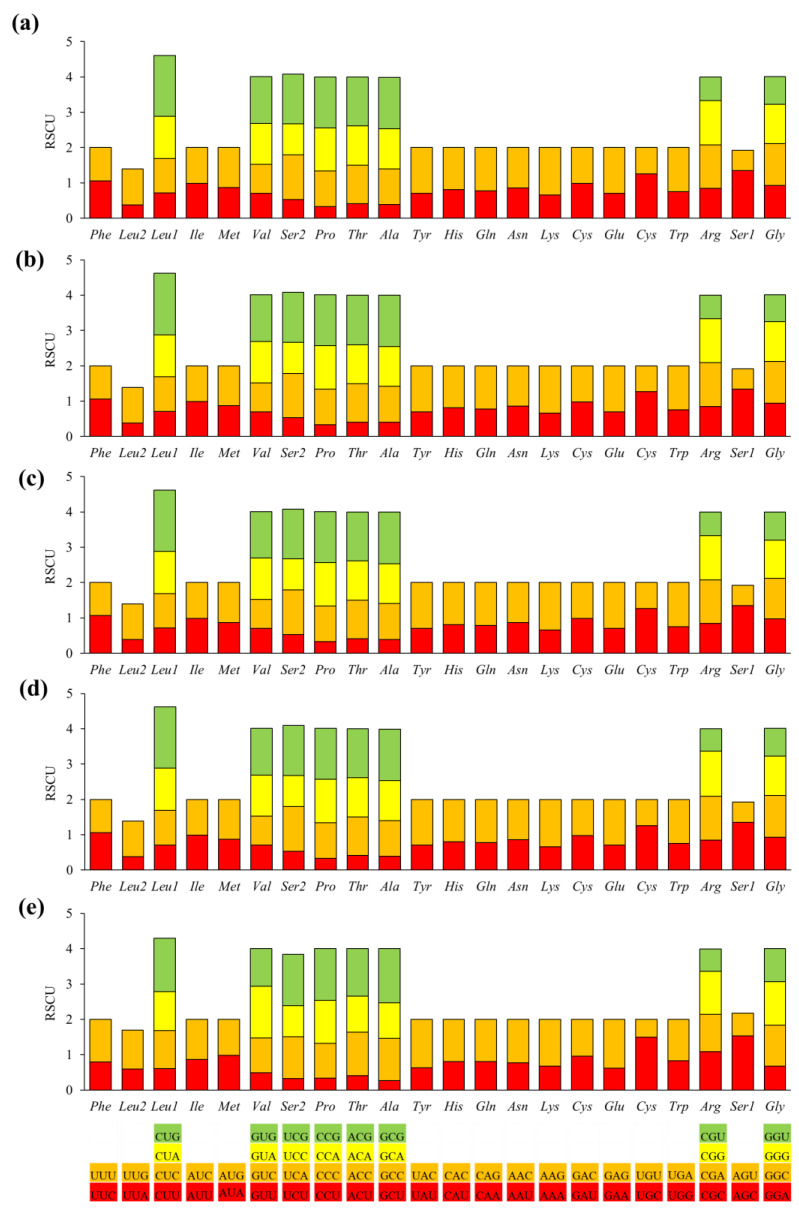 Figure 3
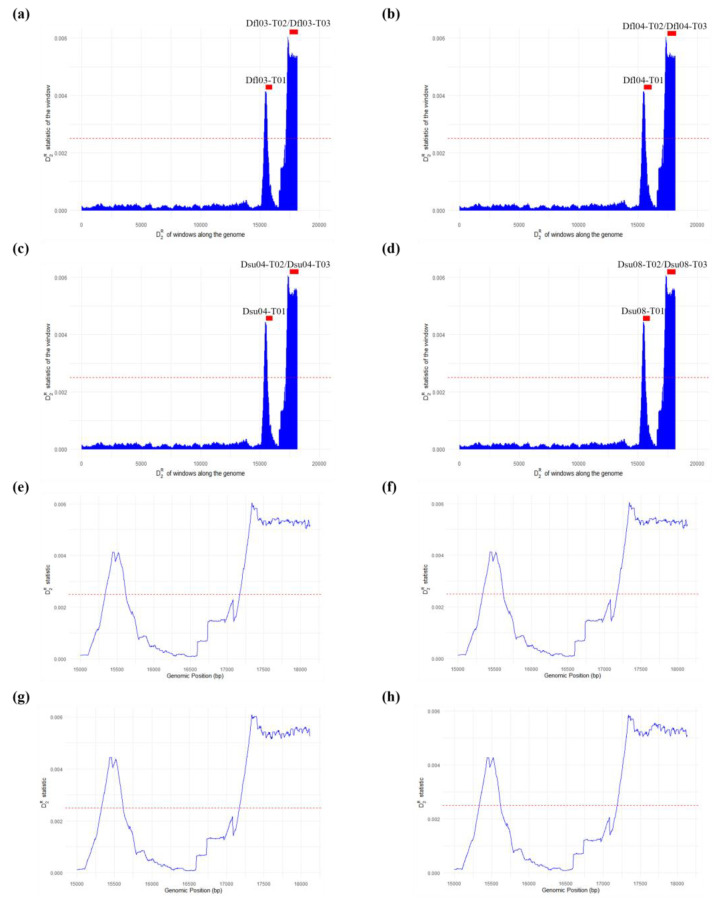 Figure 4
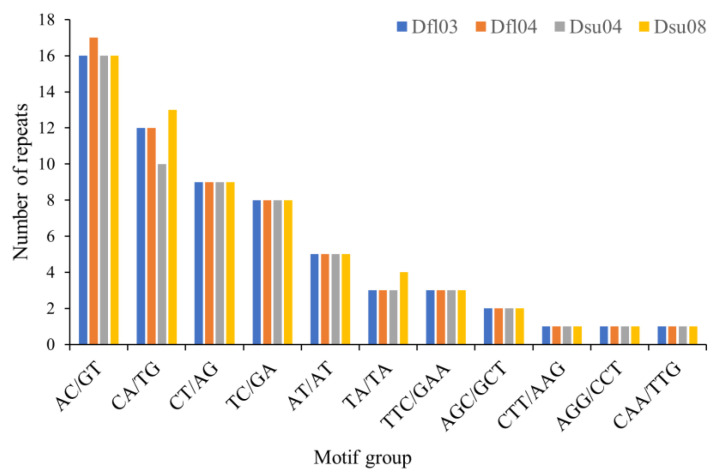 Figure 5
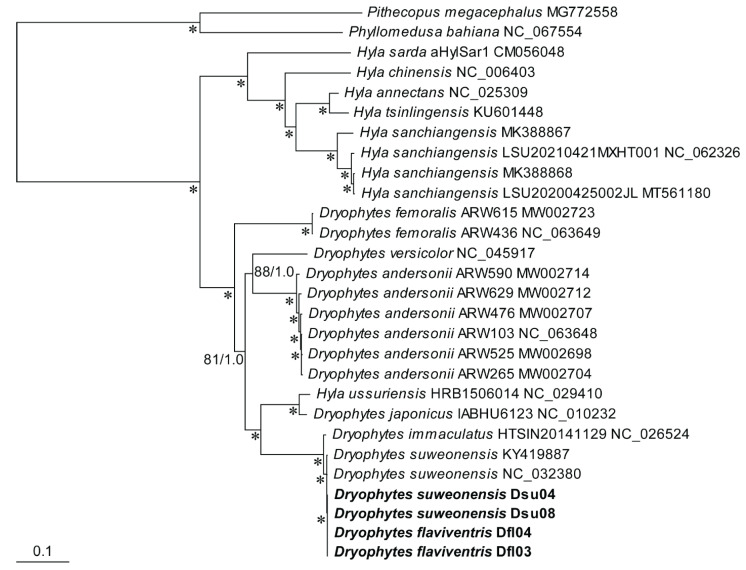 Figure 6
- —National Institute of Ecology (NIE)
- —Ministry of Environment (MOE) of the Republic of Korea
Peer Reviews
No public reviews on file for this paper yet. If you reviewed it on a platform where reviews are public (OpenReview, ICLR, NeurIPS, ICML), you can paste yours below so the community can read it here.
Videos
No videos yet. Explain this paper in a talk, walkthrough, or lecture? Add one.
Taxonomy
TopicsGenomics and Phylogenetic Studies · Amphibian and Reptile Biology · Aquaculture disease management and microbiota
1. Introduction
Mitochondrial DNA (mtDNA) is maternally inherited and non-recombining, making it suitable for tracing the evolutionary history of specific lineages [1]. MtDNA is also valuable for estimating divergence times across various taxa, with estimates reaching as far back as 300 million years [2,3].
The mtDNA of vertebrates is typically small, averaging around 16 kb, which facilitates whole-genome sequencing [4]. While gene arrangements in mtDNA tend to be stable within major groups [4], variations do occur, and comparing these arrangements can reveal deep branches in the phylogenetic tree of multicellular animals [4,5]. This stability makes mtDNA valuable for inferring phylogenetic relationships across species. Additionally, mtDNA exists in multiple copies within cells, making extraction and analysis more efficient [1]. This feature is especially advantageous when working with endangered wildlife or degraded samples. Furthermore, the faster evolutionary rate of mtDNA compared to nuclear DNA makes it well suited to detect subtle genetic differences between closely related species [2].
In the case of frogs, morphological characteristics alone have limitations in distinguishing species, making genetic markers the most accurate method for species identification [6,7]. The mitochondrial genome (mitogenome), with its suitable size and stability, provides robust data for investigating the phylogenetics of anurans [8]. Given that most family-level taxa are represented by a single species, analyzing mitogenome sequences in anurans is particularly useful for confirming phylogenetic relationships.
According to Duellman et al. (2016) [9], two Nearctic hylid clades are distinctly clustered in phylogenetic trees. One genus, Hyla, is endemic to the Old World, while the other, Dryophytes, is primarily distributed in the New World, with three species found in Asia. Dryophytes species are typically medium-sized, arboreal frogs with green coloration and toe pads. Although they are closely related to the genus Hyla, they do not exhibit significant morphological differences from Hyla. The genus Dryophytes includes 19 species, of which, 16 species are endemic to eastern North America, and the other three are found in Asia (Korea, China, Japan, and Russia).
Only two tree frogs species were recognized in the Republic of Korea before 2020: the Suweon tree frog (Dryophytes suweonensis) and the Japanese tree frog (D. japonicus), which was classified under Hyla until 2016 [9]. However, with the recent identification of Dryophytes flaviventris, the Republic of Korea now has three tree frog species. Borzée et al. (2020) [10] reported the discovery of D. flaviventris, which is geographically segregated from D. suweonensis by the Chilgap mountain range. While D. suweonensis inhabits large plains along the western coast of the Republic of Korea, D. flaviventris has a more restricted range and may face greater threats. Given that D. suweonensis is already classified as endangered (EN) on the IUCN Red List [11], there is an urgent need for further research to definitively differentiate D. flaviventris from D. suweonensis and assess the conservation status of D. flaviventris, which may also warrant its classification as an endangered species. Additionally, D. flaviventris is morphologically distinguishable from D. suweonensis by a smaller web between its second and third toes. Borzée et al. (2020) [10] presented a phylogenetic tree using double-digest RAD sequencing (ddRAD) analysis to show genetic differences between the two species. However, their study did not include mtDNA analysis, which could more clearly distinguish the two species.
This study presents the first complete analysis of the mitogenome of D. flaviventris. To establish genetic information for the tree frog species in the Republic of Korea and to identify endangered species such as D. flaviventris and D. suweonensis, it is necessary to analyze and compare their complete mitogenomes. This is the inaugural comprehensive analysis of the mitogenome of D. flaviventris, which will provide critical data for future taxonomic and conservation studies.
2. Results and Discussion
2.1. Basic Characteristics of D. flaviventris Mitogenomes
The complete mitochondrial genomes of D. flaviventris (Dfl03 and Dfl04) and D. suweonensis (Dsu03 and Dsu04) were sequenced using long-range PCR and iSeq100 sequencing (Supplementary Table S1). The sequencing quality was high, with Q20 (>97%) and Q30 (>93%) scores. Mapping to the reference genome (GenBank accession number KY419887) showed 100% coverage, with mean depths ranging from 3771× to 5382× (Supplementary Table S2). Coverage depth analysis revealed variations across the mitochondrial genome, with regions of higher read accumulation (Supplementary Figure S1).
The complete and circular mitogenome sequences of D. flaviventris ranged from 18,616 to 18,617 bp in size (Figure 1). With few exceptions, the mitogenomes of most animals have a consistent gene structure, comprising 13 PCGs, two rRNAs, 22 tRNAs, and the non-coding region [4]. The mitogenomes of the two specimens of D. flaviventris used for comparison also contained 37 mitochondrial genes, including 13 PCGs, two rRNA genes, 22 tRNA genes, and the non-coding control region. The majority strand (H-strand) contained 12 PCGs, 14 tRNAs, and two rRNAs, and the minority strand (L-strand) contained one PCG and eight tRNAs. The base compositions were as follows: A (29.12–29.13%), T (28.48–28.50%), C (27.44–27.47%), G (14.92–14.93%), and G + C contents ranged from 42.36–42.40%. The analysis of the complete mitogenomes’ nucleotide skew showed that they had a negative GC-skew value (−0.30) but a positive AT-skew value (0.01).
We compared one D. japonicus (AB303949) and two D. suweonensis (DSU04 and DSU08) to the two D. flaviventris from the Republic of Korea. The complete and circular mitogenome sequences of D. suweonensis ranged from 18,610 to 18,616 bp, which differed from D. flaviventris by 0–7 bp (Figure 1), while the D. japonicus mitogenome comprised 19,519 bp. The GC-skew of the full-length mitogenomes among the three species varied from −0.30 to −0.27; however, the AT-skew varied from −0.02 to 0.01. These results show that, compared with other Dryophytes species, the whole mitogenomes of D. suweonensis and D. flaviventris have higher AT-skew values and the lowest GC-skew values. The overall G + C contents of D. suweonensis ranged from 42.37 to 42.39%, showing that there was little difference from the G + C content of D. flaviventris.
According to the findings of Frost and Darrel (2024), D. suweonensis and D. immaculatus are considered synonymous, and D. japonicus is regarded as the same species as D. ussuriensis [12]. In both cases, the identity rates reached mean that there is little difference in the size of the mitogenomes, with an identity rate reaching 99% [13]. In this study, the identity rate between all the specimens of D. flaviventris and D. suweonensis was also close to 99% (99.6–99.8%), and the mitogenome size differences between D. flaviventris and D. suweonensis were found to be less than 10 bp. Therefore, based on the mitogenome sequence similarity between D. flaviventris and D. suweonensis, we suggest that they are taxonomically and phylogenetically the same species.
2.2. PCGs and Codon Usage Patterns of D. flaviventris
The total length of the 13 PCGs was 11,304 bp. The A + T contents (56.48–56.52%) in the PCGs were higher than the G + C contents (43.48–43.52%). The AT-skew (−0.03) and the GC-skew (−0.35) were negative (Figure 2; Table 1). Among the 13 PCGs, three PCGs used ATT, nine PCGs used ATG, and two PCGs used GTG as their start codon. Four PCGs (Nd2, Co1, Nd5, and Nd6) used AGA as the stop codon, five PCGs (Atp8, Atp6, and Co3) used TAA, and Cytb used TAG.
The A + T contents of the 13 PCGs of D. suweonensis were 56.49–56.51%, the AT-skew values were −0.03, and the GC-skew values were −0.35 (Figure 2; Table 1).
Figure 3 shows the codon usage and relative synonymous codon usage (RSCU) values. The RSCU analysis shows clear differences between D. japonicus and D. flaviventris with D. suweonensis, while the RSCUs of D. flaviventris and D. suweonensis are an exact match. RSCU is often used to distinguish species, so, based on this, D. japonicus can be considered a different species from D. flaviventris and D. suweonensis, while their identical RSCU values suggest that D. flaviventris and D. suweonensis are likely conspecific or extremely closely related.
Nine of 64 codons showed the highest use frequencies, and they were CCU (145–146), CUU (144–145), CCC (124), AAU (118), CAU (111), AUU (108), AUC (105), UAU (105), and CCA (102). However, the GUG (18) and GCG (14) codons were the least used stop codons. Among them, the RSCU value of 34 codons was greater than 1 (1.01–1.74), indicating that these codons were used more frequently.
2.3. rRNA and tRNA Genes of D. flaviventris
In the case of both D. flaviventris mitogenomes, two rRNA genes (12S and 16S rRNA genes) were found to be encoded by the H-strand. The 12S rRNA gene was 934 bp in D. flaviventris, and it was located between the tRNA-Phe and tRNA-Val genes. The length of the 16S rRNA gene in D. flaviventris was found to be 1601 bp, situated between the tRNA-Val and tRNA-Leu2 genes. The A + T content was higher than the G + C content, measuring at 58.8%. The AT-skew was slightly positive, whereas the GC-skew was strongly negative (Table 1).
A total of 22 tRNA genes were identified in D. flaviventris mitogenomes, similar to typical vertebrates. Of these, 14 tRNA genes were located on the H-strand and eight genes were located on the L-strand. All tRNAs, except for tRNA-Ser, had the typical dihydrouridine (DHU) arm. The lack of a DHU arm in tRNA-Ser, as suggested by Ohtsuki et al. (2002) [18], indicates that incomplete tRNA could still fit into the ribosome by adjusting its function and structural conformation.
2.4. Non-Coding Region of D. flaviventris
A putative control (D-loop) region of D. flaviventris with 3195–3196 bp was identified. It was located between the Cytb and the tRNA-Leu1 gene on the H-strand (Figure 1). Its A + T contents of D. flaviventris were 59.98–60.13%. The AT/GC-skews showed that D. flaviventris has a positive AT-skew (0.012–0.018) and also a strongly negative GC-skew (−0.305–−0.300) (Table 1). The three Dryophytes species in the Republic of Korea ranged from 3,189 to 4,103 bp. Among of them, the A + T contents in the D-loop region were as follows: D. suweonensis 60.02–60.11% and D. japonicus 61.69%. AT/GC-skew analysis showed that the D-loop gene of D. suweonensis, like that of D. flaviventris, exhibited a positive AT-skew (0.012–0.016), whereas it was negative in D. japonicus (−0.074).
2.5. Repeat Detection in D. flaviventris
Repeat detection using D2RreadFilter software revealed that repetitive sequences were concentrated exclusively in the D-loop region in both D. flaviventris and D. suweonensis (Figure 4). Peaks near 0.006 indicate repetitive regions, while those near 0 correspond to non-repetitive windows. The threshold (0.0025) effectively distinguished these patterns. The D-loop regionis known to play a crucial role in the regulation of mtDNA replication and transcription [19]. If the level of genetic variation is high, tandem repeats often exhibit a high degree of heterozygosity and a multi-allelic nature [20]. In D. flaviventris and D. suweonensis, tandem repeats were found only in this region (Table 2), with repeat units ranging from 121 to 244 bp, 3.3 to 10.5 copies, and 94–100% matches.
The distribution of microsatellite motif groups in the mitogenomes of D. flaviventris and D. suweonensis showed a predominance of dinucleotide motifs (AC/GT, CA/TG, and CT/AG) across all the samples (Figure 5). Among them, AC/GT and CA/TG were the most abundant. Trinucleotide motifs were less frequent, with TTC/GAA being the most common. Tetranucleotide to hexanucleotide motifs were absent in all the samples. The consistency in motif patterns suggests a conserved microsatellite distribution among these species.
No interspersed repeats were detected by RepeatMasker in any of the samples.
2.6. Synonymous and Nonsynonymous Substitution Rate
The average Ka (nonsynonymous)/Ks (synonymous) ratio for the PCGs was less than 1 (0.007–0.901), indicating purifying selection. Furthermore, no difference was found in the Ka/Ks ratio values between the two species (D = 0, p-value = 1). In the Nd6 gene, the Ka/Ks ratio was greater than 1. Except for Nd6, the remaining PCGs exhibited purifying selection, indicating that they evolved to eliminate deleterious mutations [21]. Notably, in Nd6, the Ka/Ks values were above 1, indicating positive selection, which suggests an evolution toward retaining beneficial mutations. Specifically, Nd6 in both D. flaviventris and D. suweonensis shows the same evolutionary trend. The positive selection on Nd6 in D. flaviventris and D. suweonensis may be associated with adaptation to cold stress. Unlike other frogs, these species survive winters in wetlands, suggesting they may have undergone positive selection to enhance cold tolerance. Studies have shown that the positive selection of mitochondrial genes can occur as an adaptive response to low temperatures [22,23]. Given that the Republic of Korea experiences four distinct seasons, it is possible that specific regions of the PCGs in both species have undergone positive selection to support winter survival.
2.7. Phylogenetic Analysis
The phylogenetic tree based on maximum likelihood (ML) and Bayesian inference (BI) analysis showed that D. flaviventris and D. suweonensis were grouped into a single lineage, with strong support. This single lineage suggests minimal differences in the mitogenome sequences between the two species, indicating that they may be the same species. The genetic distance between them is also very small. Additionally, it was found that Hyla tsinlingensis (KP212702) was misidentified in a previous study and should actually be classified as D. immaculatus. Furthermore, D. suweonensis and D. immaculatus have been identified as synonymous [13].
The phylogenetic tree based on all the PCGs of the complete mitogenomes of all Hyla and Dryophytes species showed that they formed a monophyletic group supported by the highest bootstrap value and Bayesian posterior probability in ML and BI analyses, respectively, with respect to the two outgroup species (Figure 6). They further bifurcated mainly according to the generic taxonomy, except for H. ussuriensis, that emerged among Dryophytes species. Dryophytes species and H. ussuriensis further emerged according to their species taxonomy, except for D. flaviventris and D. suweonensis, that showed the closest relationship to D. immaculatus. The two specimens of D. flaviventris and four specimens of D. suweonensis clustered together, but were phylogenetically not distinguishable.
2.8. Characteristic Analysis of Comparative Genome
The difference in genome size among closely related species reflects their evolutionary processes and is linked to species divergence [18,19]. Intraspecific variations have also been reported and are sometimes associated with environmental conditions, suggesting that genome size is a selective trait related to cell and body size [24]. Therefore, we utilized comparative genomics to identify genetic similarities and differences between D. flaviventris and D. suweonensis. Comparative genomics involves analyzing the mtDNA sequences of organisms to construct phylogenetic trees that depict evolutionary relationships.
Analyses using ddRAD in D. flaviventris have shown differences from D. suweonensis [10], while all evidence indicated that the maternal lineages of the two species were perfectly matched in our study. There are some problems with using ddRAD to select single-nucleotide polymorphisms (SNPs). Since ddRAD only analyzes specific regions of the genome [25,26], it can introduce coverage bias in certain genomic regions [27,28], which may distort the analysis results. Also, identifying their phylogeny, the two species appeared to be very close, but in closely related species, SNPs vary less frequently, which could make it difficult to distinguish true variation from error.
The mitogenome arrangement was found to be the same between D. flaviventris and D. suweonensis. Also, there were no differences in tRNA gene arrangements. When comparing the nucleotide sequences, there were no observed differences in the sequence lengths and/or structures of the genes. AT/GC-skews and phylogenetic trees were found to be not likely to be different between the two species. Generally, mitochondrial sequence differences between them exhibit clear differences in length [29,30,31]. However, their genetic differences in mitogenome size, AT/GC-skews, and phylogenetic trees can be explained through two hypotheses.
First, due to the maternally inherited nature of mitogenomes, the mitochondrial sequences of D. flaviventris and D. suweonensis may have coincidentally aligned due to hybridization. This could be an example of mitochondrial capture, defined as mitogenome introgression, where the mitochondrial genome of one species is replaced by that of another species through selective backcrossing with one of the parent species [32,33]. Therefore, studies using nuclear DNA would be required for the definitive identification of Dryophytes species.
Second, it is possible that D. flaviventris and D. suweonensis are actually synonymous. Genetic similarities in mitochondrial sequences have led to reports of synonymy in other species as well [34]. The mitogenome verification conducted in this study makes the first hypothesis highly unlikely. Several pieces of evidence support the second hypothesis. For instance, the two speices have been reported to exhibit no differences in their calls [35]. The species were previously distinguished based on morphological differences, specifically the fact that the webbing between the second and third toes of D. flaviventris is smaller than that of D. suweonensis [10]. However, this morphological difference is not considered a reliable basis for accurate classification. Therefore, it is believed that the two species are genetically very similar and likely conspecific.
Molecular tools have become essential in conservation-based research [36], providing information on population biology and species-level relationships [37,38]. As a result, molecular systematics plays a crucial role in identifying and conserving endangered species [39,40]. While D. suweonensis is already protected as an endangered species, if D. flaviventris is recognized as a distinct species, its conservation would become urgent due to its narrower distribution range compared to D. suweonensis.
In the future, we will conduct studies on the nuclear DNA of both species to test the first hypothesis of mitogenome congruence due to hybridization and to confirm bi-parental inheritance. Through these analyses, we aim to establish a clearer phylogenetic understanding of tree frogs in the Republic of Korea.
3. Materials and Methods
3.1. Sample Collection and Genomic DNA Extraction
Two D. flaviventris specimens were captured in 2021, one from Wanju-gun, Jeollabuk-do, and the other from Buyeo-gun, Chuncheongnam-do, the Republic of Korea. These two samples were preserved in absolute ethanol and deposited in the archives of the Conservation Genome Resource Bank for Korean Wildlife (CGRB) (http://www.cgrb.org/, accessed on 19 July 2022). Two samples of D. suweonensis were collected from Chungju city and Iksan city in April–May 2022.
A piece of tissue was excised for genomic DNA (gDNA) extraction using an APrep™ gDNA Tissue Kit (APBIO Co., Namyangju, the Republic of Korea) following the manufacturer’s instructions. The qualification of the extracted gDNA was performed using a NanoDrop One Microvolume UV-Vis Spectrophotometer (Thermo Fisher Scientific Inc., Wilmington, DE, USA).
3.2. Primer Design and Long-Range PCR
A total of 47 complete mitogenome sequences belonging to the family Hylidae were retrieved from the GenBank database in the NCBI (https://www.ncbi.nlm.nih.gov/, accessed on 6 February 2023) and aligned with ClustalW in Bioedit v.7.2 [41]. Alignments were visually inspected and confirmed; any ambiguous alignments were manually corrected. Two sets of primers were newly designed in this study, based on the matrix, to amplify the entire mitogenome in overlapping fragments for the four treefrog specimens (Table 3). Each 20 μL long-range PCR for each primer set was amplified with a proofreading and ultrahigh fidelity DNA polymerase was ensured using an Invitrogen™ Platinum™ SuperFi™ PCR kit (Thermo Fisher Scientific Inc.). The amplification was carried out in the ProFlex™ PCR System (Thermo Fisher Scientific Inc.). The reactions were run under the following conditions: one initial cycle at 30 s at 98 °C, followed by 35 cycles of 10 s of denaturing at 98 °C, 10 s of annealing at 60 °C, a 5 min extension at 72 °C, and then finalized by one cycle of 5 min elongation at 72 °C. All the PCR products were visualized on a 1.5% agarose gel to verify amplification success.
3.3. Library Preparation and Sequencing
The successfully amplified PCR products were purified using an AccuPrep^®^ PCR/Gel Purification Kit (Bioneer, Daejeon, the Republic of Korea) and qualified using Quant-iT™ PicoGreen™ dsDNA Assay Kits (Thermo Fisher Scientific, Inc.). PCR amplicons of overlapping fragments (total maximum concentration of 200 ng) of each species were pooled together and prepared for library preparation using Illumina DNA Prep kits (Illumina Inc., San Diego, CA, USA). After quantification using Quant-iT™ PicoGreen™ dsDNA Assay Kits (Thermo Fisher Scientific Inc.), the library products were sequenced with the Illumina iSeq100 System (Illumina) according to the manufacturer’s instructions utilizing an Illumina iSeq™ 100 i1 Reagent v2 kit (Illumina). The sequences were sorted into FASTQ files, and the adaptor and index sequences were removed using the onboard Illumina FASTQ workflow.
3.4. Mitochondrial Genome Assembly
Raw FASTQ files were assessed using FastQC v.0.12.1 [42]. Subsequently, they were imported to Geneious Prime v.2023.2.1 [43] for quality control and assembly. The raw reads were pre-processed by pair-end merging, removing duplicates, discarding reads shorter than 50 bp, and trimming low-quality ends using the BBDuk trimmer at default settings from the BBtools plugin version 38.90 [44] in Geneious Prime version 2021.1.1. The trimmed reads were assembled with the ‘map to reference’ approach in Geneious Prime using a validated mitogenome of D. suweonensis (GenBank accession number KY419887) at default setting. Consensus sequences at the highest 60% identical threshold were manually checked and subjected to variant calling using the ‘Variant/SNP finder’ option at default settings. A table of all the variant annotations was obtained. Only variants which were lower than the maximum variant p-value (0.0001%) and greater than 50% of the variant frequency were selected to be applied to the consensus sequence.
3.5. Mitochondrial Gene Annotation and Codon Usage Analysis
The assembled consensus sequences obtained from the variant calling process were visualized and annotated in Geneious Prime. The identifications of the exact start and stop codons of all the protein-coding genes (PCGs) and the boundaries of two ribosomal RNA (rRNA) genes were carried out after aligning the newly analyzed complete mitochondrial sequences in this study and other sequences of the family Hylidae. Transfer RNA (tRNA) genes were identified by tRNAscan-SE 1.21, employing the vertebrate mitochondrial genetic code [45]. The boundaries of all the genes were inferred by the flanking genes under the assumption that there were neither intergenic spacers nor overlaps, and we then performed repeated ‘map to reference’ operations using Geneious Prime with default settings. The complete mitogenome sequence of D. suweonensis (KY419887) was used as a reference sequence for the four treefrog specimens newly analyzed in this study. The schemes of the circular mitogenome were constructed with the GenomeVx Web Browser, http://wolfe.ucd.ie/GenomeVx/ (accessed on 6 April 2023) [46]. The relative synonymous codon usage (RSCU) was calculated by MEGA X version 10.0 [47]. The four newly sequenced mitogenomes of the Dryophytes species were submitted to GenBank with the accession numbers PQ490412–PQ490415.
3.6. Repeat Sequence Analysis
Repetitive regions within the two Dryophytes species mitogenomes were identified using using D2RReadFilter software (https://github.com/chansigit/D2R_codes, accessed on 4 February 2025) with default parameters [48], and the threshold value was determined using the unsupervised method. Simple sequence repeats (SSRs) were detected using GMATA v.2.3 [49]. Tandem repeats with repeat units >6 bp were identified using Tandem Repeats Finder v.4.09 [50] with default parameters. Interspersed repeats were identified using RepeatMasker v.4.1.7 with default settings [51].
3.7. Synonymous and Nonsynonymous Substitution Rate
The Ka (nonsynonymous)/Ks (synonymous) ratio is an important value for understanding molecular evolutionary dynamics [52]. A Ka/Ks = 1 indicates neutral mutation, Ka/Ks > 1 indicates positive selection, and Ka/Ks < 1 indicates negative (purifying) selection. We used 13 PCGs to obtain Ka/Ks ratios. Their Ka/Ks ratios in D. flaviventris, D. suweonensis, and D. japonicus were calculated using DnaSP v5 [53]. To test the statistical significance of the difference in the Ka/Ks ratio between D. flaviventris and D. suweonensis, the Kolmogorov–Smirnov test was used to calculate the p-value, allowing for direct comparisons [54].
3.8. Phylogenetic Analysis
The concatenated nucleotide matrix of 27 mitogenome sequences of frog species belonging to the family Hylidae retrieved from the GenBank database and those of the four treefrog specimens in this study were aligned and manually refined using the ClustalW version 1.4 multiple alignment function of BioEdit version 5.0.9 with default parameters for constructing a phylogenetic tree. All 13 PCGs from the matrix were extracted and employed in building a maximum likelihood (ML) tree and executing the Bayesian inference (BI) analysis. The GTRGAMMAI model, a general time-reverse (GTR) model incorporating invariant sites and a gamma distribution, was selected as the optimal phylogenetic model by JModelTest v. 2 [55]. The ML analysis was performed with RAxML 7.0.4 using 1000 nonparametric bootstrap inferences [56,57]. For BI analysis, MrBayes v. 3.1.2 was utilized, employing four independent Markov chains with 1,000,000 generations and discarding the initial 25% as burn-in [58]. The resulting tree was visualized using TreeViewX v. 0.5.0 [59]. Two species, Phyllomedusa bahiana (NC_067554) and Pithecopus megacephalus (MG772558), were chosen as outgroups.
4. Conclusions
In this study, we sequenced and characterized the complete mitogenomes of D. flaviventris for the first time, as well as D. suweonensis in the Republic of Korea, revealing small differences (0–7 bp) in their mitogenome sizes. No variations were observed in gene rearrangements or tRNA structures, and both repeat sequence analysis in the D-loop region and RSCU analysis showed no distinct differences. Phylogenetic analysis confirmed that the two tree frog species form a monophyletic group. Despite conducting a detailed mitogenome analysis, we found no genetic differences between the two species, strongly suggesting their conspecificity. To further investigate this hypothesis, we will conduct nuclear DNA studies on both species to test whether their mitogenome congruence is due to hybridization.
The reference list from the paper itself. Each links out to its DOI / PubMed record.
- 1Ladoukakis E.D. Zouros E. Evolution and Inheritance of Animal Mitochondrial DNA: Rules and Exceptions J. Biol. Res.-Thessalon.201724210.1186/s 40709-017-0060-428164041 PMC 5282644 · doi ↗ · pubmed ↗
- 2Brown W.M. George M. Wilson A.C. Rapid Evolution of Animal Mitochondrial DNA Proc. Natl. Acad. Sci. USA 1979761967197110.1073/pnas.76.4.1967109836 PMC 383514 · doi ↗ · pubmed ↗
- 3Mueller R.L. Macey J.R. Jaekel M. Wake D.B. Boore J.L. Morphological Homoplasy, Life History Evolution, and Historical Biogeography of Plethodontid Salamanders Inferred from Complete Mitochondrial Genomes Proc. Natl. Acad. Sci. USA 2004101138201382510.1073/pnas.040578510115365171 PMC 518840 · doi ↗ · pubmed ↗
- 4Boore J.L. Animal Mitochondrial Genomes Nucleic Acids Res.1999271767178010.1093/nar/27.8.176710101183 PMC 148383 · doi ↗ · pubmed ↗
- 5Boore J. Brown W. Big Trees from Little Genomes: Mitochondrial Gene Order as a Phylogenetic Tool Curr. Opin. Genet. Dev.1999866867410.1016/S 0959-437X(98)80035-X 9914213 · doi ↗ · pubmed ↗
- 6Evans B.J. Carter T.F. Greenbaum E. Gvoždík V. Kelley D.B. Mc Laughlin P.J. Pauwels O.S.G. Portik D.M. Stanley E.L. Tinsley R.C. Genetics, Morphology, Advertisement Calls, and Historical Records Distinguish Six New Polyploid Species of African Clawed frog (Xenopus, Pipidae) from West and Central Africa P Lo S ONE 201510 e 014282310.1371/journal.pone.014282326672747 PMC 4682732 · doi ↗ · pubmed ↗
- 7Glaw F. Köhler J. De la Riva I. Vieites D. Vences M. Integrative Taxonomy of Malagasy Treefrogs: Combination of Molecular Genetics, Bioacoustics and Comparative Morphology Reveals Twelve Additional Species of Boophis Zootaxa 2010238318210.11646/zootaxa.2383.1.1 · doi ↗
- 8Zhang P. Liang D. Mao R.-L. Hillis D.M. Wake D.B. Cannatella D.C. Efficient Sequencing of Anuran mt DN As and a Mitogenomic Exploration of the Phylogeny and Evolution of Frogs Mol. Biol. Evol.2013301899191510.1093/molbev/mst 09123666244 · doi ↗ · pubmed ↗