Statistical Characteristics of Strong Earthquake Sequence in Northeastern Tibetan Plateau
Ying Wang, Rui Wang, Peng Han, Tao Zhao, Miao Miao, Lina Su, Zhaodi Jin, Jiancang Zhuang

TL;DR
This study analyzes earthquake patterns in northeastern Tibet to better understand seismic risk and challenges in predicting earthquakes using statistical methods.
Contribution
The study introduces the use of BEPIT to supplement incomplete earthquake catalogs in a seismically active but data-limited region.
Findings
Low b values indicate high regional stress levels in northeastern Tibet.
Aftershocks decay quickly, as shown by high p-parameters in the ETAS model.
Mainshocks are mostly background events, not foreshock-driven.
Abstract
As the forefront of inland extension on the Indian plate, the northeastern Tibetan Plateau, marked by low strain rates and high stress levels, is one of the regions with the highest seismic risk. Analyzing seismicity through statistical methods holds significant scientific value for understanding tectonic conditions and assessing earthquake risk. However, seismic monitoring capacity in this region remains limited, and earthquake frequency is low, complicating efforts to improve earthquake catalogs through enhanced identification and localization techniques. Bi-scale empirical probability integral transformation (BEPIT), a statistical method, can address these data gaps by supplementing missing events shortly after moderate to large earthquakes, resulting in a more reliable statistical data set. In this study, we analyzed six earthquake sequences with magnitudes of MS ≥ 6.0 that occurred…
Genes, proteins, chemicals, diseases, species, mutations and cell lines named across the full text — each resolved to its canonical identifier and authoritative record.
Click any figure to enlarge with its caption.
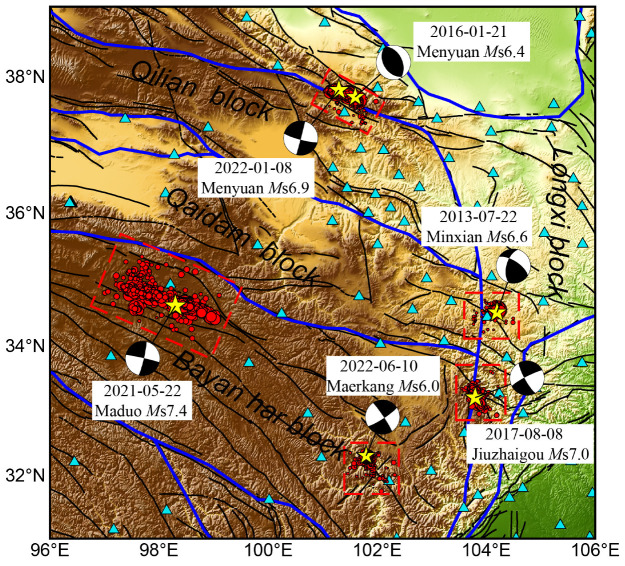 Figure 1
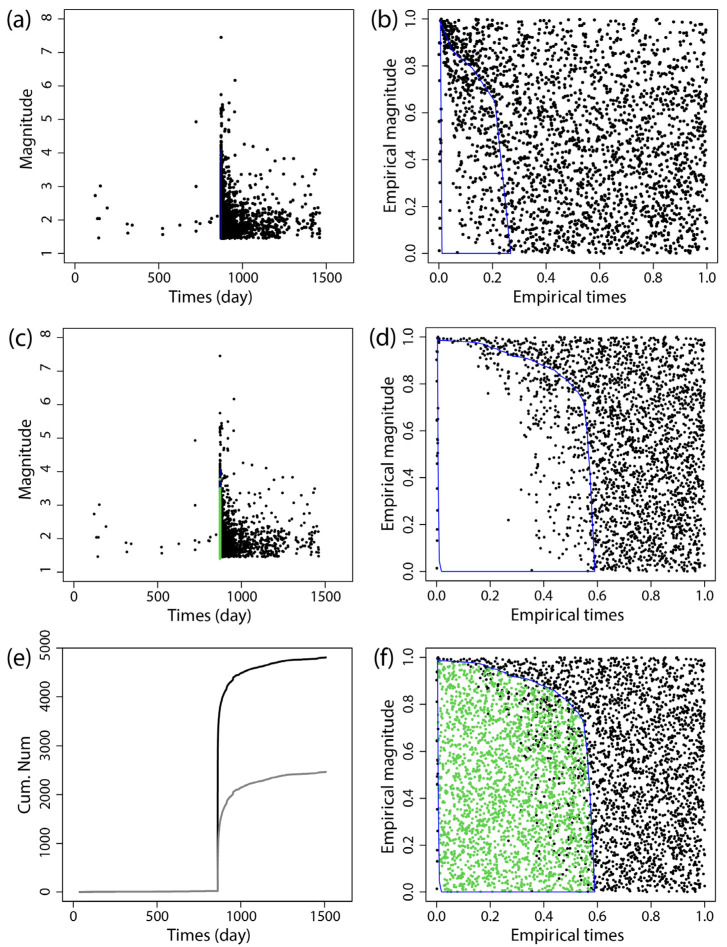 Figure 2
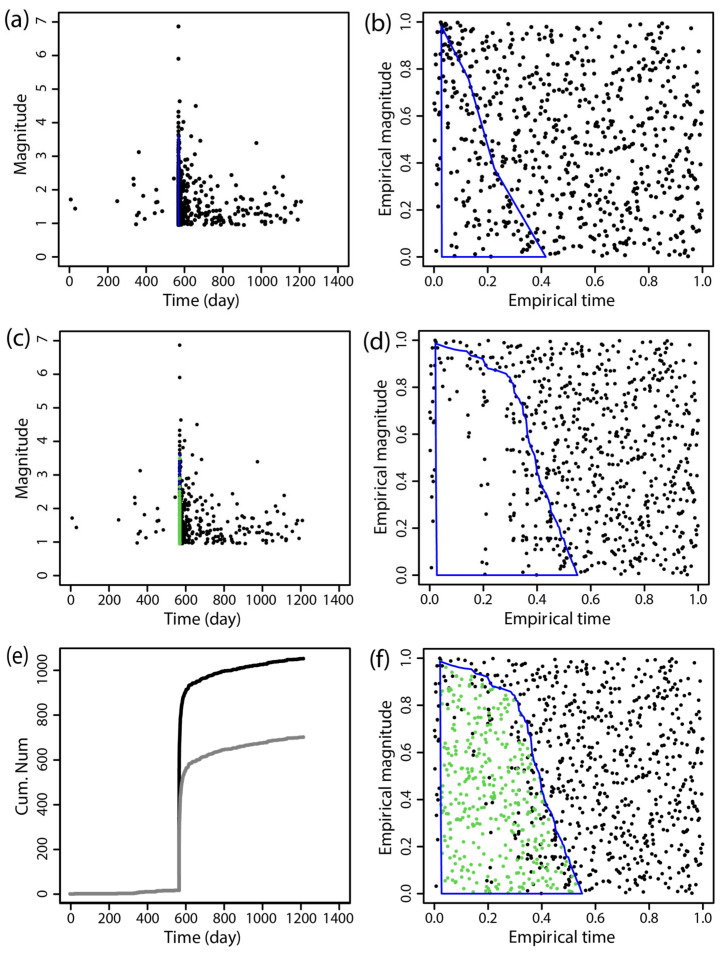 Figure 3
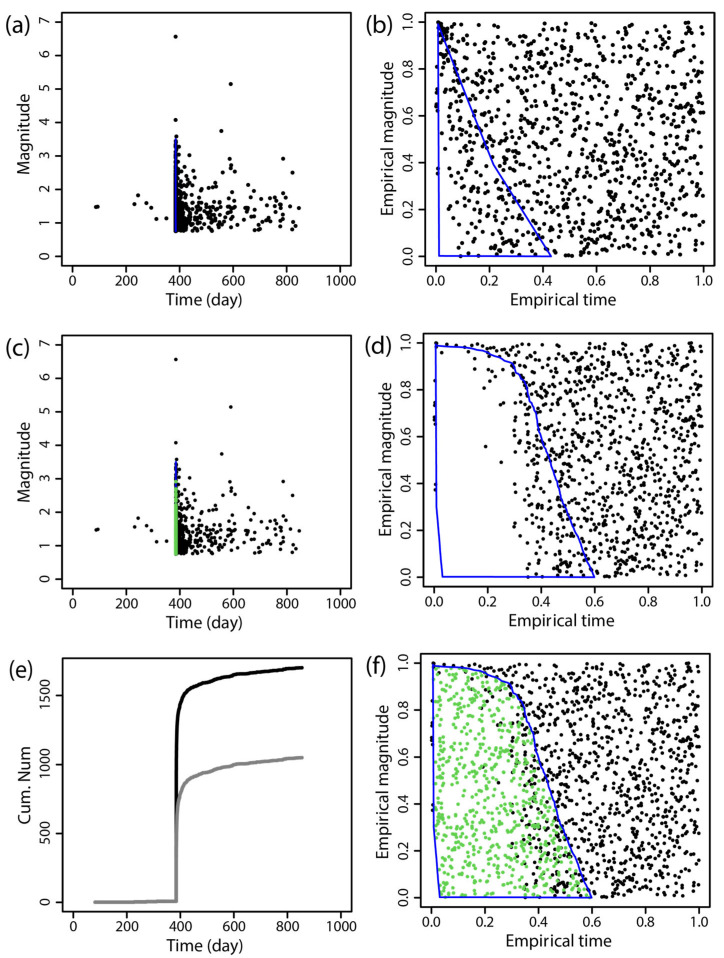 Figure 4
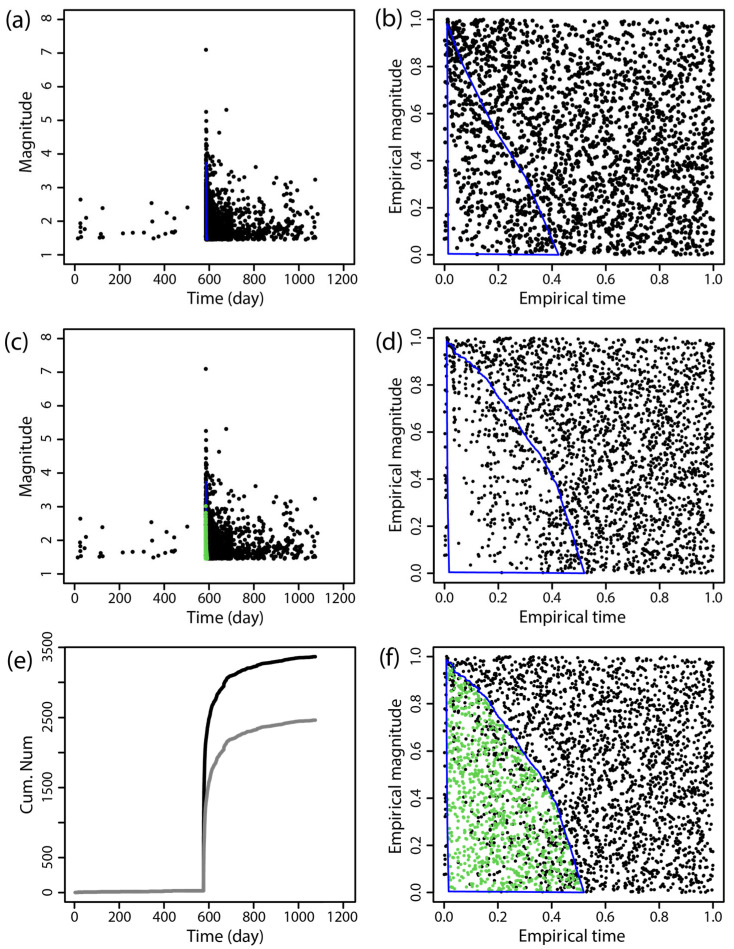 Figure 5
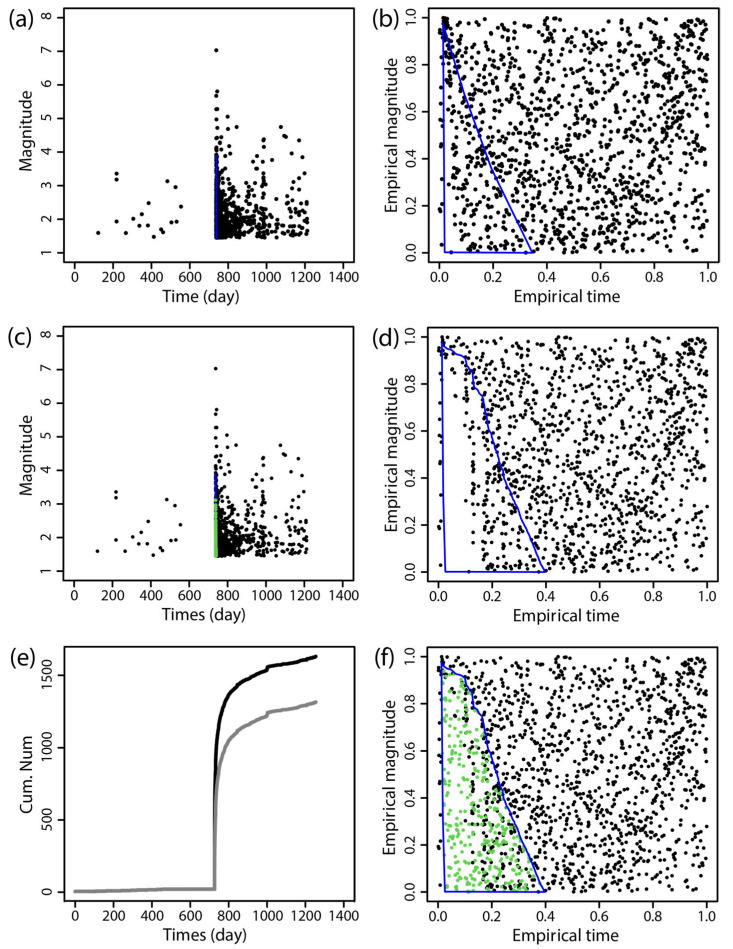 Figure 6
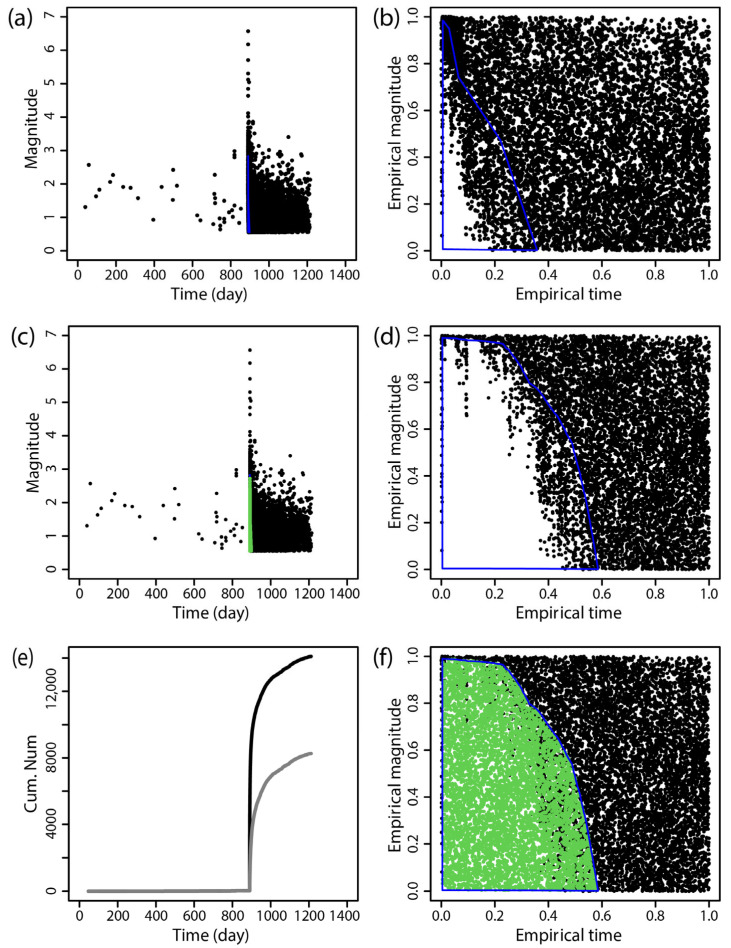 Figure 7
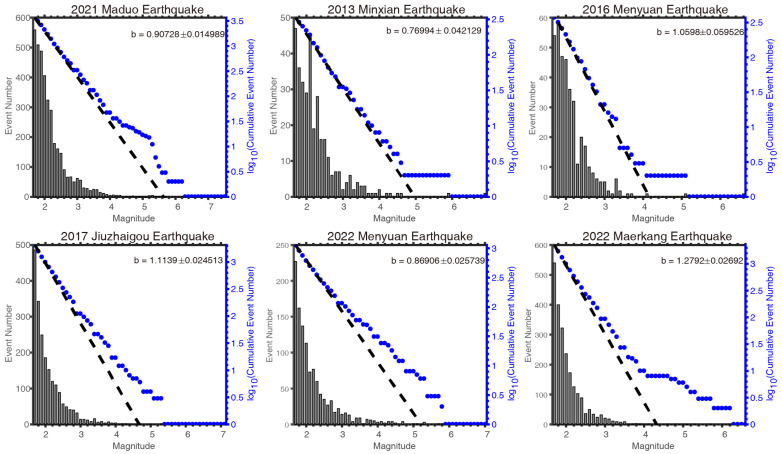 Figure 8
- —National Key R&D Program of China
- —the Special Fund of the Institute of Geophysics, China Earthquake Administration
- —the National Natural Science Foundation of China
- —the Earthquake Science and Technology Spark Program
Peer Reviews
No public reviews on file for this paper yet. If you reviewed it on a platform where reviews are public (OpenReview, ICLR, NeurIPS, ICML), you can paste yours below so the community can read it here.
Videos
No videos yet. Explain this paper in a talk, walkthrough, or lecture? Add one.
Taxonomy
Topicsearthquake and tectonic studies · Earthquake Detection and Analysis · Seismology and Earthquake Studies
1. Introduction
Earthquakes are among the most devastating natural disasters worldwide. The largest and most destructive seismic events typically occur at plate boundaries. Notable examples include the 1960 M_W_9.5 Valdivia earthquake in Chile, the 2010 M_W_8.8 Maule earthquake in Chile, the 2011 M_W_9.0 Tohoku earthquake in Japan, and the 2007 M_W_8.5 Sumatra earthquake, among others [1,2,3,4,5]. However, accurate earthquake prediction remains an unsolved challenge. To advance this field, many researchers have concentrated on seismically active regions, including Sichuan-Yunnan in China, Japan, California in the United States, and New Zealand, and conducted extensive observations. Utilizing a wealth of data from these regions, researchers have developed various statistical and physical methods to identify patterns of seismic activity, which has led to improvements in prediction efficiency. Examples of such methods include the b value, the Epidemic-Type Aftershock Sequence (ETAS) model, as well as methods for earthquake identification and localization [6,7,8,9,10,11,12]. However, these methods are not applicable in certain regions, making earthquake prediction in these areas particularly challenging.
The Tibetan Plateau is a region of particular geological significance, characterized by its highly complex geological structure. The northeastern section of the plateau represents the frontal region, extending into the mainland [13,14]. Due to the extension of the plateau, stress continuously accumulates; however, the strain rate is approximately 2 mm/year [15], significantly lower than that observed in subduction zones, and the earthquake frequency is relatively low [16]. This discrepancy results in a high level of stress within the region. The high stress levels combined with the complex geological conditions make this region one of the areas with the highest earthquake hazard, contributing to its complex seismicity. Historically, the region has experienced numerous large earthquakes, one of the most notable being the 1920 M8^1^/2 Haiyuan earthquake, renowned as one of the most destructive events in seismic history. In recent years, significant seismic events have occurred, including the M_S_7.4 earthquake in Maduo in 2021; the M_S_6.9 earthquake in Menyuan, Qinghai Province, in 2022; and the Maerkang M_S_6.0 earthquake swarm in Sichuan Province in 2022. These events suggest increased seismic activity in the northwestern part of the Qinghai–Tibet Plateau, highlighting the region’s substantial earthquake hazard and drawing considerable attention from seismologists. A clear understanding of seismicity characteristics in this area is essential for effective earthquake prevention and disaster response efforts. With the comprehensive upgrade of the seismic network since 2009, earthquake monitoring capabilities have significantly improved, providing an invaluable opportunity to investigate seismicity characteristics through statistical approaches.
The ETAS model is a widely used tool for simulating the temporal evolution of seismicity rates. As one of the most realistic time series models, the ETAS model has been employed by researchers to analyze earthquake sequences across different regions, yielding insights into the characteristics of seismic activity. In China, some scholars [17,18] have utilized the ETAS model to investigate the distribution characteristics of earthquake sequence parameters. As a method based on statistics, the ETAS model relies heavily on earthquake catalogs as its data source. However, the effectiveness of earthquake monitoring can decline significantly following a major earthquake, both within the affected area and potentially in surrounding regions, due to the difficulty of detecting smaller earthquakes amidst the occurrence of numerous moderate to large earthquakes [19,20]. Consequently, a significant amount of post-earthquake data remain unrecorded, resulting in an increase in the number of incomplete magnitude readings. This scarcity can severely undermine the accuracy and stability of parameters fitting within the ETAS model. One relatively straightforward approach to mitigate this issue is to select a higher threshold magnitude; however, a low number of recorded earthquakes can also lead to unstable results [21,22]. Alternative methods aim to address catalog completeness. The template matching technique and other earthquake recognition methods are frequently employed to identify smaller earthquakes, but they require an extensive earthquake observation system [23,24,25,26,27]. The complex terrain of the northeastern Tibetan Plateau complicates the establishment of a dense seismic network, making the application of template matching in this region challenging. The bi-scale empirical probability integral transformation (BEPIT) method proposed by Zhuang et al. [28,29] can be applied to seismic sequences with sparse seismic stations and weak early monitoring ability based on the statistical law of aftershock attenuation. This method has been proven to help estimate stable attenuation parameters and obtain parameter information of early post-earthquake aftershock sequences [30,31]. Consequently, this method is employed in the present investigation to replenish the catalog of earthquake events immediately following the main shock.
In this study, we investigate the statistical characteristics of strong earthquake sequences (MS ≥ 6.0) in the northeastern Tibetan Plateau since 2009. Prior to analysis, we apply a seismic event replenishment technique based on statistical seismology to address the low seismicity rate and the incompleteness of the earthquake catalog following major earthquakes. Our analysis focuses on the seismic sequence parameters of these events, utilizing the ETAS model and the b value to elucidate the characteristics of seismicity in the region. Subsequently, we discuss the implications and potential applications of these findings in earthquake forecasting. This study seeks to contribute meaningful insights toward improving earthquake forecasting in the northeastern Tibetan Plateau.
2. Materials and Methods
2.1. Study Area and Data Selection
Six earthquake sequences with MS ≥ 6.0 have occurred on the northeastern Tibetan Plateau since 2009 and were selected for investigation. In the study region, seismic station coverage is sparse; as shown in Figure 1, there are four or fewer seismic stations within 100 km of each mainshock epicenter. Figure 1 displays the locations of these seismic events, which include the following: the 2013 M_S_6.6 earthquake sequence in Minxian, Gansu Province; the 2016 M_S_6.4 earthquake sequence in Menyuan, Qinghai Province; the 2017 M_S_7.0 earthquake sequence in Jiuzhaigou, Sichuan Province; the 2021 M_S_7.4 earthquake sequence in Maduo, Qinghai Province; the 2022 M_S_6.9 earthquake sequence in Menyuan, Qinghai Province; and the 2022 M_S_6.0 earthquake cluster in Maerkang, Sichuan Province. The earthquake data utilized in this study were obtained from the China Earthquake Networks Center (CENC). Only events with ML ≥ 0.0 are included in the data set. In selecting earthquake sequences, priority is given to intensive aftershock areas that develop within one month following each main event. The data retained for analysis also include the period preceding the main earthquake, enabling an examination of background seismic activity based on the level of seismicity and magnitude of the main event within the selected region.
Complete seismic samples are the basis of reliable results. The complete magnitude of completeness (MC) is the smallest magnitude at which an earthquake can be completely monitored. It is an index to evaluate the quality of an earthquake catalog. In this study, the maximum curvature (MAXC) method is applied to estimate the temporal MC of the sequence catalog [32]. This approach aids in estimating a new empirical distribution function based on fully recorded seismic data. However, previous studies indicate that the complete magnitude calculated by the MAXC method tends to be relatively low [33]. Therefore, in this study, we adjusted the MAXC result by adding 0.2 to define the complete magnitude. Using a moving time window, we conducted a temporal MC. The higher MC before and after the main shock are set to be the thresholds of magnitude for replenishing to ensure the completeness of the earthquake catalog for most of the time except for immediately after the mainshock. The MC after supplementing is shown in Table 1.
2.2. Seismic Event Supplement Technique Based on Statistical Seismology
Randomly occurring seismic events are commonly regarded as marking point processes [34,35,36,37]. Based on this framework, Zhuang et al. [28,29] proposed a novel algorithm, the BEPIT, employing a two-scale transformation technique. This algorithm was designed to supplement missing seismic events in incomplete records.
Suppose is a temporal marked point process in a time–magnitude domain , where M is the space of marks. Using the following BEPIT, the empirical distribution function of time and magnitude is defined:
where I is a logical function. It is defined as I(x) = 1 if x is true or as I(x) = 0 if x is false.
BEPIT is used to convert the non-uniform mode generated by the actual point process into a uniform mode, and then the missing aftershock events are filled in. The method comprises the following five main steps (for a detailed description of the method, see Zhuang et al. [28,29]):
Step 1. Seismic events are transformed to a [0, 1] × [0, 1] range using the BEPIT point processing technique, and the approximate time–magnitude range is established for missing events, S.
Step 2. Based on the seismic events within the time–magnitude range that should be fully observed, a new empirical distribution function is obtained by searching for the uniform distribution of events through an iterative process and adjusting the missing event region, S.
Step 3. Based on the empirical distribution function of the previous step, independent and uniformly distributed events are generated in the missing event region.
Step 4. Since the missing region will also contain some real seismic events, the supplementary data set needs to be adjusted. Duplicate events in the synthetic data set can be avoided by deleting the most recent supplementary data point for each real event.
Step 5. By means of linear interpolation, the magnitude of each supplementary event is assigned based on the observed relationship between magnitude and time.
2.3. ETAS Model
Ogata [38] extended the Omori–Utsu law by applying the Hawkes point process, positing that aftershocks exhibit self-similarity and that each earthquake has the potential to generate aftershocks. This leads to a cascading series of direct and indirect aftershocks following a main event. He introduced the ETAS model, characterized by a branching point process structure.
The intensity function of the seismic series in the subsequent observation period [0, T] with parameters [μ, A, c, α, p] can be expressed as follows [34,38]:
where t represents the elapsed time after the initial zero time. Mi and ti refer to the magnitude and onset time of the ith event, respectively. M0 is the reference magnitude, which is usually taken as the cutoff magnitude that is equal to or greater than the complete magnitude MC. The background seismicity rate is denoted by μ and is caused by the loading of regional stress, but it is usually negligible when compared to the aftershock sequence. The p value indicates how quickly the sequence decays; the larger this value is, the faster the decay, and vice versa. The length of time during which the frequency of aftershocks reaches its peak after the main earthquake is represented by c. A represents the average number of earthquakes triggered by an earthquake of magnitude MC. α indicates the ability to trigger aftershocks. When it comes to swarm-type sequences, α is generally less than 1; if there is no obvious stimulated aftershock in the earthquake sequence, α is generally greater than 1 [39].
The ETAS model parameters are estimated using the maximum likelihood method, with the likelihood function L taking the form in [S, T] in the fitting time range.
We perform the maximum likelihood estimation of parameters [μ, A, c, α, p] by bringing Equation (3) into Equation (4) and maximizing Equation (4).
2.4. b Value
The Gutenberg–Richter (G-R) law indicates the frequency–magnitude distribution of earthquakes [40,41] as follows:
where N is the number of earthquakes with a magnitude greater than or equal to M, a is the earthquake productivity, and b is the slope indicating the relative proportion of large and small earthquakes. Research has demonstrated that the b value is inversely related to the underground stress level [42,43,44,45,46,47]. As such, the b value serves as an indicator of geological structure and stress conditions and is widely used in earthquake forecasting and related research [10,48,49].
3. Results
Supplemental Data on Missing Earthquakes
To address the shortage of short-term aftershock data following an earthquake, we employed the BEPIT method. Using a moving time window, we conducted a temporal Mc analysis for each of the six sequences, and the maximum Mc values are summarized; the resulting MC values are shown in Table 1. In the immediate aftermath of the main earthquake, some aftershock signals were obscured by large-amplitude tail waves [50,51], leading to a temporary increase in MC. As monitoring capabilities in the aftershock region gradually improved, MC began to decrease. However, with the reduction in mobile observation stations, MC gradually increased again, eventually stabilizing at levels similar to those observed prior to the main event.
The BEPIT method was applied to supplement missing earthquake data immediately following the main shock. Figure 2, Figure 3, Figure 4, Figure 5, Figure 6 and Figure 7 illustrate the results of this supplementation for the early aftershock data of six sequences. The findings show a significant increase in the number of recorded seismic events shortly after the main earthquake, highlighting the effectiveness of this supplementation technique. The enhanced seismic catalog provides a more comprehensive primary data set for subsequent research, enabling the derivation of more stable parameters.
The ETAS model parameters for the six seismic sequences are estimated using maximum likelihood estimation based on a relatively complete catalog. To facilitate comparison and analysis across the six sequences, a unified MC = M_L_1.7 is selected for calculation. Table 2 presents the estimated model parameters. Additionally, the maximum likelihood method is employed to estimate the b values of each seismic sequence (Figure 8).
An analysis of six earthquake sequences in the northeastern Tibetan Plateau revealed that although these sequences occur within the same tectonic region and share some general characteristics, they also display distinct parameter differences. As shown in Table 2, the μ values for all six sequences are low, indicating generally low seismic activity in these areas, with few earthquakes occurring before the main shock, particularly in sequences 2, 4, 5, and 6. Observational records confirm that no significant earthquakes occurred near the epicenters in the months preceding the 2013 Minxian M_S_6.6, 2017 Jiuzhaigou M_S_7.0, 2022 Menyuan M_S_6.9, and 2022 Maerkang M_S_6.0 earthquakes, making it challenging to assess earthquake hazards through foreshock activity. Sequence 3, however, has a relatively higher μ value, suggesting that background seismic activity in this region was higher than in the other sequences.
Parameters A and α collectively reflect aftershock productivity [52,53]. Specifically, parameter A represents the number of aftershocks triggered by an earthquake of magnitude MC, while parameter α indicates the relationship between an earthquake’s magnitude and its potential to generate aftershocks [7,54]. A high α suggests that a significant portion of aftershocks are triggered by larger earthquakes, primarily the mainshock. In sequences 2, 3, and 5, the high α value indicates a lower proportion of high-order aftershocks, with most aftershocks primarily being triggered by the mainshock.
The statistical decay of aftershocks is governed by parameters c and p. Sequence 5 exhibits the smallest c value, indicating a shorter time for the aftershock frequency to peak. A larger p value suggests a faster decay rate. Utzu et al. [55], in their analysis of over 200 global seismic sequences, reported an average p of 1.1. In the six sequences presented in Table 2, sequences 1–4 display a p value exceeding this average, suggesting that aftershocks decay rapidly following large earthquakes, potentially reducing the relative damage from aftershock sequences. The b value reveals that aside from sequence 6, overall, the b values are lower, reflecting regional seismic statistical characteristics and indicating high stress levels in the northeastern Tibetan Plateau [56,57,58].
4. Discussion
4.1. ETAS Parameter
The effect of different cutoff magnitudes on seismic sequence parameters is analyzed using the 2017 Jiuzhaigou M_S_7.0 earthquake sequence as a case study, and the results are presented in Table 3. By varying the cutoff magnitudes to ML 1.7, 1.8, and 1.9, parameters μ, A, and c gradually decrease while α increases, and p remains largely unchanged. These results align with the typical parameter variation characteristics of the ETAS model, indicating that the supplementary catalog is relatively stable. Furthermore, the b value decreases slightly as the cutoff value increases, remaining within the margin of error, which suggests the stability of b and the suitability of the chosen cutoff magnitudes. Therefore, when examining seismic sequence parameters, the selection of the cutoff magnitude should be carefully considered.
Among the six seismic sequences analyzed in this study, five are mainshock–aftershock types, with sequence 6 exhibiting a swarm-type clustering pattern. As shown in Table 2, the ETAS model parameters vary significantly across these sequence types. The swarm-type sequence (sequence 6) demonstrates a higher b value, lower α value, and reduced c value and p value compared to the five mainshock–aftershock sequences. These parameter differences suggest that swarm sequences may feature relatively frequent aftershocks, slower attenuation rates post-event, and a heightened capacity to trigger second-order aftershocks. After a major earthquake, determining the sequence type is essential for assessing post-earthquake trends. The parameter characteristics observed here provide valuable insights for post-earthquake sequence classification and trend assessment.
The six seismic sequences examined in this study are situated on the Tibetan Plateau and represent continental intraplate earthquakes. Compared with subduction zone earthquakes, such as those in Japan, these intraplate sequences exhibit higher p and lower c values [7,59,60]. Consequently, the p and c values can also serve as indicators of tectonic environments.
4.2. Implication on Earthquake Forecasting
To investigate this further, we analyzed the probability of each mainshock being a background event [36], and the findings are presented in Table 2. With the exception of the 2022 M_s_6.0 Maerkang earthquake, most of the primary earthquakes exhibit a high probability of being background events, indicating limited foreshock activity and suggesting that these main events were not foreshock-triggered. Indeed, none of these significant earthquakes were preceded by foreshocks. Furthermore, due to the sparse earthquake activity before the main events, it is challenging to observe the long-term decline in the b value that has been observed before some major earthquakes, such as the Wenchuan earthquake, the Tohoku earthquake in Japan, and the Sumatra earthquake [48,49,61,62]. This scarcity of pre-event seismicity complicates earthquake risk assessment based solely on precursor activity.
Due to the low incidence of background earthquakes in the northeastern Tibetan Plateau, seismicity-based prediction methods are challenging to apply in this area. In addition to statistical seismicity modeling, other effective earthquake prediction approaches rely on non-seismic precursors. Currently, geomagnetic field variations and underground fluid anomalies serve as relatively mature earthquake precursors in this region. Approximately six months prior to the 2022 Menyuan M_S_6.9 earthquake, eight underground fluid anomalies were observed, primarily within a 200 km radius of the epicenter [63]. Approximately two months before the Menyuan MS 6.9 earthquake, anomalously high geomagnetic polarization values exceeding the threshold were detected [64]. These geomagnetic observations, combined with recorded underground fluid anomalies, facilitated a successful prediction of the event [65]. Thus, earthquake forecasting in the northeastern Tibetan Plateau might be enhanced by integrating precursor-based approaches [66,67,68]. In addition to advancing seismic network capabilities, establishing dedicated precursor observation stations should be prioritized to improve predictive accuracy in this region.
The probability of the mainshock in the 2022 M_s_6.0 Maerkang earthquake sequence being a background event is nearly zero, indicating that it was triggered by preceding foreshock activity. Consistent with previous findings, this sequence exhibited a concentration of foreshocks across multiple faults prior to the mainshock, likely attributable to the region’s complex seismogenic environment. The M_s_6.0 Maerkang earthquake, the largest event in this swarm, was preceded by an M_s_5.8 foreshock and was followed by an M_s_5.2 event, resulting in three earthquakes being above M_s_5.0. This earthquake swarm occurred at the intersection of the Songgang and Longriba faults within the Bayan Har block, an area characterized by a complex epicentral structure. Studies on the precise location of the sequences suggest that the Maerkang swarm is influenced by multiple parallel and small-scale conjugate faults in proximity to the epicenter [69,70,71]. These three M_s_5.0+ earthquakes took place on distinct fault sections, forming a swarm driven by multi-fault planes [72]. Compared to single-fault systems, such complex, multi-fault structures can yield more intricate earthquake sequences. Thus, in regions with similarly complex fault systems, the possibility of subsequent moderate to large earthquakes following an initial significant event should be anticipated.
4.3. Constraints and Challenges
As this research progressed, constraints in the application of certain methods also became apparent. One notable limitation pertains to the Gutenberg–Richter (G-R) law. Beyond the requirement that earthquakes used for a b value analysis must have magnitudes equal to or greater than the completeness magnitude, the G-R law may not hold for large-magnitude earthquakes, as illustrated in Figure 8. To address this issue, some studies have introduced derivative forms of the G-R law based on statistical methods, but their practical application remains limited [73]. From the perspective of physical properties, the statistical analysis of seismic energy has been shown to yield more accurate fits and robust results [74,75].
Another limitation involves the determination of the missing event range in the BEPTI algorithm. In Step 2 of BEPTI, the time–magnitude range for missing events, SS, must be manually estimated. This range should encompass the entire region where earthquakes are missing and extend beyond it. However, the manual estimation of this range introduces subjectivity, which may affect the results, as discussed by Zhuang et al. [29]. While it has been suggested that the selection of this range is not highly sensitive to the final outcomes, the development of an algorithm for the objective determination of missing earthquakes is necessary to improve the method’s reliability and objectivity.
5. Conclusions
This study examined six MS ≥ 6.0 earthquake sequences that have occurred in the northeastern Tibetan Plateau since 2009. Using the BEPIT method, missing earthquakes from the short-term period following major events were supplemented, resulting in a more comprehensive seismic sequence catalog. The findings confirm that BEPIT is a highly efficient method suitable for supplementing any earthquake sequence initially affected by limited early monitoring, facilitating the assessment of missing data impacts and the correction of related biases. A subsequent analysis of the ETAS model parameters for these six sequences yielded the following conclusions.
The μ values for the six seismic sequences in the northeastern Tibetan Plateau are uniformly low, suggesting a generally low background seismicity rate with few foreshocks preceding major earthquakes. This underscores the challenges in forecasting earthquakes in this region solely through seismic activity analysis and foreshock observations, providing critical insights for the strategic planning of earthquake prediction efforts. The findings of this research provide valuable reference points for designing seismic monitoring strategies prior to large earthquakes and for analyzing changes in regional seismic sequence parameters. Additionally, they can contribute to improving the scientific accuracy of early assessments of post-earthquake trends.
The parameters of the six earthquake sequences in the northeastern Qinghai–Tibet Plateau examined in this study differ from those observed in previous earthquake cases within mainland China and subduction zones [59,60,76]. These differences arise from variations in regional stress conditions, seismogenic structures, and crustal medium properties.
It is important to note that the study area experienced a limited number of strong earthquakes after the upgrade of the seismic network, resulting in the selection of only six earthquake sequences for analysis. Consequently, the findings of this study may capture only a subset of statistical characteristics. Further research incorporating a larger set of earthquake cases is needed for a more comprehensive and in-depth analysis.
The reference list from the paper itself. Each links out to its DOI / PubMed record.
- 1Chapron E. Ariztegui D. Mulsow S. Villarosa G. Pino M. Outes V. JuvigniéE. Crivelli E. Impact of the 1960 major subduction earthquake in northern patagonia (Chile, Argentina)Quat. Int.2006158587110.1016/j.quaint.2006.05.017 · doi ↗
- 2Elnashai A.S. Gencturk B. Kwon O.S. Hashash Y.M.A. Kim S.J. Jeong S.H. Dukes J. The maule (Chile) earthquake of february 27, 2010: Development of hazard, site specific ground motions and back-analysis of structures Soil Dyn. Earthq. Eng.20124222924510.1016/j.soildyn.2012.06.010 · doi ↗
- 3Marsan D. Enescu B. Modeling the foreshock sequence prior to the 2011, MW 9.0 Tohoku, Japan, earthquake J. Geophys. Res. Solid Earth 2012117 B 0631610.1029/2011 JB 009039 · doi ↗
- 4Muda L.A. Akinori H. Toshinori S. Analysis of afterslip distribution following the 2007 september 12 southern sumatra earthquake using poroelastic and viscoelastic media Geophys. J. Int.2013192183710.1093/gji/ggs 020 · doi ↗
- 5Tsang L.L.H. Hill E.M. Barbot S. Qiu Q. Feng L. Hermawan I. Banerjee P. Natawidjaja D.H. Afterslip following the 2007 MW 8.4 Bengkulu earthquake in Sumatra loaded the 2010 MW 7.8 Mentawai tsunami earthquake rupture zone J. Geophys. Res. Solid Earth 20161219034904910.1002/2016 JB 013432 · doi ↗
- 6LenglinéO. Enescu B. Peng Z. Shiomi K. Decay and expansion of the early aftershock activity following the 2011, MW 9.0 Tohoku earthquake Geophys. Res. Lett.201239 L 1830910.1029/2012 GL 052797 · doi ↗
- 7Harte D.S. Bias in fitting the ETAS model: A case study based on New Zealand seismicity Geophys. J. Int.201319239041210.1093/gji/ggs 026 · doi ↗
- 8Ross Z.E. Trugman D.T. Hauksson E. Shearer P.M. Searching for hidden earthquakes in southern California Science 201936476777110.1126/science.aaw 688831000593 · doi ↗ · pubmed ↗