Global Sensitivity Analysis of a Novel Signaling Network for Heart Growth With Local IGF1 Production
Christian Bilas, Claus Kratzer, Arne Hinrichs, Andreas Maier, Stephen Wildhirt, Eckhard Wolf, Michael W. Gee

TL;DR
The study identifies key factors influencing heart growth through a sensitivity analysis of a signaling network, emphasizing the role of locally produced IGF1.
Contribution
The novel incorporation of local IGF1 production in response to mechanical stretch significantly improves heart growth modeling.
Findings
Local IGF1 production significantly increases the influence of mechanical stretch on heart growth.
Norepinephrine (NE), angiotensin II (AngII), and globally produced IGF1 (g-IGF1) are key influential factors.
Global sensitivity analysis reveals the importance of integrating local IGF1 in heart growth signaling networks.
Abstract
Signaling networks can be used to describe the dynamic interplay of hormonal and mechanical factors that regulate heart growth. However, a qualitative analysis of signaling networks is often difficult due to their complexity and nonlinear behavior. In this work, a global sensitivity analysis of signaling networks is conducted to determine the most influential factors for heart growth over a range of model inputs. Furthermore, the local production of the hormone insulin‐like growth factor 1 (IGF1) in response to high mechanical stretches as recently described by Zaman et al.(Immunity, 54, 2057) and Wong et al.(Immunity, 54, 2072) is incorporated. The computational results show that this increases the influence of mechanical stretch on heart growth significantly. Further key influential factors are the hormones norepinephrine (NE), angiotensin II (AngII), and globally produced IGF1…
Genes, proteins, chemicals, diseases, species, mutations and cell lines named across the full text — each resolved to its canonical identifier and authoritative record.
Click any figure to enlarge with its caption.
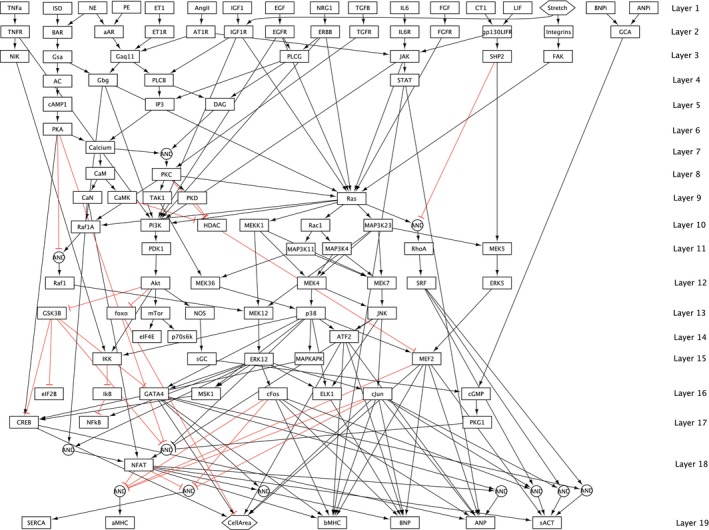 FIGURE 1
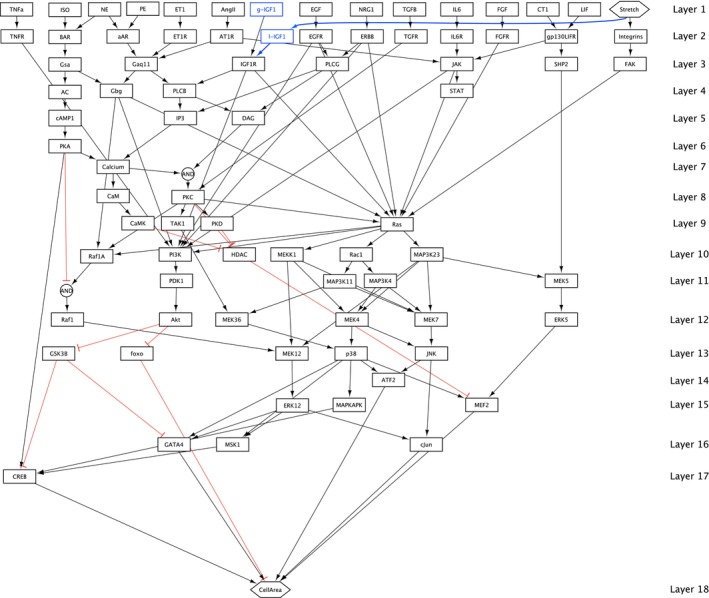 FIGURE 2
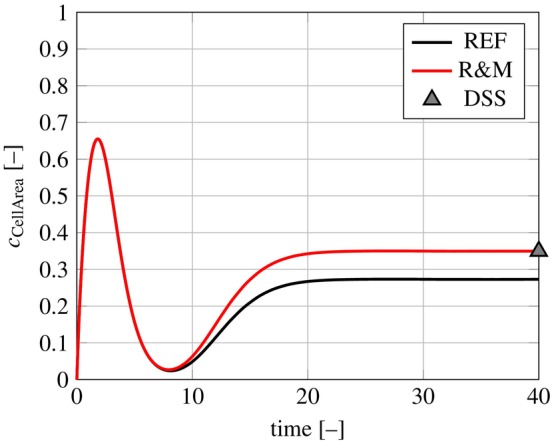 FIGURE 3
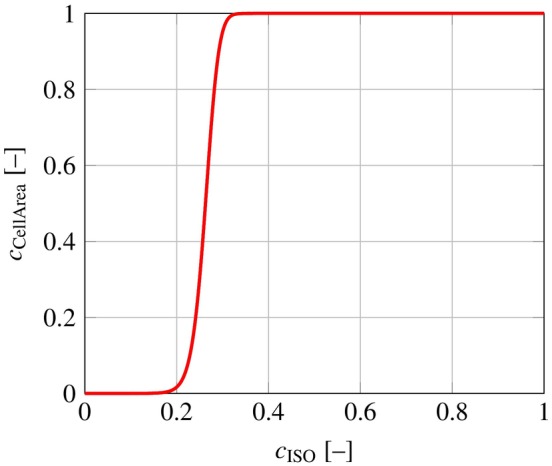 FIGURE 4
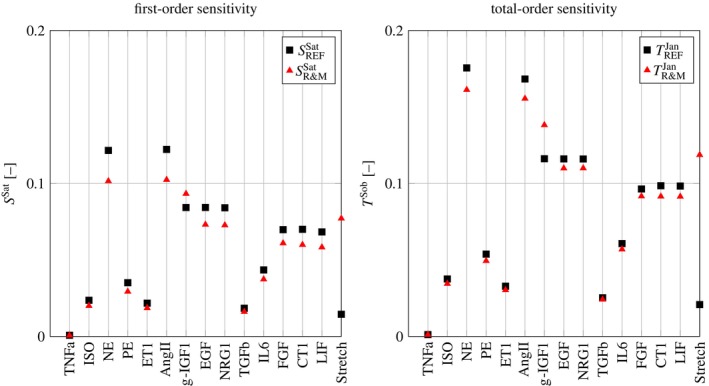 FIGURE 5
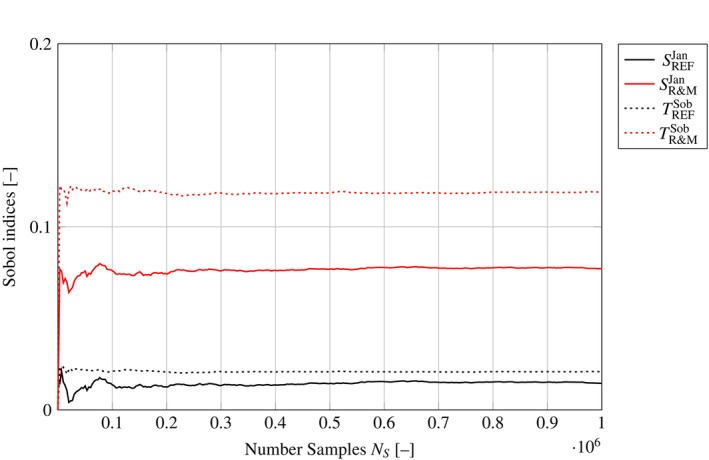 FIGURE 6
|
, see Equation ( | References |
|---|---|
| [ | |
| [ | |
| [ |
- —Bayerische Gesellschaft für Innovation und Wissenstransfer mbH
- —Leibniz‐Rechenzentrum 10.13039/501100019692
Peer Reviews
No public reviews on file for this paper yet. If you reviewed it on a platform where reviews are public (OpenReview, ICLR, NeurIPS, ICML), you can paste yours below so the community can read it here.
Videos
No videos yet. Explain this paper in a talk, walkthrough, or lecture? Add one.
Taxonomy
TopicsGene Regulatory Network Analysis · Control Systems and Identification · Advanced Control Systems Optimization
Introduction
1
The heart is a dynamic muscular organ that pumps blood throughout the circulatory system. Various factors, whether physiological (such as sports activities, pregnancy, or natural growth and development in pediatric cases) or pathological (including valve defects and heart conditions like dilated cardiomyopathy), can lead to altered pumping demands on the heart [1, 2, 3]. In response, the heart undergoes long‐term adaptations involving changes in its geometry and function. This process is commonly referred to as growth and remodeling (G&R) [4, 5].
On a cellular level, the hormone insulin‐like growth factor 1 (IGF1) plays a crucial role in G&R. When it binds to its receptor IGF1R, multiple signaling pathways are activated to regulate cell proliferation, differentiation, metabolism, and survival [6]. IGF1 is mainly synthesized in the liver and carried to the heart with the bloodstream, causing an endocrine effect [7]. However, it is also produced locally in response to mechanical stretches, causing an autocrine or paracrine effect [8]. Its absence prevents cardiomyocyte growth in hypertension, leading ultimately to heart failure. Thus, locally produced IGF1 (l‐IGF1) is a crucial requirement for heart growth and thus has to be considered in G&R [9].
Signaling networks have been used to represent the complex interplay of mechanical and biochemical stimuli for heart growth on a cellular level [10, 11, 12, 13]. They consist of a set of species and a set of reactions determining the mutual dependencies among species. Species refer to the molecular entities involved in the signaling network, such as proteins, small molecules (e.g., ions, metabolites), nucleic acids (e.g., DNA, RNA), and complexes formed by these molecules. Reactions represent the biochemical interactions or transformations that occur between species within the signaling network, e.g., protein–protein binding. Within these signaling networks, the species CellArea has been used to describe heart growth [14].
In the past, signaling networks were modeled with kinetic [15], Boolean [16], fuzzy logic [17], or normalized Hill differential equations [18, 19]. The analysis of these signaling networks is challenging due to the number of parameters and interactions between species. A detailed overview is given by [20].
To analyze the influence of mechanical and biochemical stimuli on the output quantity of interest CellArea, sensitivity analysis can be used. In general, one differentiates between local and global sensitivity analysis. Local sensitivity analysis investigates how the model output changes at a fixed set of input values, and it has been applied to signaling networks [10, 18, 21]. In contrast, global sensitivity analysis investigates how the model output changes over a range of inputs [22]. Furthermore, nonlinear effects and interactions between inputs can be analyzed. However, a large number of model evaluations is needed, increasing the computational cost.
In this contribution, the following research objectives are addressed.
We incorporate the local IGF1 production pathway into an existing signaling network used for modeling cardiac growth based on rather recent findings in [8, 9]. Thus, we choose to base our study on a well‐established and recently published network [14] and demonstrate and discuss changes due to the novel local‐IGF1 production pathway. Second, we introduce a methodology for computing global sensitivities (GSA), which provides a more comprehensive analysis than local sensitivity approaches. Finally, we apply this methodology to identify the most influential species on heart growth, offering insights that are difficult to obtain using local sensitivity analysis alone.
Our global sensitivity analysis shows that due to the local IGF1 production, the mechanical influence on heart growth is drastically increased. Furthermore, mechanical stretch, NE, ANGII, and globally produced IGF1 (g‐IGF1) appeared as the most influential input factors.
Material and Methods
2
Signaling Network Modifications
2.1
As a starting point, we utilize an established signaling network originally published by Ryall et al. [21] and subsequently utilized in other studies [10, 14, 23]. For the sake of completeness, this network is shown in Figure 1. It is referred to as the reference (REF) network throughout this paper. The REF network is specifically designed for modeling cardiac growth, making it a suitable reference for our research objectives.
Reference (REF) network containing 106 species and 193 reactions (taken from [10, 14, 21, 23]). It consists of 17 inputs and 7 outputs and is arranged in 19 layers, where all species in a layer depend only on species in previous layers. The species Stretch and CellArea are represented as hexagons as they are related mechanical quantities. A black connection denotes a species activation, whereas red color represents an inhibition. A detailed list of all species within this network can be found in the appendix (see Table A1).
It is important to note that there are other networks, such as presented in the work by Tan et al. [24], which focuses solely on the role of stretch as an input or the work by Saucermann et al. [25], which describes several pathways in cardiac myocytes. Although integrating both networks could yield additional insights, our study concentrates on the recent network presented by Estrada et al. [14].
The input species Stretch represents the local mechanical stimulus, and the output species CellArea can be used to quantify heart growth [14]. All other species are hormonal and biochemical factors. A detailed list of all species within the network can be found in the appendix (see Table A1).
The REF network is modified in two steps. First, since we are only interested in heart growth, all species and reactions that do not influence CellArea are removed. Second, the additional species l‐IGF1, accounting for the locally produced IGF1, is added into the second layer and is connected to Stretch and IGF1R. Furthermore, the input species IGF1 is renamed to g‐IGF1 as it now only represents the globally produced IGF1.
The local IGF1 production is attributed to resident cardiac macrophages, which are in physical contact with cardiomyocytes via focal adhesion complexes. Local IGF1 production is initiated by a calcium influx through transient receptor potential vanilloid 4 (TRPV4)‐calcium channels, triggering IGF1 gene expression, as demonstrated in Wong et al. [8]. Research in Zaman et al. [9] has established that locally produced IGF1 is even a crucial requirement for functional heart remodeling processes. Tissue‐resident macrophages have also other functions as they are involved in tissue development, remodeling, and immune adaption [26]. The obtained novel signaling network is referred to as the reduced and modified (R&M) network and is shown in Figure 2.
Reduced and modified (R&M) signaling network containing 80 species, 140 reactions, and 18 layers. It consists of 15 input species, CellArea remains the only output species. The network modifications are depicted in blue.
Direct Stationary Solution of the Hill Differential Equations
2.2
Let S denote the set of all species in a network and ℐ⊂S the set of input species. Each species s∈S is characterized by a concentration cs∈0cs,max, where cs=0 corresponds to the lowest and cs=cs,max to the highest possible level of activation. In the following, we define a network evaluation y=fcℐ, with cℐ=ci∈0,c~i,max∣i∈ℐ. In the REF and R&M network, y corresponds to cCellArea.
To evaluate the REF and R&M networks using Hill differential equations, we choose cs,max=1,τs=1∀s∈S\ℐ. If the reader is not familiar with the Hill differential modeling approach, please refer to the Appendix A for an example or see Kraeutler et al. [18]. All reaction weights w are set to 1 [14], and the pseudo time interval is set to 0,40. To demonstrate the system's behavior under low basal activation under normal in vivo conditions, all input concentrations, including Stretch, are assigned to ci=0.06,∀i∈ℐ throughout the entire simulation time [10]. In Figure 3, the time‐dependent concentrations of species CellArea are shown for the REF and the R&M network.
Time‐dependent concentration of species CellArea for the REF and R&M network. The direct stationary solution (DSS) is also shown for the R&M network.
In both networks, the concentration cCellArea approaches a stationary value. The additional pathway from Stretch to l‐IGF1 in the R&M network leads to a higher stationary value of cCellArea.
In the following, we consider it sufficient to calculate only the stationary solution of this signaling networks due to the following reasons:
- The observed initial transient oscillations of the concentrations arise from the arbitrarily chosen initial values and do not allow a statement on heart growth, see Figure A4.
- The timescale of dynamic hormonal changes is significantly smaller than the timescale of heart growth.
Demanding dcsdt=0∀s∈S\ℐ, the so‐called direct stationary solutions (DSS) are obtained.
As all signaling networks in this paper can be hierarchically arranged in layers, the DSS can be computed using forward substitution consecutively from the first to the last layer. In the Appendix A, a proof that all signaling networks used in this work are asymptotically stable can be found.
Sensitive Input Range
2.2.1
In the REF and R&M signaling networks, a strong monotonic behavior between the inputs cℐ and the output cCellArea is observed. A non‐monotonic behavior can only be introduced by inhibitions. Two consecutive inhibitions cancel each other out, see (B4). Within the R&M network, the pathway between PKA and Raf1 is the only pathway, where a single inhibition occurs. However, PKA still shows a monotonic behavior with respect to CellArea, since it also activates two other pathways. Figure 4 illustrates the concentration cCellArea over the input concentration cISO, which activates the PKA pathways. Here, all input concentrations are set to 0 except cISO. Although setting all other input concentrations to zero is not physiological, this approach enables the estimation of an upper bound for input concentrations, where cCellArea is sensitive to a change of the corresponding input concentration. Notably, even when all other inputs are neglected, cCellArea=1 is reached at cISO>0.35. This indicates that the upper bound for sensitive input concentrations is c~i,max≪1.
CellArea output of the R&M signaling network over a range of cISO, with all other input concentrations set to 0. For any concentration cISO>0.35, the output concentration cCellArea=1.
Global Sensitivity Analysis
2.3
The REF and R&M signaling networks show nonlinear effects due to the nonlinearity of the Hill activation function and the various interactions between the species. Thus, global sensitivity measures have to be applied. Global sensitivity analysis is preferred over local sensitivity analysis as it captures the interactions and nonlinearities across the entire parameter space, providing a more comprehensive understanding of the system's behavior.
A global sensitivity measure evaluates the sensitivity of the function output over a range of input values. Under certain orthogonality assumptions, cCellArea=fcℐ can be decomposed into its mean value f0, first‐order effects, and interaction terms [22, 27]
where fi depends solely on ci, fij on ci and cj, etc. [27]. In case the summands in (1) are uncorrelated, the total variance Vtot of the model output is
where the variances are defined as [28]
and analogously for higher order terms. Here, Ec∼icCellArea|ci is the expectation of cCellArea when ci is fixed and Vci is the variance of cCellArea for the input concentration ci. The expression ∼i denotes that all inputs in ℐ except the ith input are varied in the computation of the mean value. Equations (1) and (2) yield the ANOVA (analysis of variance) decomposition [29, 30]. With that, Sobol indices as global sensitivity estimators can be defined [28].
Sobol Indices
2.4
The first‐order sensitivity index
measures the first‐order contribution of ci, accounting for the reduction in the variance of cCellArea, relative to the entire output variance [28].
The total‐order index
measures the first and higher order influences of input ci and interaction terms on cCellArea [31]. If Ti≈0, ci has a negligible contribution to the total variance Vtot.
Computation of Sobol Indices
2.5
As the evaluation of (5) and (6) in case of many model inputs is computationally expensive, variances are estimated with the Monte Carlo (MC) method [32] using random or quasi‐random numbers (e.g., Latin Hypercube sampling, Sobol’ quasi‐random numbers) [33, 34]. For that, the so‐called base sample matrices A and B∈ℝNI×NS are introduced and each matrix is sampled individually and independent from the respective other. Exemplarily, the matrix A reads
where NI is the number of inputs, and NS is the number of samples [35]. In addition, the matrix ABi is formed, which consists of all columns from A except the ith column which is from B. The matrix BAi is formed accordingly. With these matrices, sensitivity estimators to compute Si and Ti can be defined, see Table 1. These estimators are based on the work of Sobol [28, 36] (Sob), Saltelli [22] (Sat), Jansen [22, 27] (Jan), and Homma [31] (Hom). Therein, fAj denotes a network evaluation, where the jth column of A is used as input concentrations. Similarly, the function evaluations fBj, fBAij, and fABij are defined.
The computational cost to evaluate the network using all samples of matrix A or B scales with NS. To evaluate the network for all matrices ABi or BAi with i=1,..,NS, the computational cost scales with NI⋅NS. When using DSS, the required model evaluations are computationally cheap, and thus global sensitivity analysis becomes affordable.
Global Input Sensitivity Results
3
As previously discussed, for too large input concentrations the output concentration cCellArea=1. In that case, a very large number of input samples would be needed to obtain meaningful sensitivity estimates. For the choice c~i,max=0.12 meaningful sensitivity estimates are obtained.
The base sample matrices A and B thus are filled using Latin Hypercube sampling [37] on the interval 0,0.12 for all inputs. Exemplarily, the sensitivity indices SSat and TJan of CellArea with respect to the input species are computed for the REF and R&M network using NS=1⋅106. Results are shown in Figure 5.
First‐ and total‐order sensitivities of cCellArea with respect to all input species in the REF and R&M network.
Compared to the REF network, both sensitivity indices of Stretch increase approximately by a factor of five for the R&M network. Hence, in the R&M network, together with g‐IGF1, NE, and ANGII, Stretch becomes one of the most influential factors on CellArea.
The additional pathway from Stretch to IGF1R induces an additional interaction between the inputs g‐IGF1 and Stretch in the R&M network. Hence, the total‐order sensitivity of g‐IGF1 increases. Both sensitivities of TNFa are small because it only enters one OR connection with six other species. Furthermore, the sensitivities of CT1 and LIF are roughly the same as both input species are only connected to gp130LIFR. Also, due to the increased sensitivity with respect to Stretch, the remaining sensitivities decrease.
Figure 6 shows the first‐ and second‐order estimators for both networks for the input node Stretch over the number of samples used for their computation, demonstrating convergence of the sensitivity analysis. All six estimators from Table 1 are shown in the appendix Figure A6. A numeric representation of the sensitivities can be found in the appendix in Tables A2 and A3.
Sobol indices for CellArea with respect to Stretch within the REF and R&M network plotted over the number of samples.
Discussion
4
Based on findings in Zaman et al. [9] and Wong et al. [8], we incorporated mechanically induced IGF1 production into an existing signaling network for heart growth [21] by adding an additional pathway from Stretch and l‐IGF1. Furthermore, we removed all species and reactions that do not influence CellArea, making the analysis of the network much cheaper. While we focused on integrating strain‐ induced IGF1 production into the established signaling network for heart growth [21], it is important to note that other networks can also be utilized. For instance, incorporating additional connections from the work of Tan et al. [24] could provide further insights into the role of stretch as an input. However, it is crucial to emphasize that global sensitivity analysis can be applied to any network and across all nodes, allowing for a comprehensive evaluation of influential factors and their interactions.
Our sensitivity analysis for the species CellArea, see Figure 5, shows that within the original REF network, Stretch has only a minor contribution to heart growth compared to other influential quantities. However, it has been shown that Stretch is most important for cardiomyocytes in heart growth [38]. Due to the additional pathway, Stretch became one of the most influential factors for growth within the R&M network. The sensitivities of CellArea with respect to Stretch are approximately five times higher than in the REF network.
All presented signaling networks converge to their stationary solution. Transient effects due to arbitrary initial conditions are not physiologically interpretable, see Figure 3. Furthermore, choosing appropriate initial conditions and reaction time constants is challenging due to the difficulty in data acquisition. For a fixed set of parameters, the timescale of hormonal and biochemical changes is smaller compared to the timescale of heart growth. This motivated the DSS approach, where reaction time constants and initial conditions are no longer required.
Given that the considered signaling networks are nonlinear with numerous interactions, we performed a global sensitivity analysis to identify the most influential factors on CellArea. The computational cost for many model evaluations is reduced by the DSS approach. We estimated the first‐ and total‐order sensitivities by using a variance‐based Monte Carlo approach. For sampling the input concentrations, we identified a physiological input range.
The first‐order sensitivity index showed an increased sensitivity of Stretch and decreased sensitivities of all other species for the R&M network. The total‐order sensitivity, which accounts for interactions between the species, increased for Stretch and g‐IGF1 while decreasing for all other species.
The most influential factors on CellArea were identified as Stretch, NE, AngII, and g‐IGF1. It has been shown that locally produced IGF1 is necessary in physiological heart growth [6, 8, 9]. Moreover, the species NE holds pivotal significance in myocytes and various cell types within the heart, governing crucial biological functions including growth [39, 40]. Additionally, AngII modulates cardiac contractility, cell coupling, and impulse propagation and contributes to cardiac growth and remodeling [41, 42].
Our sensitivity analysis revealed that the species TNFa exerts the least influence on heart growth. Previous studies have demonstrated that during physiological heart growth, the TNFa signaling cascade may not be necessary for normal cardiogenesis or that it could be redundant and compensated for by alternative signaling pathways [43]. However, in pathological conditions, the concentration of circulating TNFa can be elevated [44] and can induce hypertrophy [45]. These findings align with the outcomes of our sensitivity analysis.
Outlook
5
The calibration of signaling networks is challenging due to the high number of inputs and model parameters. However, in a so‐called factor fixing [35] approach, the presented results can be used to reduce the dimensionality of the input space and calibrate the signaling network.
Similar to the framework presented in [14], the proposed R&M signaling network could be coupled to a mechanical finite element model of the heart. For that, transfer functions to map parameters between the mechanical model and the signaling network need to be defined. One transfer function maps a strain metric from the mechanical model to the normalized concentration of Stretch. A possible definition could be based on the global longitudinal strain defined as the maximal contraction during systole. Physiological baseline values and pathological cases are reported in [46] and [47]. Another transfer function maps the output concentration of CellArea back to a physically interpretable growth rate value. This transfer function could be based on the physiological mass increase per year [48].
Ethics Statement
The authors have nothing to report.
Conflicts of Interest
The authors declare no conflicts of interest.
The reference list from the paper itself. Each links out to its DOI / PubMed record.
- 1M. Eghbali , R. Deva , A. Alioua , et al., “Molecular and Functional Signature of Heart Hypertrophy During Pregnancy,” Circulation Research 96, no. 11 (2005): 1208–1216.15905459 10.1161/01.RES.0000170652.71414.16 · doi ↗ · pubmed ↗
- 2J. Rawlins , A. Bhan , and S. Sharma , “Left Ventricular Hypertrophy in Athletes,” European Journal of Echocardiography 10, no. 3 (2009): 350–356.10.1093/ejechocard/jep 01719246500 · doi ↗ · pubmed ↗
- 3M. Yildiz , A. A. Oktay , M. H. Stewart , R. V. Milani , H. O. Ventura , and C. J. Lavie , “Left Ventricular Hypertrophy and Hypertension,” Progress in Cardiovascular Diseases 63, no. 1 (2020): 10–21.31759953 10.1016/j.pcad.2019.11.009 · doi ↗ · pubmed ↗
- 4L. Lee , G. Kassab , and J. Guccione , “Mathematical Modeling of Cardiac Growth and Remodeling,” Wiley Interdisciplinary Reviews: Systems Biology and Medicine 8, no. 3 (2016): 211–226.26952285 10.1002/wsbm.1330 PMC 4841715 · doi ↗ · pubmed ↗
- 5K. D. Schlüter and H. Piper , “Regulation of Growth in the Adult Cardiomyocytes,” FASEB Journal 13, no. 9001 (1999): S 17–S 22.10352141 10.1096/fasebj.13.9001.s 17 · doi ↗ · pubmed ↗
- 6R. Troncoso , C. Ibarra , J. M. Vicencio , E. Jaimovich , and S. Lavandero , “New Insights Into IGF‐1 Signaling in the Heart,” Trends in Endocrinology and Metabolism 25, no. 3 (2014): 128–137.24380833 10.1016/j.tem.2013.12.002 · doi ↗ · pubmed ↗
- 7Z. Laron , “Insulin‐Like Growth Factor 1 (IGF‐1): A Growth Hormone,” Molecular Pathology 54, no. 5 (2001): 311–316.11577173 10.1136/mp.54.5.311PMC 1187088 · doi ↗ · pubmed ↗
- 8N. R. Wong , J. Mohan , B. J. Kopecky , et al., “Resident Cardiac Macrophages Mediate Adaptive Myocardial Remodeling,” Immunity 54, no. 9 (2021): 2072–2088.34320366 10.1016/j.immuni.2021.07.003PMC 8446343 · doi ↗ · pubmed ↗