Association between Physical Activity and the Risk of Mortality and Hospitalization in Older Korean Adults with Heart Failure
Ga-In Yu, Pil-Sung Yang, Moon-Hyun Kim, Moo-Nyun Jin, Eunsun Jang, Hee Tae Yu, Tae-Hoon Kim, Hui-Nam Pak, Moon-Hyoung Lee, Boyoung Joung

TL;DR
This study shows that even light physical activity can reduce mortality risk in older Korean adults with heart failure.
Contribution
The study identifies lower physical activity thresholds for mortality reduction in older Asian heart failure patients.
Findings
Insufficiently active patients had a 18% lower mortality risk than inactive patients.
Highly active patients had a 48% lower mortality risk compared to inactive patients.
Benefits started at lower activity levels than WHO guidelines suggest.
Abstract
Regular exercise improves the functional ability and quality of life of patients with heart failure (HF). However, studies on the results of intensity of exercise in the older population are scarce, especially in the Asian population. A total of 8982 older people (age ≥65 years) with HF were selected from the Korean National Health Insurance Service-Senior database (2005–2012). Participants were stratified according to the levels of physical activity per week as follows: (1) inactive group; (2) insufficiently active group: 1–499 metabolic equivalent task minutes (MET-min)/week; (3) active group: 500–999 MET-min/week; and (4) highly active group: ≥1000 MET-min/week. During a median follow-up period of 3.2 years, the incidence and risk of mortality were reduced in the insufficiently active (6.7 vs. 4.2 per 100 person-years, adjusted hazard ratio [HR], 0.82; 95% confidence…
Genes, proteins, chemicals, diseases, species, mutations and cell lines named across the full text — each resolved to its canonical identifier and authoritative record.
Click any figure to enlarge with its caption.
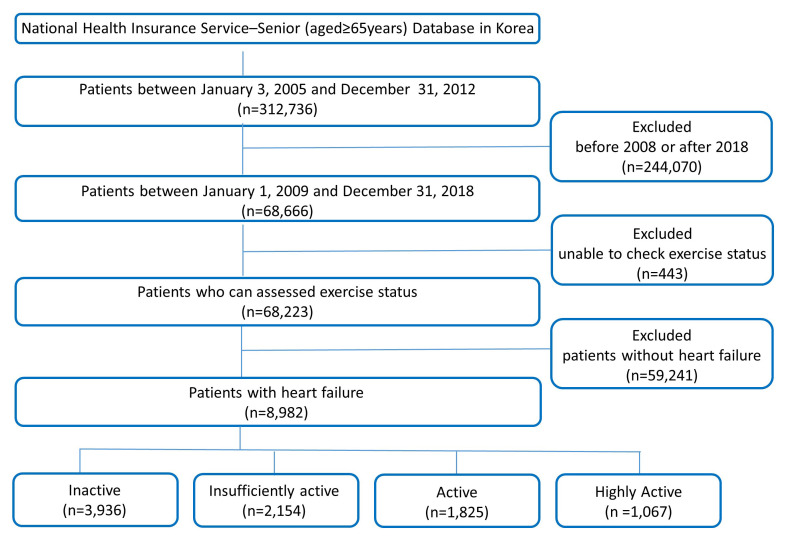 Fig. 1
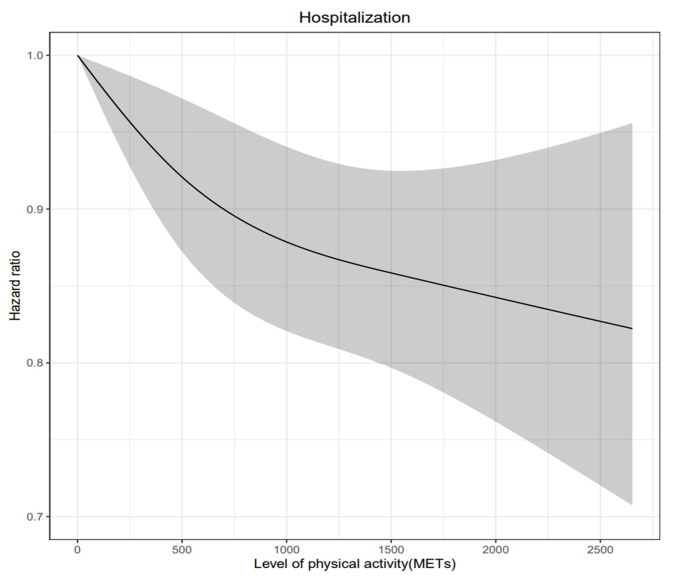 Fig. 2
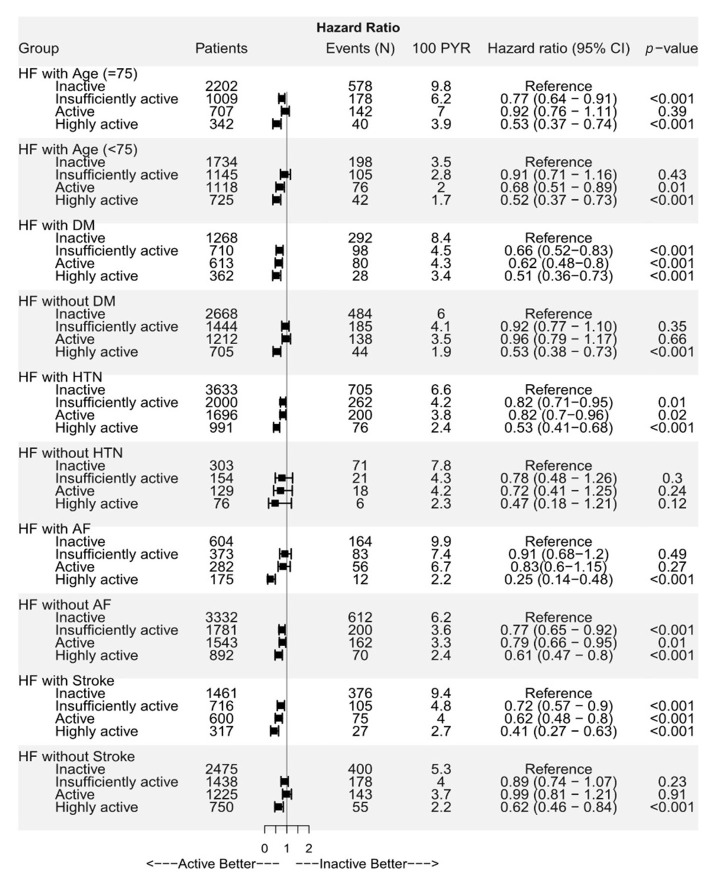 Fig. 3
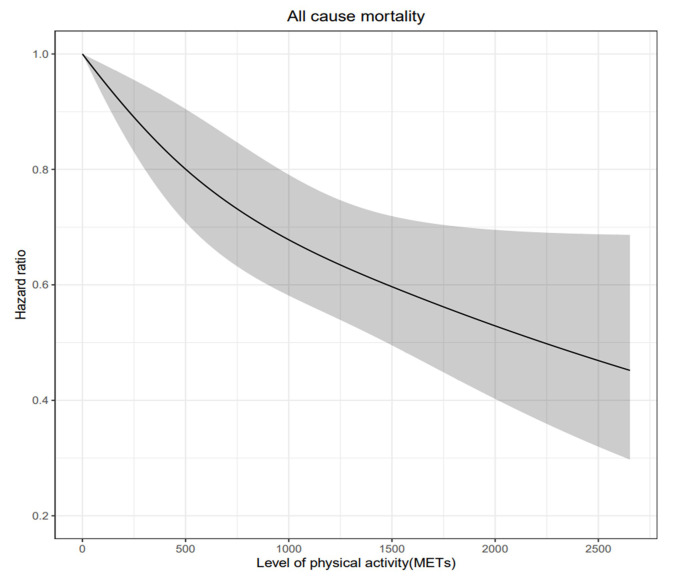 Fig. 4
| Inactive | Insufficiency active | Active | Highly active | |||
| (N = 3936) | (N = 2154) | (N = 1825) | (N = 1067) | |||
| Demographic | ||||||
| Age, years | 76.9 | 75.2 | 74.1 | 73.2 | ||
| Male | 927 (23.6%) | 577 (26.8%) | 633 (34.7%) | 508 (47.6%) | ||
| Body mass index, kg/ | 24.0 | 24.6 | 24.5 | 24.8 | ||
| Waist, cm | 83.7 | 85.0 | 84.7 | 85.8 | ||
| Systolic blood pressure, mmHg | 130.7 | 130.5 | 131.8 | 132.4 | 0.005 | |
| Diastolic blood pressure, mmHg | 77.8 | 77.7 | 78.0 | 78.5 | 0.243 | |
| Smoking | 549 (13.9%) | 378 (17.5%) | 403 (22.1%) | 329 (30.8%) | ||
| Alcohol | 305 (7.7%) | 274 (12.7%) | 293 (16.1%) | 254 (23.8%) | ||
| Risk scores | ||||||
| Hospitality frailty risk score | 5.3 | 3.3 | 2.7 | 2.4 | ||
| Charlson comorbidity index | 5.7 | 5.6 | 5.4 | 5.3 | ||
| Comorbidities | ||||||
| Hypertension | 3633 (92.3%) | 2000 (92.9%) | 1696 (92.9%) | 991 (92.9%) | 0.774 | |
| Diabetes mellitus | 1268 (32.2%) | 710 (33.0%) | 613 (33.6%) | 362 (33.9%) | 0.628 | |
| Dyslipidemia | 2783 (70.7%) | 1579 (73.3%) | 1393 (76.3%) | 813 (76.2%) | ||
| Chronic kidney disease | 298 (7.6%) | 146 (6.8%) | 122 (6.7%) | 65 (6.1%) | 0.290 | |
| Vascular disease | 1114 (28.3%) | 577 (26.8%) | 503 (27.6%) | 302 (28.3%) | 0.619 | |
| Ischemic stroke or TIA | 1461 (37.1%) | 716 (33.2%) | 600 (32.9%) | 317 (29.7%) | ||
| COPD | 1062 (27.0%) | 580 (26.9%) | 393 (21.5%) | 229 (21.5%) | ||
| Malignancy | 793 (20.1%) | 489 (22.7%) | 376 (20.6%) | 236 (22.1%) | 0.094 | |
| Osteoporosis | 2362 (60.0%) | 1203 (55.8%) | 899 (49.3%) | 477 (44.7%) | ||
| Previous MI | 577 (14.7%) | 269 (12.5%) | 221 (12.1%) | 130 (12.2%) | 0.012 | |
| Peripheral artery disease | 697 (17.7%) | 378 (17.5%) | 334 (18.3%) | 205 (19.2%) | 0.638 | |
| Laboratory findings | ||||||
| Fasting blood glucose, mmol/L | 109.0 | 109.0 | 110.1 | 111.9 | 0.135 | |
| Total cholesterol, mg/dL | 189.7 | 190.8 | 189.4 | 187.5 | 0.220 | |
| Triglyceride, mg/dL | 143.8 | 146.4 | 143.3 | 143.8 | 0.624 | |
| LDL-cholesterol, mg/dL | 111.2 | 110.3 | 109.3 | 107.4 | 0.025 | |
| HDL-cholesterol, mg/dL | 51.1 | 51.6 | 52.0 | 51.3 | 0.657 | |
| AST, U/L | 25.5 | 26.7 | 26.9 | 26.5 | 0.017 | |
| ALT, U/L | 20.2 | 21.8 | 22.8 | 22.7 | ||
| Gamma GT, U/L | 31.8 | 34.6 | 35.4 | 37.8 | 0.001 | |
| Serum creatinine, mg/dL | 1.1 | 1.1 | 1.1 | 1.1 | 0.798 | |
| eGFR, mL/min/1.73 | 63.8 | 65.1 | 66.4 | 68.5 | ||
| Medication history | ||||||
| Aspirin | 3093 (78.6%) | 1682 (78.1%) | 1426 (78.1%) | 831 (77.9%) | 0.944 | |
| P2Y12 inhibitor | 1214 (30.8%) | 619 (28.7%) | 547 (30.0%) | 321 (30.1%) | 0.400 | |
| Vitamin K antagonist | 318 (8.1%) | 181 (8.4%) | 147 (8.1%) | 87 (8.2%) | 0.972 | |
| NOAC | 15 (0.4%) | 9 (0.4%) | 12 (0.7%) | 6 (0.6%) | 0.460 | |
| ACE inhibitors or ARB | 3111 (79.6%) | 1714 (79.6%) | 1446 (79.2%) | 833 (78.1%) | 0.800 | |
| Beta-blockers | 2680 (68.1%) | 1466 (68.1%) | 1228 (67.3%) | 737 (69.1%) | 0.801 | |
| Diuretics | 3566 (90.6%) | 1910 (88.7%) | 1599 (87.6%) | 922 (86.4%) | ||
| Mineralocorticoid receptor antagonist | 1643 (41.7%) | 812 (37.7%) | 642 (35.2%) | 346 (32.4%) | ||
| Statin | 1897 (48.2%) | 1074 (49.9%) | 941 (51.6%) | 571 (53.5%) | 0.007 | |
| Patients (n) | Events (n) | Events/100 PYR | Unadjusted HR (95% CI) | Adjusted HR (95% CI) | ||||
| All-cause mortality | ||||||||
| Inactive | 3936 | 776 | 6.7 | Reference | Reference | |||
| Insufficiently active | 2154 | 283 | 4.2 | 0.63 (0.55–0.72) | 0.82 (0.71–0.94) | 0.010 | ||
| Active | 1825 | 218 | 3.8 | 0.56 (0.48–0.65) | 0.81 (0.70–0.95) | 0.010 | ||
| Highly active | 1067 | 82 | 2.4 | 0.35 (0.28–0.44) | 0.52 (0.41–0.67) | |||
| CVD mortality | ||||||||
| Inactive | 3936 | 261 | 2.2 | Reference | Reference | |||
| Insufficiently active | 2154 | 95 | 1.4 | 0.63 (0.50–0.79) | 0.90 (0.70–1.14) | 0.370 | ||
| Active | 1825 | 77 | 1.3 | 0.59 (0.46–0.76) | 0.94 (0.72–1.24) | 0.670 | ||
| Highly active | 1067 | 30 | 0.9 | 0.38 (0.26–0.56) | 0.68 (0.45–1.01) | 0.060 | ||
| Non-CVD-related mortality | ||||||||
| Inactive | 3936 | 515 | 4.5 | Reference | Reference | |||
| Insufficiently active | 2154 | 188 | 2.8 | 0.63 (0.53–0.74) | 0.78 (0.65–0.93) | 0.010 | ||
| Active | 1825 | 141 | 2.5 | 0.55 (0.45–0.66) | 0.75 (0.62–0.91) | |||
| Highly active | 1067 | 52 | 1.5 | 0.33 (0.25–0.44) | 0.46 (0.34–0.62) | |||
| Patients (n) | Events (n) | Events/100 PYR | Unadjusted HR (95% CI) | Adjusted HR (95% CI) | ||||
| Hospitalization due to all-cause | ||||||||
| Inactive | 3936 | 2613 | 39.8 | Reference | Reference | |||
| Insufficiently active | 2154 | 1400 | 35.9 | 0.91 (0.85–0.97) | 0.004 | 0.98(0.91–1.04) | 0.490 | |
| Active | 1825 | 1156 | 33.1 | 0.84 (0.79–0.90) | 0.94(0.88–1.01) | 0.110 | ||
| Highly active | 1067 | 619 | 27.9 | 0.72 (0.66–0.79) | 0.81(0.74–0.89) | |||
| Hospitalization due to heart failure | ||||||||
| Inactive | 3936 | 287 | 2.6 | Reference | Reference | |||
| Insufficiently active | 2154 | 146 | 2.3 | 0.88 (0.72–1.08) | 0.216 | 1.04 (0.85–1.27) | 0.740 | |
| Active | 1825 | 107 | 1.9 | 0.75 (0.60–0.93) | 0.010 | 0.96 (0.77–1.21) | 0.750 | |
| Highly active | 1067 | 49 | 1.4 | 0.56 (0.42–0.76) | 0.75 (0.54–1.02) | 0.070 | ||
| Cardiovascular disease | ||||||||
| Inactive | 3936 | 159 | 1.4 | Reference | Reference | |||
| Insufficiently active | 2154 | 79 | 1.2 | 0.86 (0.66–1.13) | 0.273 | 0.92 (0.70–1.21) | 0.550 | |
| Active | 1825 | 78 | 1.4 | 0.99 (0.76–1.30) | 0.939 | 1.04 (0.78–1.38) | 0.790 | |
| Highly active | 1067 | 51 | 1.5 | 1.08 (0.79–1.48) | 0.633 | 1.11 (0.80–1.54) | 0.520 | |
| Stroke | ||||||||
| Inactive | 3936 | 246 | 2.2 | Reference | Reference | |||
| Insufficiently active | 2154 | 135 | 2.1 | 0.95 (0.77–1.17) | 0.643 | 1.02 (0.82–1.26) | 0.870 | |
| Active | 1825 | 108 | 1.9 | 0.87 (0.70–1.10) | 0.242 | 0.93 (0.73–1.17) | 0.520 | |
| Highly active | 1067 | 50 | 1.5 | 0.67 (0.49–0.91) | 0.009 | 0.70 (0.51–0.96) | 0.030 | |
Peer Reviews
No public reviews on file for this paper yet. If you reviewed it on a platform where reviews are public (OpenReview, ICLR, NeurIPS, ICML), you can paste yours below so the community can read it here.
Videos
No videos yet. Explain this paper in a talk, walkthrough, or lecture? Add one.
Taxonomy
TopicsCardiovascular and exercise physiology · Heart Failure Treatment and Management · Physical Activity and Health
1. Introduction
Heart failure (HF) has become an important public medical concern due to an increase in aging population. HF causes socioeconomic burdens on individuals and society [1]. It also has high morbidity and mortality rates, with approximately 30–40% of patients dying within 1 year after being diagnosed with HF [2]. The prevalence of HF in Asia is reported to range between 1.2% and 6.7%, depending on the study population [3, 4].
Physical activity reduces not only vascular diseases but also nonvascular morbidity as well as the mortality [5]. Recent guidelines recommend moderate-intensity physical activity (MPA); 150–300 min/week and vigorous-intensity physical activity (VPA); 75–150 min/week, which translates to 500–999 metabolic equivalent task min/week (MET-min/week) in population 65 years or older [6, 7]. Completing 150 min/week of MPA exercise (i.e., brisk walking or other moderate-intensity aerobic activities) reduces the risk of morbidity, mortality, disability, and frailty by more than 30% compared to inactivity [8, 9].
The effectiveness of exercise in HF patients is based on studies that actively implemented exercise-training programs within a safe range of exercise intensity in stable patients undergoing adequate medical treatment [10]. Meta-analyses showed that exercise can reduce the mortality risk in patients with HF, and these results were maintained even with short-term exercise (under 12 months) [11, 12, 13].
However, studies on the Asian population are still lacking and in particularly, although the prevalence of heart failure is high, there are not many results according to exercise intensity in the elderly population who has difficulty in high-intensity exercise. The aim of this study was to determine the effect of intensity of physical activity on the mortality risk in older individuals (age 65 years) with HF in the Asian population. We also evaluated other clinical outcomes, including all-cause hospitalizations, HF-related hospitalizations, cardiovascular disease (CVD), and stroke.
2. Methods
2.1 Study Population
Data were collected from the National Health Insurance Service of Korea (NHIS)-Senior database, which included data of 312,736 populations collected via a 10% simple random sampling method from a total of 5,500,000 populations 65 years or older in the National Health Information Database [14, 15]. The NHIS-Senior database included socioeconomic and insurance status, medical history, and check-up test results.
This study included the data of 8982 older adults (age 65 years) with a history of HF from the Korean NHIS-Senior database, for whom health check-up data were available between 2009 and 2013 and who were followed up until December 2015 (Fig. 1). Criteria of HF in this study was based on ICD-10 codes (I11.0, I50, and I97.1) for one inpatient or two outpatient visit in the database (Supplementary Table 1).
Flow diagram of the study population. A total of 8982 heart failure patients aged 65 years or older in Korea were classified according to exercise intensity.
2.2 Assessment of Physical Activity Level
The level of physical activity during waking time was evaluated through a self-report questionnaire using the 7-day recall method [16, 17, 18]. The questionnaire asked about frequency (days/week) of the following three intensity levels: (i) low-intensity physical activity (LPA) for at least 30 min, (ii) MPA for at least 30 min, and (iii) VPA for at least 20 min. LPA include slow speed of walking, MPA include like normal speed of walking and cycling and VPA include high speed of running and cycling.
Using the Ainsworth et al. [19] compendium, 3.3 METs for LPA, 4.0 METs for MPA, and 8.0 METs for VPA were assigned. And the total physical activity-related energy expenditure (MET-min/week) was the sum of duration frequency and intensity of exercise [19]. The participants were stratified according to their total weekly levels of physical activity as follows: (1) highly active group: physical activity exceeding the guideline target range ( 1000 MET-min/week); (2) active group: physical activity within the guideline target range (500–999 MET-min/week); (3) insufficiently active group: physical activity less than the guideline target range (1–499 MET-min/week); and (4) inactive group: no physical activity other than minimal movement in their spare time, considering the guidelines and previous studies [6, 7, 20].
2.3 Baseline Comorbidities
Baseline comorbidities were assessed with the ICD-10 codes and drug prescription data (Supplementary Table 1). To ensure diagnostic accuracy, as in previous studies, if the diagnosis was registered at the time of discharge or the same diagnosis was registered twice or more in an outpatient clinic, the case was considered a corresponding comorbidity [15, 21, 22]. We performed analysis of drug history for heart failure. Among ACE (angiotensin-converting enzyme) inhibitor or ARB (angiotensin II receptor blocker), BB (beta blocker), loop diuretics and mineralocorticoid receptor antagonist, HF medication group I was assumed if no medications were taken or only ACE inhibitors or ARBs were taken. HF medication group II was assumed if BB or loop diuretics were taken but not mineralocorticoid receptor antagonist, and HF medication group III for patients taking mineralocorticoid receptor antagonist [23].
2.4 Outcomes
The primary outcome was all-cause mortality. Information on death (cause and time) was checked through a unique identification number in the demographics of the National Statistical Office [15, 22]. Since the NHIS is a national institution for all Koreans, this approach was used to ensure event-related information. And the mortality was analyzed by dividing them into CVD-related death and non-CVD-related death.
The secondary outcome was all-cause hospitalization. The hospitalization cause was based on the diagnosis at the time of discharge. Eligible causes of hospitalization such as exacerbation of HF, CVD, chronic ischemic heart disease, coronary vascular disease, and ischemic stroke were included. The accuracy of diagnosis based on NHIS claims data has already been verified [22]. The details of the clinical outcomes are described in Supplementary Table 1. Follow-ups of mortality and hospitalization were conducted until December 2015.
2.5 Statistical Analysis
Descriptive statistics were used to analyze the baseline characteristics of participants. Categorical variables are expressed as ratios (percentages), and continuous variables are expressed as median and interquartile range. Fisher’s test or chi-square test was used for comparison between categorical variables, and Student’s t-test was used for comparison between continuous variables. The incidence of each clinical outcome was expressed as number of events/100 person-years.
Competing risk regression for all-cause death events was carried out with the Fine-Gray method. Multivariable regressions were carried out with adjustment for age, gender, hypertension, diabetes, dyslipidemia, vascular disease, stroke, renal disease, lung disease, cancer, body mass index, smoking and drinking. Additionally, investigate the effects of physical activity as continuous value (0 MET-min/week as reference) on mortality via cubic spline curve.
All test with values of *p * 0.05 was considered statistically significant. Statistical analyses were performed using R programming version 4.0.3 (The R Foundation for Statistical Computing, Vienna, Austria).
3. Results
3.1 Baseline Characteristics
A total of 8982 individuals 65 years or older (mean age, 75.5 6.3 years) with HF were included in the analysis. The comparison of baseline characteristics among groups classified by activity level are summarized in Table 1. The participants were divided into inactive, insufficiently active, active, and highly active groups, accounting for 15.6%, 13.0%, 11.4%, and 10.2% of the study population, respectively.
3.2 Level of Physical Activity and Mortality
During the mean follow-up period of 92.8 36.9 months, 1359 (15.1%) participants had all-cause mortality with an overall incidence of 5.0/100 person-years. The all-cause mortality rates were 6.7, 4.2, 3.8, and 2.4/100 person-years in the inactive, insufficiently active, active, and highly active groups, respectively (Table 2). In the Fine-Gray competing risk multivariable regression analysis, the insufficiently active (HR, 0.82; 95% CI, 0.71–0.94), active (HR, 0.81; 95% CI, 0.70–0.95), and highly active (HR, 0.52; 95% CI, 0.41–0.67) groups were showed lower risks of mortality compared to the inactive group. Fig. 2 presents the risk of hospitalization associated with continuous values of level of physical activity with a cubic spline curve. The risk of mortality associated with continuous values of level of physical activity with a cubic spline curve. There was a linear relationship between physical activity and risk of mortality. As the level of physical activity increased, the mortality risk was further reduced.
Table 2.: Risk of all-cause mortality, cardiovascular mortality, and non-cardiovascular disease related mortality according to physical activity among older adults with heart failure.
Weekly level of physical activity and adjusted hazard ratio for all-cause hospitalization in older adults with heart failure. MET, metabolic equivalent task. Non-linear cubic spline curve of weekly physical activity level against hospitalization. Black line represents the fitted line of the association between weekly physical activity level and adjusted hazard ratio of hospitalization, whereas the shaded region represents the 95% confidence interval.
The incidence of non-CVD-related mortality was 4.5, 2.8, 2.5, and 1.5/100 person-years in the inactive, insufficiently active, active, and highly active groups, respectively. Compared to the inactive group, the adjusted risk of non-CVD-related mortality was reduced in the insufficiently active (HR, 0.78; 95% CI, 0.65–0.93), active (HR, 0.75; 95% CI, 0.62–0.91), and highly active (HR, 0.46; 95% CI, 0.34–0.62) groups. However, the adjusted risk of cardiovascular-related mortality was not reduced by physical activity (Table 2).
3.3 Level of Physical Activity and Hospitalization
During the follow-up period, 5788 patients (64.4%) were hospitalized. The overall incidence of all-cause hospitalizations during follow-up was 35.8/100 person-years. When divide the patients according to their level of intensity of physical activity, the incidence rates were 39.8, 35.9, 33.1, and 27.9 cases/100 person-years in the inactive, insufficiently active, active, and highly active groups, respectively (Table 3). In the Fine-Gray competing risk multivariable regression models, compared with the inactive group, the insufficiently active (HR, 0.98; 95% CI, 0.91–1.04), active (HR, 0.94; 95% CI, 0.88–1.01), and highly active (HR, 0.81; 95% CI, 0.74–0.89) groups were showed a lower risk of hospitalization. Fig. 2 presents the risk of hospitalization associated with continuous values of level of physical activity with a cubic spline curve. A non-linear relationship between physical activity and the risk of hospitalization was evident. Although the risk of hospitalization was further reduced with increased level of physical activity, the benefit of increased physical activity did not increase beyond 1500 MET-min/week.
Table 3.: Risk of hospitalization due to all-cause and heart failure, cardiovascular disease and stroke according to physical activity among older adults with heart failure.
Compared to the inactive group, the incidence and risk of stroke were reduced in the highly active group (2.2 vs. 1.5/100 person-years; HR, 0.70; 95% CI, 0.51–0.96; p = 0.030) (Table 3). However, the risks of HF admission and CVD were not reduced by increased physical activity.
3.4 Subgroup Analysis
The risk of mortality was assessed in different patient subgroups. A risk reduction of mortality was observed regardless of the patient’s age, sex, hypertension, diabetes, chronic kidney disease, and previous history of stroke (Fig. 3). In subgroup analysis according to gender, the adjusted risk of all-cause mortality was reduced in the insufficiently active (in female: HR, 0.81; 95% CI, 0.67–0.97 and in male: HR, 0.81; 95% CI, 0.64–1.03), active (in female: HR, 0.79; 95% CI, 0.64–0.99 and in male: HR, 0.85; 95% CI, 0.68–1.07), and highly active (in female: HR, 0.58; 95% CI, 0.40–0.84 and in male: HR, 0.50; 95% CI, 0.36–0.68) groups (Supplementary Table 2). The adjusted risk of all-cause hospitalization was presented at Supplementary Table 3.
Subgroup analyses of all-cause mortality in older adults with heart failure. AF, atrial fibrillation; CI, confidence interval; DM, diabetes mellitus; HF, heart failure; HTN, hypertension; PYR, person-years at risk. Forest plot showing the adjusted hazard ratios of all-cause death in older (age ≥65 years) patients with heart failure. In all cases of HF, regardless of the presence or absence of DM, HTN, AF, and stroke, exercise reduced all-cause mortality. Even minimal exercise reduced all-cause death compared to no exercise, and the degree of mortality reduction increased as the level of exercise increased.
In a subgroup analysis of the HF medication group, for all-cause mortality and non-CVD-related mortality, there was no difference in outcome with increasing exercise in HF medication group I—none or ACE inhibitor/ARB, but all-cause mortality and non-CVD-related mortality were decrease with increasing exercise in HF medication group II—beta blocker or diuretics, III—spironolactone (Supplementary Table 4). On the other hand, in the case of hospitalization due to heart failure and cardiovascular disease, exercise had a positive effect on outcome in HF medication group I—none or ACE inhibitor/ARB, but in HF medication group II—beta blocker or diuretics, III—spironolactone, there was no significant correlation between exercise change and outcome (Supplementary Table 5).
4. Discussion
This large scale, real-world nationwide cohort study of older Asians with HF demonstrated the following results. First, known effects of exercise on HF were reconfirmed in an older Asian population. Increased level of physical activity decreased the risk of all-cause mortality. In particular, the risk of non-CVD mortality (vs. CVD-related mortality) was significantly reduced with increased physical activity. Moreover, increased physical activity also reduced the risk of hospitalization in older patients with HF. Second, and more importantly, the effect of decreasing mortality with more physical activity started at level lower of physical activity compared to the World Health Organization (WHO) guideline of 500–999 MET-min/week.
4.1 Physical Activity and Mortality in Older Adults with HF
The recent Cochrane review of exercise training [12], including 33 trials in 4740 patients with HF (primarily HF with a reduced ejection fraction), showed that exercise tends to reduce mortality in trials using 1 year of follow-up. Compared to the control group, the exercise-trained group had lower hospitalization rates (both all-cause and HF-related hospitalizations) and improved the quality of life of patients. Practical recommendations for exercise training have been published by the Heart Failure Association [24]. Also, a single large-scale randomized controlled trial showed a modest decrease in the primary composite outcome of all-cause mortality or all-cause hospitalization [25]. However, this study did not show a significant reduction in mortality [25, 26]. Therefore, although the importance of exercise in HF has been proven, there is insufficient information on the results of exercise intensity, with limited number of related studies, especially on Asians.
4.2 Dose of Physical Activity and Mortality in Older Adults with HF
As the life expectancy of HF peoples increases, comprehensive medical support for them, including lifestyle modifications, such as exercise, has become increasingly important. In this study, the dose-response relationship between physical activity and mortality was evaluated by calculating the total duration physical activity as a continuous variable. The positive benefits of increased physical activity on mortality started to appear at lower levels of activity (Fig. 4). These results showed that little activity is better than no activity at all.
Adjusted hazard ratio for all-cause mortality in older adults with heart failure by weekly physical activity levels. MET, metabolic equivalent task. Non-linear cubic spline curve of physical activity level against all-cause mortality. Black line represents the fitted line of the association between weekly physical activity level and adjusted hazard ratio of mortality, whereas the shaded region represents the 95% confidence interval.
Also, the same results were confirmed in the analysis by gender difference. Although many studies demonstrated that physical activity and physical exercise may prevent negative cardiovascular adaptations associated with the postmenopausal period, which in turn could lead to the development of heart failure [27, 28], this study showed that physical activity reduced all-cause mortality and all-cause hospitalization even in elderly females with HF.
In the past, exercise was performed for the prevention of diseases including heart failure and it is already known that exercise has therapeutic implications [29, 30]. This is also specified in current treatment guidelines [7]. This study showed that the therapeutic effect of such exercise was also applied to Asian, older adults, and heart failure patients, and that even lower-intensity exercise than the guideline was meaningful.
4.3 Limitations
This study had limitations. First, it did not include echocardiographic data, such as left ventricular ejection fraction, or assessment of symptoms, such as the New York Heart Association Functional Classification, since the diagnostic criteria of HF were based on the ICD codes. Although we presented the outcome according to the different degree of medication for heart failure, the severity of HF could not be evaluated. This can be an important limitation of this study, as severe HF condition can reduce physical activity. Further studies based on the severity of HF are required. Second, such studies using administrative databases could be susceptible to errors arising from coding inaccuracies. To minimize this problem, we applied the definitions that were already validated in previous studies using the Korean NHIS cohort [15, 20, 21, 22, 23, 24, 25, 26, 27, 28, 29, 30, 31]. Third, CV-related information was relatively well known in NHIS data, but it was difficult to identify all other causes of death. Therefore, we only divided total deaths into two categories: CVD-related and non-CVD-related deaths. Fourth, this study relied on self-reported data at a single point in time. Therefore, questionnaire answers may not reflect the overall patient’s condition. Fifth, although physical activity plays an important role in reducing CVD-related incidents, recent data showed that activity alone is not enough to reduce the risk of CVD in older adults [32, 33]. In this study, other factors such as sedentary behavior were not considered; therefore, additional research on these factors in the elderly Asian population is required. Despite these limitations, this study was still significant in that it was a large-sized study using physical activity data in older Asian population with HF. Herein, we assessed the correlation between exercise intensity and clinical outcomes in HF patients. Overall, our analysis may serve as the first step in determining the optimal exercise intensity for older adults with HF.
5. Conclusions
In older population with HF, increased level of physical activity was reduced risk of all-cause mortality. The benefit of increased physical activity on mortality began at a lower physical activity level compared to the WHO guideline of 500–999 MET-min/week, and the risk reduction of all-cause death increased with increased level of physical activity.
The reference list from the paper itself. Each links out to its DOI / PubMed record.
- 1Braunwald E The war against heart failure: the Lancet lecture The Lancet 201538581282410.1016/S 0140-6736(14)61889-425467564 · doi ↗ · pubmed ↗
- 2Mosterd A Hoes AW Clinical epidemiology of heart failure Heart 200793113711461769918010.1136/hrt.2003.025270 PMC 1955040 · doi ↗ · pubmed ↗
- 3Sato N Epidemiology of Heart Failure in Asia Heart Failure Clinics 2015115735792646209710.1016/j.hfc.2015.07.009 · doi ↗ · pubmed ↗
- 4Guo Y Lip GY Banerjee A Heart Failure in East Asia Current Cardiology Reviews 201391121222359729510.2174/1573403 X 11309020004 PMC 3682395 · doi ↗ · pubmed ↗
- 5Lear SA Hu W Rangarajan S Gasevic D Leong D Iqbal R et al The effect of physical activity on mortality and cardiovascular disease in 130 000 people from 17 high-income, middle-income, and low-income countries: the PURE study The Lancet 20173902643265410.1016/S 0140-6736(17)31634-328943267 · doi ↗ · pubmed ↗
- 6Piercy KL Troiano RP Ballard RM Carlson SA Fulton JE Galuska DA et al The Physical Activity Guidelines for Americans Journal of the American Medical Association 2018320202020283041847110.1001/jama.2018.14854 PMC 9582631 · doi ↗ · pubmed ↗
- 7Sherrington C Fairhall N Kwok W Wallbank G Tiedemann A Michaleff ZA et al Evidence on physical activity and falls prevention for people aged 65+ years: systematic review to inform the who guidelines on physical activity and sedentary behaviour International Journal of Behavioral Nutrition and Physical Activity 2020171443323901910.1186/s 12966-020-01041-3PMC 7689963 · doi ↗ · pubmed ↗
- 8Rogers NT Marshall A Roberts CH Demakakos P Steptoe A Scholes S Physical activity and trajectories of frailty among older adults: Evidence from the English Longitudinal Study of Ageing P Lo S ONE 201712 e 01708782815208410.1371/journal.pone.0170878 PMC 5289530 · doi ↗ · pubmed ↗