Increased disease severity during COVID-19 related hospitalization in black non-hispanic, hispanic and medicaid-insured young children
Monica Oyidu Ochapa, Leah J. McGrath, Tamuno Alfred, Santiago M. C. Lopez, Rajeev M. Nepal

TL;DR
Young children from Black non-Hispanic, Hispanic, and Medicaid-insured backgrounds faced more severe outcomes during hospitalization for COVID-19 compared to White non-Hispanic and commercially insured children.
Contribution
This study identifies racial/ethnic and insurance-based disparities in prolonged hospitalization outcomes for young children with COVID-19.
Findings
Black non-Hispanic children had higher odds of prolonged hospitalization, ICU days, and mechanical ventilation compared to White non-Hispanic children.
Hispanic and Other race/ethnicity children also showed similar patterns of prolonged outcomes.
Medicaid-insured children had higher odds of prolonged hospitalization and oxygen use compared to commercially insured children.
Abstract
The COVID-19 pandemic has disproportionately affected marginalized groups in the United States. Although most children have mild or asymptomatic COVID-19, some experience severe disease and long-term complications. However, few studies have examined health disparities in severe COVID-19 outcomes among US children. To examine disparities in the clinical outcomes of infants and children aged <5 years hospitalized with COVID-19 by race/ethnicity and payer status. Children aged <5 years hospitalized with an admission diagnosis of COVID-19 (April 2021-February 2023) were selected from the PINC AI™ Healthcare Database. Hospital outcomes included length of stay (LOS), intensive care unit (ICU) admission, oxygen supplementation, invasive mechanical ventilation (IMV), and prolonged duration of each outcome. Multivariable logistic regression models compared hospitalization outcomes by…
Genes, proteins, chemicals, diseases, species, mutations and cell lines named across the full text — each resolved to its canonical identifier and authoritative record.
Click any figure to enlarge with its caption.
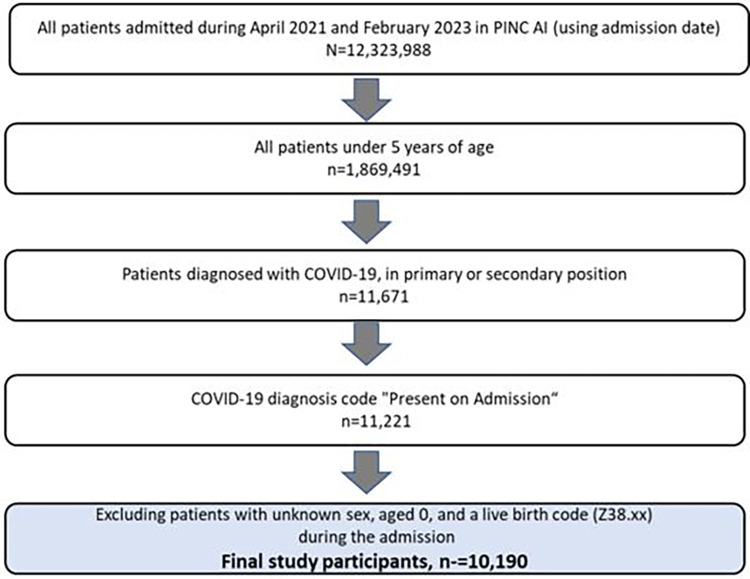 Figure 1
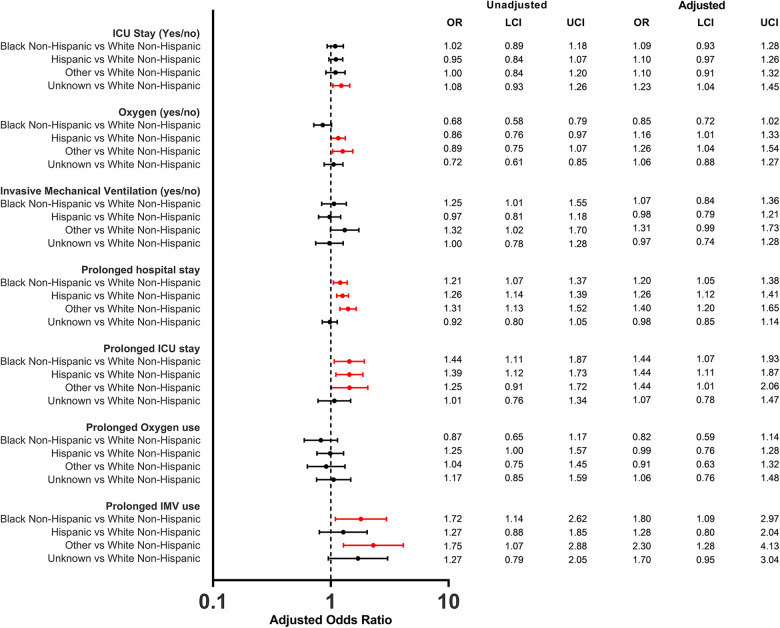 Figure 2
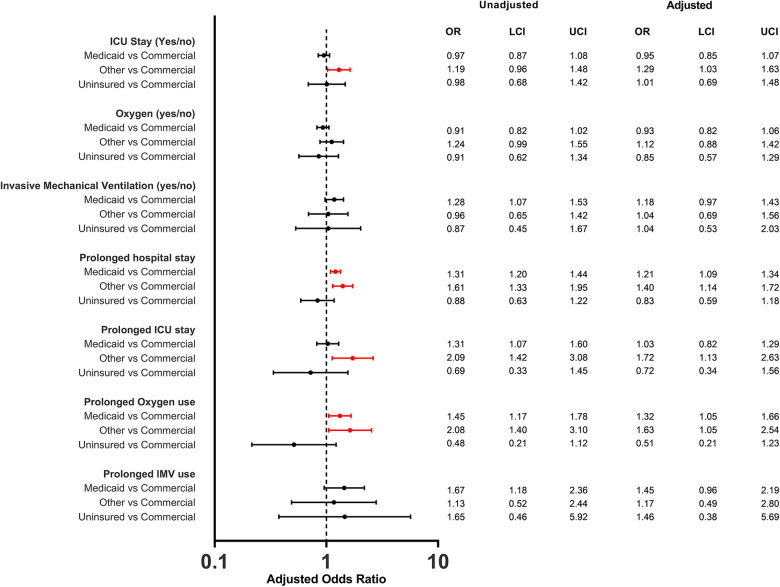 Figure 3
| Characteristics | Race/Ethnicity | Payer status | ||||||||
|---|---|---|---|---|---|---|---|---|---|---|
| Overall | White non-Hispanic | Hispanic (Hispanic with any or unknown race) | Black, non-Hispanic | Unknown | Other | Commercial | Medicaid | Other | Uninsured | |
| Age in years | ||||||||||
| Mean (SD) | 0.9 (1.2) | 0.9 (1.3) | 0.8 (1.2) | 1.0 (1.3) | 0.8 (1.2) | 1.0 (1.3) | 1.0 (1.3) | 0.9 (1.2) | 0.9 (1.2) | 0.8 (1.2) |
| Median (Q1, Q3) | 0 (0, 1) | 0 (0, 1) | 0 (0, 1) | 0 (0, 2) | 0 (0, 1) | 1 (0, 2) | 0 (0, 2) | 0 (0, 1) | 0 (0, 1) | 0 (0, 1) |
| Age group in years, | ||||||||||
| 0 | 5,745 (56.4) | 2,020 (56.5) | 1,674 (58.0) | 826 (53.3) | 787 (61.9) | 438 (48.1) | 1,440 (53.2) | 3,939 (57.9) | 266 (52.5) | 100 (57.1) |
| 1 | 1,930 (18.9) | 665 (18.6) | 524 (18.2) | 300 (19.3) | 229 (18.0) | 212 (23.3) | 536 (19.8) | 1,243 (18.3) | 115 (22.7) | 36 (20.6) |
| 2 | 1,066 (10.5) | 346 (9.7) | 312 (10.8) | 193 (12.4) | 102 (8.0) | 113 (12.4) | 307 (11.3) | 686 (10.1) | 53 (10.5) | 20 (11.4) |
| 3 | 802 (7.9) | 308 (8.6) | 204 (7.1) | 116 (7.5) | 87 (6.8) | 87 (9.5) | 238 (8.8) | 512 (7.5) | 43 (8.5) | 9 (5.1) |
| 4 | 647 (6.3) | 234 (6.5) | 170 (5.9) | 116 (7.5) | 66 (5.2) | 61 (6.7) | 186 (6.9) | 421 (6.2) | 30 (5.9) | 10 (5.7) |
| Sex, | ||||||||||
| Female | 4,436 (43.5) | 1,612 (45.1) | 1,230 (42.6) | 672 (43.3) | 527 (41.5) | 395 (43.4) | 1,150 (42.5) | 2,997 (44.1) | 221 (43.6) | 68 (38.9) |
| Male | 5,754 (56.5) | 1,961 (54.9) | 1,654 (57.4) | 879 (56.7) | 744 (58.5) | 516 (56.6) | 1,557 (57.5) | 3,804 (55.9) | 286 (56.4) | 107 (61.1) |
| Race/ ethnicity, | ||||||||||
| Asian Hispanic | 16 (0.2) | 0 | 16 (0.6) | 0 | 0 | 0 | 3 (0.1) | 12 (0.2) | 1 (0.2) | 0 (0.0) |
| Asian Non-Hispanic | 311 (3.1) | 0 | 0 | 0 | 0 | 311 (34.1) | 111 (4.1) | 176 (2.6) | 20 (3.9) | 4 (2.3) |
| Black Hispanic | 86 (0.8) | 0 | 86 (3.0) | 0 | 0 | 0 | 15 (0.6) | 65 (1.0) | 5 (1.0) | 1 (0.6) |
| Black Non-Hispanic | 1,551 (15.2) | 0 | 0 | 1,551 (100.0) | 0 | 0 | 214 (7.9) | 1,277 (18.8) | 40 (7.9) | 20 (11.4) |
| Other Hispanic | 987 (9.7) | 0 | 987 (34.2) | 0 | 0 | 0 | 138 (5.1) | 799 (11.7) | 29 (5.7) | 21 (12.0) |
| Other Non-Hispanic | 600 (5.9) | 0 | 0 | 0 | 0 | 600 (65.9) | 127 (4.7) | 436 (6.4) | 26 (5.1) | 11 (6.3) |
| White Hispanic | 1,578 (15.5) | 0 | 1,578 (54.7) | 0 | 0 | 0 | 251 (9.3) | 1,161 (17.1) | 143 (28.2) | 23 (13.1) |
| White Non-Hispanic | 3,573 (35.1) | 3,573 (100.0) | 0 | 0 | 0 | 0 | 1,534 (56.7) | 1,804 (26.5) | 180 (35.5) | 55 (31.4) |
| Unknown | 1,488 (14.6) | 0 | 217 (7.5) | 0 | 1,271 (100.0) | 0 | 314 (11.6) | 1,071 (15.7) | 63 (12.4) | 40 (22.9) |
| Insurance type, | ||||||||||
| Commercial | 2,707 (26.6) | 1,534 (42.9) | 435 (15.1) | 214 (13.8) | 286 (22.5) | 238 (26.1) | 2,707 (100.0) | 0 | 0 | 0 |
| Medicaid | 6,801 (66.7) | 1,804 (50.5) | 2,217 (76.9) | 1,277 (82.3) | 891 (70.1) | 612 (67.2) | 0 | 6,801 (100.0) | 0 | 0 |
| Other | 507 (5.0) | 180 (5.0) | 182 (6.3) | 40 (2.6) | 59 (4.6) | 46 (5.0) | 0 | 0 | 507 (100.0) | 0 |
| Uninsured | 175 (1.7) | 55 (1.5) | 50 (1.7) | 20 (1.3) | 35 (2.8) | 15 (1.6) | 0 | 0 | 0 | 175 (100.0) |
| Hospital urbanicity, | ||||||||||
| Rural | 501 (4.9) | 229 (6.4) | 96 (3.3) | 76 (4.9) | 48 (3.8) | 52 (5.7) | 138 (5.1) | 315 (4.6) | 34 (6.7) | 14 (8.0) |
| Urban | 9,689 (95.1) | 3,344 (93.6) | 2,788 (96.7) | 1,475 (95.1) | 1,223 (96.2) | 859 (94.3) | 2,569 (94.9) | 6,486 (95.4) | 473 (93.3) | 161 (92.0) |
| Diagnosis position, | ||||||||||
| Primary | 6,789 (66.6) | 2,387 (66.8) | 1,935 (67.1) | 1,006 (64.9) | 863 (67.9) | 598 (65.6) | 1,805 (66.7) | 4,508 (66.3) | 366 (72.2) | 110 (62.9) |
| Secondary | 3,401 (33.4) | 1,186 (33.2) | 949 (32.9) | 545 (35.1) | 408 (32.1) | 313 (34.4) | 902 (33.3) | 2,293 (33.7) | 141 (27.8) | 65 (37.1) |
| Comorbid conditions, | ||||||||||
| Diabetes | 61 (0.6) | 33 (0.9) | 10 (0.3) | 6 (0.4) | 5 (0.4) | 7 (0.8) | 28 (1.0) | 29 (0.4) | 2 (0.4) | 2 (1.1) |
| Obesity/ overweight | 50 (0.5) | 12 (0.3) | 25 (0.9) | 5 (0.3) | 3 (0.2) | 5 (0.5) | 5 (0.2) | 42 (0.6) | 3 (0.6) | 0 |
| Hypertension | 142 (1.4) | 30 (0.8) | 43 (1.5) | 31 (2.0) | 19 (1.5) | 19 (2.1) | 23 (0.8) | 117 (1.7) | 1 (0.2) | 1 (0.6) |
| Neurological disease | 660 (6.5) | 214 (6.0) | 192 (6.7) | 113 (7.3) | 76 (6.0) | 65 (7.1) | 148 (5.5) | 483 (7.1) | 26 (5.1) | 3 (1.7) |
| Asthma/reactive airway | 801 (7.9) | 279 (7.8) | 181 (6.3) | 184 (11.9) | 87 (6.8) | 70 (7.7) | 195 (7.2) | 569 (8.4) | 30 (5.9) | 7 (4.0) |
| Down syndrome/ chromosomal anomaly | 153 (1.5) | 58 (1.6) | 51 (1.8) | 13 (0.8) | 17 (1.3) | 14 (1.5) | 44 (1.6) | 103 (1.5) | 6 (1.2) | 0 |
| Immunocompromised | 1,573 (15.4) | 463 (13.0) | 426 (14.8) | 331 (21.3) | 200 (15.7) | 153 (16.8) | 400 (14.8) | 1,087 (16.0) | 72 (14.2) | 14 (8.0) |
| Solid malignancy | 177 (1.7) | 72 (2.0) | 52 (1.8) | 21 (1.4) | 19 (1.5) | 13 (1.4) | 50 (1.8) | 117 (1.7) | 9 (1.8) | 1 (0.6) |
| Hematologic malignancy | 109 (1.1) | 43 (1.2) | 36 (1.2) | 8 (0.5) | 9 (0.7) | 13 (1.4) | 36 (1.3) | 68 (1.0) | 5 (1.0) | 0 |
| Rheumatologic/other inflammatory condition | 348 (3.4) | 96 (2.7) | 114 (4.0) | 54 (3.5) | 49 (3.9) | 35 (3.8) | 97 (3.6) | 216 (3.2) | 29 (5.7) | 6 (3.4) |
| Primary immunodeficiency | 342 (3.4) | 118 (3.3) | 92 (3.2) | 58 (3.7) | 35 (2.8) | 39 (4.3) | 86 (3.2) | 241 (3.5) | 13 (2.6) | 2 (1.1) |
| Chronic kidney or end-stage renal disease | 299 (2.9) | 91 (2.5) | 80 (2.8) | 53 (3.4) | 45 (3.5) | 30 (3.3) | 63 (2.3) | 219 (3.2) | 14 (2.8) | 3 (1.7) |
| Other immune condition | 688 (6.8) | 187 (5.2) | 159 (5.5) | 202 (13.0) | 81 (6.4) | 59 (6.5) | 184 (6.8) | 477 (7.0) | 24 (4.7) | 3 (1.7) |
| Metabolic disease | 91 (0.9) | 43 (1.2) | 20 (0.7) | 11 (0.7) | 9 (0.7) | 8 (0.9) | 17 (0.6) | 65 (1.0) | 9 (1.8) | 0 |
| Sickle cell | 191 (1.9) | 4 (0.1) | 19 (0.7) | 128 (8.3) | 32 (2.5) | 8 (0.9) | 34 (1.3) | 151 (2.2) | 6 (1.2) | 0 |
| Psychiatric disorders | 15 (0.1) | 5 (0.1) | 4 (0.1) | 1 (0.1) | 4 (0.3) | 1 (0.1) | 2 (0.1) | 13 (0.2) | 0 | 0 |
| Congenital heart condition | 42 (0.4) | 13 (0.4) | 15 (0.5) | 6 (0.4) | 3 (0.2) | 5 (0.5) | 13 (0.5) | 27 (0.4) | 2 (0.4) | 0 |
| Congenital lung condition | 29 (0.3) | 8 (0.2) | 11 (0.4) | 7 (0.5) | 1 (0.1) | 2 (0.2) | 5 (0.2) | 22 (0.3) | 2 (0.4) | 0 |
| Autoimmune disease | 65 (0.6) | 34 (1.0) | 10 (0.3) | 7 (0.5) | 5 (0.4) | 9 (1.0) | 29 (1.1) | 32 (0.5) | 2 (0.4) | 2 (1.1) |
| Transplant (Bone marrow/organ) | 48 (0.5) | 11 (0.3) | 23 (0.8) | 7 (0.5) | 2 (0.2) | 5 (0.5) | 6 (0.2) | 39 (0.6) | 3 (0.6) | 0 |
| Disability | 88 (0.9) | 40 (1.1) | 27 (0.9) | 11 (0.7) | 4 (0.3) | 6 (0.7) | 20 (0.7) | 63 (0.9) | 3 (0.6) | 2 (1.1) |
| Characteristics | Race/Ethnicity | Payer status | ||||||||
|---|---|---|---|---|---|---|---|---|---|---|
| Overall | White non-Hispanic | Hispanic (Hispanic with any or unknown race) | Black, non-Hispanic | Unknown | Other | Commercial | Medicaid | Other | Uninsured | |
| Length of stay in days | ||||||||||
| Mean (SD) | 3.4 (6.3) | 3.1 (5.2) | 3.4 (4.8) | 3.9 (8.2) | 3.5 (9.1) | 3.7 (5.9) | 3.0 (4.7) | 3.6 (7.0) | 3.5 (4.5) | 2.9 (4.1) |
| Median (Q1, Q3) | 2 (1, 3) | 2 (1, 3) | 2 (1, 4) | 2 (1, 4) | 2 (1, 3) | 2 (1, 4) | 2 (1, 3) | 2 (1, 4) | 2 (1, 4) | 2 (1, 3) |
| Prolonged length of stay, | 3,858 (37.9) | 1,262 (35.3) | 1,175 (40.7) | 617 (39.8) | 424 (33.4) | 380 (41.7) | 897 (33.1) | 2,683 (39.5) | 225 (44.4) | 53 (30.3) |
| ICU admission, | 2,230 (21.9) | 782 (21.9) | 607 (21.0) | 346 (22.3) | 295 (23.2) | 200 (22.0) | 598 (22.1) | 1,466 (21.6) | 128 (25.2) | 38 (21.7) |
| Length of ICU stay in days | ||||||||||
|
| 2,204 | 774 | 600 | 344 | 288 | 198 | 589 | 1,450 | 127 | 38 |
| Mean (SD) | 4.1 (8.5) | 3.6 (6.8) | 4.0 (5.6) | 5.3 (13.0) | 4.7 (12.0) | 3.9 (5.6) | 3.5 (6.6) | 4.5 (9.5) | 3.5 (4.0) | 3.1 (4.5) |
| Median (Q1, Q3) | 2 (1, 4) | 2 (1, 3) | 2 (1, 4) | 2 (1, 4) | 2 (1, 3.5) | 2 (1, 4) | 2 (1, 3) | 2 (1, 4) | 3 (1, 4) | 1 (1, 3) |
| Prolonged ICU stay, | 863 (39.2) | 272 (35.1) | 258 (43.0) | 151 (43.9) | 102 (35.4) | 80 (40.4) | 201 (34.1) | 586 (40.4) | 66 (52.0) | 10 (26.3) |
| Supplemental oxygen use, | 2,048 (20.1) | 806 (22.6) | 578 (20.0) | 255 (16.4) | 221 (17.4) | 188 (20.6) | 566 (20.9) | 1,323 (19.5) | 125 (24.7) | 34 (19.4) |
| Length of supplemental oxygen in days | ||||||||||
|
| 1,932 | 761 | 541 | 243 | 206 | 181 | 539 | 1,238 | 121 | 34 |
| Mean (SD) | 3.1 (4.4) | 3.0 (4.1) | 3.3 (3.9) | 2.8 (2.9) | 3.7 (6.7) | 3.4 (5.0) | 2.8 (3.1) | 3.3 (4.9) | 3.5 (3.2) | 2.6 (2.8) |
| Median (Q1, Q3) | 2 (1, 4) | 2 (1, 3) | 2 (1, 4) | 2 (1, 3) | 2 (2, 4) | 2 (1, 4) | 2 (1, 3) | 2 (1, 4) | 3 (2, 4) | 2 (1, 2) |
| Prolonged supplemental oxygen, | 803 (41.6) | 304 (39.9) | 246 (45.5) | 89 (36.6) | 90 (43.7) | 74 (40.9) | 189 (35.1) | 543 (43.9) | 64 (52.9) | 7 (20.6) |
| IMV, | 778 (7.6) | 259 (7.2) | 204 (7.1) | 138 (8.9) | 92 (7.2) | 85 (9.3) | 177 (6.5) | 559 (8.2) | 32 (6.3) | 10 (5.7) |
| Length of IMV in days | ||||||||||
|
| 772 | 257 | 201 | 138 | 92 | 84 | 175 | 555 | 32 | 10 |
| Mean (SD) | 5.3 (9.2) | 4.3 (6.1) | 5.2 (8.5) | 6.4 (10.7) | 7.2 (14.9) | 4.6 (6.8) | 3.8 (5.0) | 5.8 (10.3) | 3.6 (4.2) | 4.9 (6.7) |
| Median (Q1, Q3) | 2 (1, 5) | 2 (1, 5) | 2 (1, 5) | 3 (1, 6) | 2 (1, 5) | 3 (1, 5) | 2 (1, 4) | 3 (1, 6) | 2 (1, 4) | 2.5 (2, 4) |
| Prolonged IMV, | 363 (47.0) | 105 (40.9) | 94 (46.8) | 75 (54.3) | 43 (46.7) | 46 (54.8) | 66 (37.7) | 279 (50.3) | 13 (40.6) | 5 (50.0) |
- —Pfizer
Peer Reviews
No public reviews on file for this paper yet. If you reviewed it on a platform where reviews are public (OpenReview, ICLR, NeurIPS, ICML), you can paste yours below so the community can read it here.
Videos
No videos yet. Explain this paper in a talk, walkthrough, or lecture? Add one.
Taxonomy
TopicsCOVID-19 Clinical Research Studies · Respiratory viral infections research · Infectious Encephalopathies and Encephalitis
Introduction
A highly transmissible and pathogenic coronavirus called severe acute respiratory syndrome coronavirus 2 (SARS-CoV-2) has caused a pandemic of COVID-19 which continues to cause hospitalization and death (1–3). Racial and ethnic minority groups and lower-income populations have been disproportionately affected by the pandemic (4, 5). The COVID-19 pandemic has exacerbated health inequalities in the United States which were identified early in the pandemic, as lower-income populations had limited access to SARS-CoV-2 testing presumably done by polymerase chain reaction (PCR) diagnostic technique using conventional nasopharyngeal swabs, and once tested were more likely to test positive (6), and rates for COVID-19 hospitalizations and deaths were higher in racial/ethnic minority groups and low-income neighborhoods (7, 8). According to a Centers for Disease Control and Prevention (CDC) report, which examined demographic trends among US COVID-19 mortality from 01 May–31 August 2020, Black and Hispanic persons were disproportionately affected (9). These disparities have persisted, as evident by the cumulative age-adjusted data, which reveals that Black, Hispanic, American Indian, and Alaska Native (AI/AN) persons are more likely than White people to have COVID-19 cases, hospitalizations, and deaths (10). Racial, ethnic, and socioeconomic disparities have been reported in COVID-19 vaccination coverage as well (11); however, some of these disparities have narrowed over time, likely due to vaccination initiatives to provide equitable access to COVID-19 vaccines (12). In addition, insurance status, a proxy for socioeconomic status (13), is also associated with disproportionate burden of COVID-19 illness and death (14). These health disparities reflect the structural and systemic inequities that shape the distribution of health risks and outcomes in the United States.
Studies characterizing inequalities in COVID-19 outcomes in the US have largely focused on the adult populations and there is a paucity of data in pediatric populations. The objective of this study is to examine disparities in clinical outcomes of infants and children under the age of five hospitalized with COVID-19 by race/ethnicity and insurance status.
Methods
Study design and data source
This study used a retrospective cohort design to characterize hospitalization outcomes among children aged <5 years and hospitalized with COVID-19 (15). The data source was the nationally representative PINC AI™ (formerly Premier) Healthcare Database Special Edition (PHD SR), which covers approximately a quarter of all hospital admissions annually arising from ∼1,400 hospitals in the U.S. The database contains deidentified administrative healthcare data including admission and discharge diagnoses, hospital characteristics, costs of care, laboratory tests performed and discharge status that are derived from hospital discharge information (16). The secondary data used in this study adhered to the Declaration of Helsinki's ethical principles, and was exempted from Institutional Review Board review under the U.S. Department of Health and Human Services' Policy for Protection of Human Research Subjects category 4 exemption (Sterling IRB, Atlanta, GA).
Study population
The study population included infants and children aged <5 years hospitalized with a COVID-19 diagnosis (ICD-10-CM U07.1) in any position between April 2021 and February 2023. The COVID-19 diagnosis was required to be “Present on Admission” to limit nosocomial and incidental COVID-19 infections. Other exclusion criteria were (1) Unknown biological sex and (2) newborns with a birth code (Z38.XX) during admission to limit SARS-CoV-2 infection acquired at time of delivery. Only the first qualifying hospital admission during the study period was included (i.e., no readmissions).
Socio-demographic and clinical characteristics
Demographic and clinical characteristics, including age, sex, race, ethnicity, payer status, and comorbid conditions were assessed. Due to the data structure, age was ascertained in yearly increments; monthly ages of infants aged <1 year were unavailable. The Office of Management and Budget (OMB) race/ethnicity classification was used to categorize the patients by race/ethnicity (17, 18). Race/ethnicity was categorized as a combined variable: Hispanic (Hispanic with any race or Unknown race), White non-Hispanic, Black non-Hispanic, Other (non-Hispanic persons reported as “other” or multiple races or Asian Non-Hispanic), and Unknown race or ethnicity (except known Hispanic with Unknown race) (18). Payer status was categorized into four groups: Commercial, Medicaid, Other (including Medicare due to low numbers of Medicare patients in this age group), and Uninsured. The presence of comorbid conditions was determined using the relevant ICD-10-CM codes in the primary or secondary diagnosis fields.
Outcomes
Disease severity was based on the outcomes of interest which included length of stay (LOS), intensive care unit (ICU) admission, oxygen supplementation, invasive mechanical ventilatory (IMV) support, and prolonged duration of each outcome. Prolonged duration was defined as longer than the median value among all patients who experienced that outcome (>2 days for each outcome) (15).
Statistical analyses
Descriptive statistics were used to summarize the demographic characteristics, comorbid conditions, and hospitalization outcomes for each cohort and stratification. Categorical variables were reported as counts and percentages, whereas continuous variables were summarized using means, medians, standard deviations (SD), and interquartile range (IQR). The associations between the exposures of interest (race/ethnicity and payer status) on each COVID-19 outcome were investigated using multivariable logistic regression additionally adjusting for sociodemographic factors, comorbidities, month of admission and hospital location. Unadjusted and adjusted odds ratios (aOR) and 95% confidence intervals (CIs) for each outcome by race/ethnicity and payer status were reported. All statistical analyses were performed using SAS 9.4 (SAS Institute; Cary, NC, USA).
Results
Study population
The patient selection process is illustrated in Figure 1. Out of all the inpatient admissions recorded in the PINC AI between April 2021 and February 2023, 1,869,491 (15.2%) were children aged <5 years, and 11,221 (0.09%) had a COVID-19 diagnosis in the primary or secondary position present on admission. There were 10,190 patients remaining after study exclusion criteria were applied.
Flow of selection of study cohort.
Social-Demographic and clinical characteristics
The demographic and clinical characteristics of the study population by race/ethnicity and payer status is shown in Table 1. The mean age of the cohort was 0.9 year with 56.4% of the children being under the age of one. White non-Hispanic (35.1%) was the most common race/ethnicity among the children, followed by Hispanic (28.3%) and Black non-Hispanic (15.2%); race/ethnicity was Unknown or Other in 12.5% and 8.9% of children, respectively. Most of the children were male (56.5%), had the primary COVID-19 diagnosis (66.6%), and admitted to urban hospitals (95.1%). Medicaid (66.7%) was the most common payer type among hospitalized children followed by commercial (26.6%), Other (5%), and uninsured (1.7%). Payer status varied by race/ethnicity. The proportion of commercially insured children was the highest among White non-Hispanic group (42.9%), while other racial/ethnic groups ranged between 13.8%–26.1%. On the contrary, the proportion of Medicaid insurance was highest among Black non-Hispanic (82.3%) followed by Hispanic (76.9%) and Non-Hispanic White (50.5%). Less than 3% of children were uninsured in all groups.
Table 1: Socio-demographic and clinical characteristics of children (<5 years of age) hospitalized with COVID-19.
As shown on Table 1, the most common comorbid conditions were immunocompromising status (15.4%), asthma/reactive airway (7.9%), and neurological disease (6.5%). The most common immunocompromising conditions were rheumatologic/other inflammatory condition (3.4%), primary immune-deficiency (3.4%), chronic kidney or end-stage renal disease (2.9%), solid malignancy (1.7%), hematologic malignancy (1.1%), and other condition (6.8%). The prevalence of comorbid conditions varied among races/ethnicities. Some comorbid conditions were more prevalent among Black non-Hispanic than other races/ethnicities. Comorbid conditions which had the highest prevalence among Black non-Hispanic and the lowest among White non-Hispanic were immunocompromising condition (21.3% vs. 13%), neurological disease (7.3% vs. 6%), and sickle cell (8.3% vs. 0.1%). The prevalence of asthma/reactive airway ranged was 11.9% among Black non-Hispanic children and 6.3% among Hispanic children. Rheumatologic/ other inflammatory condition (4%) was the most common among Hispanic children. Comorbid conditions were infrequent among White non-Hispanic children with solid malignancy being the most prevalent (2%). The prevalence of comorbid conditions also varied by payer status. Notably, some conditions were most prevalent among Medicaid and least prevalent among uninsured which included immunocompromising status (16% vs. 8%) and asthma/reactive airway (8.4% vs. 4%).
Clinical outcomes
The distribution of clinical outcomes, overall and stratified by race/ethnicity and payer status are shown in Table 2. The overall median length of hospital stay for children was 2 days (IQR, 1–3), and was consistent across different races/ethnicities and payer types although IQR slightly varied. Overall, 37.9% of children had prolonged length of hospital stay. Adjusted logistic regression analysis showed that Black non-Hispanic children (aOR: 1.2; 95% CI 1.1–1.4), Hispanic children (aOR: 1.3; 95% CI 1.1–1.4) and children of other races (aOR: 1.4; 95% CI 1.2–1.6) were more likely to have a prolonged length of stay compared to White non-Hispanic children (Figure 2). When analyzed by payer type, children with Medicaid (aOR: 1.2; 95% CI 1.1–1.3) and other insurances (aOR: 1.4; 95% CI 1.1–1.7) were more likely to have prolonged length of stay compared to children with commercial insurance (Figure 3).
Table 2: Clinical outcomes among children (<5 years of age) hospitalized with COVID-19.
Odds ratios of in-hospital outcomes among children (<5 years of age) hospitalized with COVID-19 by race/ethnicity. The reference group for all models were White Non-Hispanic children.
Odd ratios of in-hospital outcomes among children (<5 years of age) hospitalized with COVID-19 by payer status.
There were 2,230 (21.9%) children admitted to the ICU. The proportion of ICU admission only slightly varied by race/ethnicity and payer status (Table 1). The overall median length of ICU stay was 2 days (IQR, 1–4) and was consistent across races/ethnicities although IQR slightly varied. By payer type, median length of ICU stay was 2 days (IQR, 1–3) for commercial, 2 days (IQR, 1–4) for Medicaid, 1 day (IQR, 1–3) for non-insured, and 3 days (IQR, 1–4) for Other. The proportion of children with prolonged ICU stay was 39.2%. Black non-Hispanic (aOR: 1.4; 95% CI 1.1–1.9), Hispanic (aOR: 1.4; 95% CI 1.1–1.9) and other races (aOR: 1.4; 95% CI 1.0–2.1) had higher odds of having a prolonged length of ICU stay compared to White non-Hispanic (Figure 2). When analyzed by payer type, only those with other insurance had higher odds (aOR: 1.7; 95% CI 1.1–2.6) of having a prolonged length of ICU stay compared to commercial (Figure 3).
The overall proportion of infants and children that required IMV during COVID-19 hospitalization was 7.6% (*n *= 778). The proportion varied among races/ethnicities and ranged between 9.3% (Other) and 7.1% (Hispanic). By payer type, it ranged between 8.2% (Medicaid) and 5.7% (non-insured). The overall median length of IMV use was 2 days (IQR, 1–5) and consistent among races/ethnicities, except for Non-Hispanic blacks (median 3 days, IQR: 1–6) and other races (median 3 days, IQR: 1–5). By payer status also the median length of IMV use ranged between 2 and 3 days. Black non-Hispanic children (aOR: 1.8; 95% CI 1.1–3.0), and children from Other races (aOR: 2.3; 95% CI 1.3–4.1) were more likely to have prolonged IMV use compared to White non-Hispanic children while there was no evidence for differences by payer status.
Supplemental oxygen was used by 2,048 (20.1%) of infants and children hospitalized with COVID-19. The proportion of supplemental oxygen use varied both by race/ethnicity (ranged between White non-Hispanic 22.6% and Black non-Hispanic 17.7%) and by payer type (ranged between Unknown 24.7% and uninsured 19.4%). However, after adjustment, Hispanic children (aOR: 1.2; 95% CI 1.0–1.3) and children from Other races (aOR: 1.3; 95% CI 1.0–1.5) had higher odds of supplemental oxygen use compared to White non-Hispanic children. The overall median length of supplemental oxygen use was 2 days (IQR, 1–4). Medicaid insured (aOR: 1.3; 95% CI 1.0–1.7) and other insurance groups (aOR: 1.6; 95% CI 1.1–2.5) had higher odds of prolonged use of supplemental oxygen, however no evidence for differences was observed among races/ethnicities.
Discussion
This retrospective study examined the disparities in clinical outcomes of a nationally representative cohort of infants and children (*n *= 10,190) aged under 5 years hospitalized with COVID-19 by race/ethnicity and insurance type. Results of this study indicate that Black non-Hispanic, Hispanic, and Other race/ethnicities had higher odds of prolonged-hospital and -ICU stay than White non-Hispanic children. Similarly, children with Medicaid and Other insurance, independent of their race/ethnicity, had higher odds of having a prolonged hospital stay than children with commercial insurance. In addition, we also observed disparities in the use of oxygen and IMV by race/ethnicity and insurance type. These results suggest that there are differences in the clinical outcomes of children hospitalized with COVID-19 by race/ethnicity and insurance type, mirroring the trends observed among the adult populations (4).
In our analysis, we have used length of hospital stay, ICU stay and the use of IMV and supplemental oxygen as a representation of disease severity for COVID-19. The overall median length of hospital stay, and ICU stay for children was 2 days for each outcome and consistent across races/ethnicities. We modelled the dichotomous measure of duration (prolonged vs. non prolonged). Adjusted statistical analysis showed that Black non-Hispanic children, Hispanic children and children of other races had higher odds of prolonged length of both hospital stay and ICU stay compared to White non-Hispanic children. We saw more variability in median length of IMV days across study groups ranging from 2 days for White non-Hispanic, Hispanic, and other races to 3 days for Black non-Hispanic, and unknown races. Upon statistical analysis, prolonged IMV days showed similar association as hospital/ICU prolonged stay with the race/ethnicity except for Hispanic children. However, the results are less clear with the use of oxygen. We did not see any association between prolonged oxygen use and race/ethnicity. Interestingly, although it did not meet statistical significance, there was a higher tendency for White non-Hispanic patients to be on oxygen compared to Black non-Hispanic. This could be because of racial and ethnic discrepancy in delayed identification of treatment eligibility among patients with COVID-19 as reported earlier (19).
Our findings are consistent with previous studies that assessed ethnic and racial disparities in pediatric COVID-19 hospitalizations and outcomes (20). A CDC report which included results from March 2020–March 2022 estimated that Black, Hispanic, and American Indian & Alaska Native (AI/AN) children were twice as likely to be hospitalized compared to Non-Hispanic White children (21). Another CDC study among US individuals aged <21 years reported that Hispanic, Black, and AI/AN persons accounted for 75% of COVID-19 deaths in persons aged <21 years although these groups represented only 41% of the US population in this age group (22). A large population-based study from England also showed that Black children and children of mixed or other backgrounds had significantly longer hospital stay compared with White children (23).
Association between insurance status/type and pediatric COVID-19 outcomes is less well defined because of paucity of data. However, our findings are consistent with the results obtained from studies on adult populations. A retrospective cohort analysis of COVID-19 patients at Sutter Health system in northern California reported that compared to individuals with Commercial insurance, those with Medicaid, self-pay patients, or no reported insurance had a twice as high likelihood of admission for COVID-19 (24, 25). Having access to insurance lowered the risk of dying from COVID-19 but had no significant association with the rate of infection (26).
Results from COVID-19 studies have heightened the pre-existing health disparities in the US. These disparities in COVID-19 outcomes among different racial and ethnic communities have not been conclusively attributed to any genetic or epigenetic markers, although it is plausible that such biological factors may impact the COVID-19 outcomes along with the non-biological factors. These are likely the results of underlying social determinants of health that affect the risk of exposure, transmission, and severity of COVID-19 among children from minority communities (27, 28). These factors include persistent poverty, crowded living conditions, limited access to health care, lack of health insurance, language barriers, cultural beliefs, and discrimination (29). Moreover, children from minority communities may have higher rates of comorbidities that increase the risk of severe COVID-19, such as asthma, obesity, diabetes, and immunosuppression (29). These factors reflect the longstanding structural and systemic inequities.
Our study has several limitations. First, we used data from a single database that may only be representative of some pediatric COVID-19 hospitalizations in the US. Second, we did not have information on some critical variables that may affect outcomes, such as SARS-CoV-2 variant, number of household contacts, and any treatments received in an outpatient setting prior to admission. Third, COVID-19 vaccination status for the children or for the mother (which is more relevant for children <1 year) was unavailable. COVID-19 vaccination was first authorized for children 6 months to 5 or 6 years of age group on June 17, 2022. Approximately 35% of children included in this study were recruited between July 2022 and February 2023. Considering that only 5.1% of US children aged 6 months to 5 years had completed the primary series of COVID-19 vaccinations as of 31 December 2022 (30), this would likely not have impacted the severity of endpoints in this study. However, it is important to note that there are disparities in COVID-19 vaccination uptake by race/ethnicity in the US (31) which could affect the risk of infection and hospitalization for different groups of children. Fourth, children may have been admitted for reasons other than COVID-19. Requiring that the COVID-19 diagnosis be present on admission may have limited some incidental infections. Fifth, for some outcomes (such as prolonged IMV) lack of associations and wide 95% CIs may have been due to a low number of events. Sixth, information about race was unknown for 12.5% of the children. In addition, there may be residual confounding as social economic status variables other than payer status were not available. Finally, information from other facilities for children who transferred was not available, therefore the duration of some endpoints may be undercounted.
Conclusion
This study revealed disparities in the clinical outcomes of infants and children hospitalized with COVID-19 by race/ethnicity, and insurance type. These findings underscore the need for more research to understand the causes and consequences of these disparities and develop strategies to reduce them. Moreover, these findings emphasize the importance of ensuring equitable access to preventive measures, testing, treatment, and vaccination for pediatric COVID-19 patients from vulnerable populations.
The reference list from the paper itself. Each links out to its DOI / PubMed record.
- 1Centers for Disease Control and Prevention. Risk for COVID-19 Infection, Hospitalization, and Death by Race/Ethnicity. (2023).
- 2WHO COVID-19 Dashboard. World Health Organization. (2020). (cited September 1, 2023). Available online at: https://covid 19.who.int/
- 3COVID Data Tracker. U.S. Department of Health and Human Services, CDC. (2023). (cited September 1, 2023). Available online at: https://covid.cdc.gov/covid-data-tracker
- 4Magesh S John D Li WT Li Y Mattingly-App A Jain S Disparities in COVID-19 outcomes by race, ethnicity, and socioeconomic status: a systematic-review and meta-analysis. JAMA Netw Open. (2021) 4(11):e 2134147. 10.1001/jamanetworkopen.2021.3414734762110 PMC 8586903 · doi ↗ · pubmed ↗
- 5Khanijahani A Iezadi S Gholipour K Azami-Aghdash S Naghibi D. A systematic review of racial/ethnic and socioeconomic disparities in COVID-19. Int J Equity Health. (2021) 20(1):248. 10.1186/s 12939-021-01582-434819081 PMC 8611382 · doi ↗ · pubmed ↗
- 6Lieberman-Cribbin W Tuminello S Flores RM Taioli E. Disparities in COVID-19 testing and positivity in New York city. Am J Prev Med. (2020) 59(3):326–32. 10.1016/j.amepre.2020.06.00532703702 PMC 7316038 · doi ↗ · pubmed ↗
- 7Garg S Kim L Whitaker MO'Halloran A Cummings C Holstein R Hospitalization rates and characteristics of patients hospitalized with laboratory-confirmed coronavirus disease 2019—COVID-NET, 14 states, March 1–30, 2020. MMWR Morb Mortal Wkly Rep. (2020) 69(15):458–64. 10.15585/mmwr.mm 6915 e 332298251 PMC 7755063 · doi ↗ · pubmed ↗
- 8Wadhera RK Wadhera P Gaba P Figueroa JF Joynt Maddox KE Yeh RW Variation in COVID-19 hospitalizations and deaths across New York city boroughs. JAMA. (2020) 323(21):2192–5. 10.1001/jama.2020.719732347898 PMC 7191469 · doi ↗ · pubmed ↗