Adiponectin rs1501299 and chemerin rs17173608 gene polymorphism in children with type 1 diabetes mellitus: relation with macroangiopathy and peripheral artery disease
N. Y. Salah, S. S. Madkour, K. S. Ahmed, D. A. Abdelhakam, F. A. Abdullah, R. A. E. H. Mahmoud

TL;DR
This study explores how gene variations in children with type 1 diabetes may be linked to higher cholesterol and signs of artery disease.
Contribution
The study identifies associations between adiponectin and chemerin gene polymorphisms and macrovascular risk in children with T1DM.
Findings
Children with T1DM and specific gene variants had higher cholesterol and lower HDL-C.
Abnormal ABI in T1DM children was significantly linked to chemerin and adiponectin gene alleles.
Cholesterol and ABI were independently associated with these gene polymorphisms.
Abstract
Although macrovascular complications represent the leading cause of mortality in type 1 diabetes mellitus (T1DM), the prevalence of subtle macrovascular affection including peripheral artery disease (PAD) among children with T1DM and its genetic predictors remains to be unraveled. Increasing evidence suggests a link between adiponectin rs1501299 and chemerin rs17173608 gene polymorphism and atherogenesis, and insulin resistance. Hence, this study assess the prevalence of these variants among children with T1DM in comparison to healthy controls and their association with macrovascular complications, namely PAD and hyperlipidemia. Fifty children with T1DM and 50 matched controls underwent a thorough assessment including adiponectin rs1501299 and chemerin rs17173608 gene polymorphisms, fasting lipids, glycated hemoglobin (HbA1c), and ankle–brachial index (ABI). Cochran–Armitage trend test…
Genes, proteins, chemicals, diseases, species, mutations and cell lines named across the full text — each resolved to its canonical identifier and authoritative record.
Click any figure to enlarge with its caption.
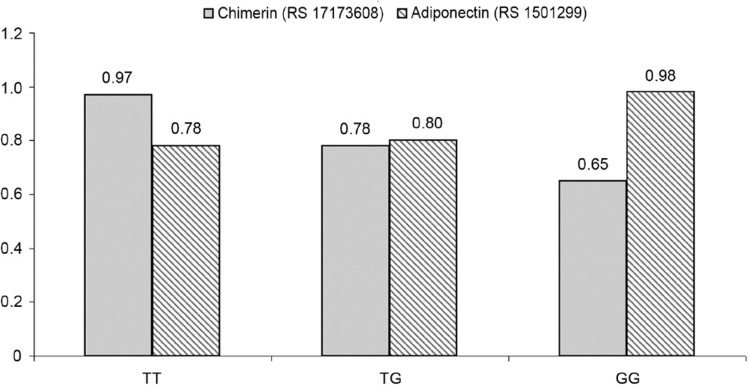 Figure 1
- —Ain Shams University
Peer Reviews
No public reviews on file for this paper yet. If you reviewed it on a platform where reviews are public (OpenReview, ICLR, NeurIPS, ICML), you can paste yours below so the community can read it here.
Videos
No videos yet. Explain this paper in a talk, walkthrough, or lecture? Add one.
Taxonomy
TopicsPeripheral Artery Disease Management · Lymphatic System and Diseases · Adipokines, Inflammation, and Metabolic Diseases
Introduction
Diabetes with its two major types, type 1 (T1DM) and type 2 (T2DM), has long been recognized as a major risk factor for the development of vascular disease [1]. In adults, macrovascular complications are the leading cause of diabetes-related morbidity and mortality, namely coronary, cerebrovascular, and peripheral arterial disease (PAD) [2]. However, in childhood T1DM, the role of macrovascular complications is underestimated with more focus on diabetic microvascular complications.
While macrovascular complications are rare until adulthood, early subtle macrovascular changes have been shown to present since childhood, making children with T1DM at risk of early adult-onset vascular disease [3]. Predictors of PAD include glycemic and lipid derangements, diabetes duration, hypertension, and male gender [4]. However, not all people with T1DM having poor glycemic and lipid control develop PAD. Moreover, aggressive glycemic control to lower the HbA1c did not appear to reduce the rate of PAD in those at risk as observed in the DCCT/EDIC study [5]. Hence, understanding the genetic determinants of the risk of PAD among this vulnerable population is of utmost importance.
Ankle–brachial index (ABI), i.e., the ratio of ankle-to-brachial systolic blood pressure, is the gold standard noninvasive method for PAD diagnosis [6]. According to the AHA, an ABI ≤ 0.90 is considered PAD. ABI can detect PAD, with > 50% stenosis with sensitivity 61–73% and specificity 83–96% [7].
Increasing evidence suggests a link between adipokines, diabetes, and vascular diseases including PAD [8]. Two of the most well-known adipokines, adiponectin and chemerin, have been associated with metabolic, inflammatory, and atherosclerotic diseases. Serum adiponectin levels have been associated with vascular events and/or mortality from vascular diseases [9]. Chemerin, an adipokine highly expressed in the white adipose tissue, is associated with inflammation and adipogenesis. Chemerin not only regulates the expression of adipocyte genes linked with glucose and lipid homeostasis, but also affects innate and adaptive immunity as well as cytokine homeostasis. Furthermore, it has a role in fibrinolysis, coagulation, and inflammation [10]. Hence, adipokines could serve as a mechanistic link between diabetes, metabolic derangements, and PAD. There remains uncertainty, however, about the strength of associations between PAD and individual adipokines with some studies suggesting that these associations are mediated through diabetes [11].
Adiponectin level is influenced by the presence of genetic variation in its coding genes. Polymorphisms in ADIPOQ, which codes for adiponectin, have been associated with diabetes and metabolic syndrome in multiple populations [12]. Nonetheless, genetic variation in the ADIPOQ promoter has been associated with vascular disease independent of adiponectin level [13].
Variants of retinoic acid receptor responder 2 (RARRES2), the gene encoding chemerin, have been demonstrated to be associated with increased chemerin levels, visceral fat mass in nonobese individuals, and increased incidence of metabolic syndrome [14]. Several experimental studies suggest an inflammatory role for chemerin during the early stages of vascular diseases [15]. But it is currently still not clear whether an association between chemerin gene polymorphism and PAD exists. Some case–control studies have shown that higher circulating chemerin levels are associated with clinical and subclinical vascular diseases [16, 17], whereas others did not confirm these findings [18, 19].
Hence, this study aims to assess the frequency of adiponectin and chemerin gene polymorphism among children with T1DM in comparison to healthy control and to investigate their potential association with macrovascular complications, namely PAD and hyperlipidemia among this vulnerable cohort.
Methodology
Study design
This cross-sectional controlled study included 50 children with T1DM and 50 age—and gender-matched healthy controls. Children with T1DM were recruited from the pediatric and adolescents diabetes unit, Ain Shams University, while the controls were recruited from the outpatient clinic during the period from December 2021 to May 2022. T1DM was defined according to the criteria of the International Society of Pediatric and Adolescent Diabetes [20]. Inclusion criteria for T1DM children were age 8–18 years and diabetes duration of ≥ 1 year. Exclusion criteria included patients with other types of diabetes, e.g., T2DM and maturity-onset diabetes of the youth (MODY), patients with obesity, hypertension, or cardiovascular diseases, and patients with comorbid disorders that might cause PAD, e.g., systemic lupus and autoimmune thyroiditis.Fig. 1. Relation of ABI to chemerin and adiponectin gene variants among the studied children with T1DM
Ethical considerations
The study was approved by the Research Ethics Committee of Ain Shams University with an approval number of R 31/2021. Written informed consent was obtained from each subject and his legal guardian before enrollment in the study.
Procedure
Clinical assessment
All included children were subjected to thorough medical history including patients' age, gender, family history of T1DM, diabetes duration, insulin therapy, and history of chronic microvascular diabetic complications (retinopathy, neuropathy, and nephropathy).
Clinical examination was done laying stress on anthropometric measures with the calculation of standard deviation score and body mass index (BMI) measured as kg/m^2^ [21].
Blood pressure (BP) was measured manually, two consecutive times, by a sphygmomanometer in the right arm of a relaxed, seated child with comparison of values to normal reference percentiles [22].
Laboratory assessment
Blood sampling
All blood samples were drawn after an overnight (10–12 h) fasting. Under complete aseptic condition, ten (10) mL of venous blood was withdrawn by venipuncture from each subject. Samples were divided into three aliquots: the first one was collected in vacutainer tubes (BD Diagnostics) containing tri-potassium ethylenediaminetetraacetate (k3 EDTA) and mixed gently and transferred immediately into appropriate containers in the laboratory, whereby DNA extraction was performed, and the DNA yields were stored at − 80 °C for genotyping.
The second aliquot was collected in plain vacutainer tubes for serum preparation. The serum is intended for measurement of lipid profile. The third aliquot was separated on ethylenediaminetetraacetic acid (1.2 mg/mL) for analysis of HbA1c.
DNA isolation and single-gene polymorphism genotyping
Genomic DNA was extracted from peripheral blood leukocytes using DNA purification mini-kit; QIAamp^®^ (Qiagen, Switzerland). All centrifugation steps for QIAamp mini spin columns were done at 6000 × g (8000 rpm) for 1 min at room temperature. The concentration and purity of the isolated DNA were checked using UV–vis absorption spectroscopy at λ260 nm by the Invitrogen Qubit^®^ 3.0 Fluorometer to measure the quantity of extracted DNA.
The genes chemerin [rs17173608 (T > G)] located in chromosome 7:150339575 (GRCh38.p13) within the noncoding regions and adiponectin [rs1501299 (G > T)] located in chromosome 3:186853334 (GRCh38.p13) within the adiponectin gene intron variant listed in the National Center for Biotechnology Information SNP database (http://www.ncbi.nlm.nih.gov/SNP) [23] were analyzed by RT-PCR using TaqMan^®^ genotyping master mix (Applied Biosystems, USA).
Genotyping of chemerin rs17173608 and adiponectin rs1501299 variant was performed using TaqMan allelic discrimination assay as recommended by Applied Biosystems International (ABI) [24], using the readymade genotyping assay kit supplied by ThermoFisher^®^ (ThermoFisher Scientific, USA) containing sequence-specific forward and reverse primers and two fluorescents (VIC/FAM) labeled TaqMan probes for distinguishing between the two alleles. The presence to the absence of the SNP and the allelic discrimination was established according to the type of the emitted fluorescence of either of the reporter dyes or both at the same time.
The reaction plates were loaded into the DT-lite Real-Time PCR System and amplification was performed according to the following protocol: initial heat activation at 95 °C for 10 min, DNA denaturation at 95 °C for 15s, followed by annealing at 60 °C for 60s for 40 cycles.
The data were analyzed and presented on the multicomponent plot for allelic discrimination of alleles.
1 versus Allele.
2 using Applied.
Biosystem, step I version software analysis modules.
Biochemical assessment
Fasting triglycerides, high-density lipoproteins (HDL-C), and total cholesterol were measured by standard automated methods on AU680 Beckman Coulter autoanalyzer (Beckman Coulter, Inc., Brea, CA) at Central Laboratories at Ain Shams Hospitals. LDL-C was estimated by Friedewald equation. Results were clinically interpreted according to recommendations of the European Atherosclerosis Society [25]. HbA1c was assessed using D-10 (Bio-Rad, France) [26].
Radiological assessment
The ankle–brachial index was assessed by two blinded experienced radiologists who assessed the patients separately and the mean score of both was taken for each subject. The subject was instructed to lie in the supine position. For measuring the brachial pressure, a fitting sphygmomanometer cuff was placed on the arm, with the upper limb at the same level as the heart. The ultrasound probe was put on the patient's antecubital fossa over the site of brachial artery pulsation. The cuff was inflated to about 10–20 mmHg above the expected systolic blood pressure of the patient till the duplex color and pulsed wave signal disappeared. Then slowly the cuff was deflated at approximately 1 mmHg/s. The brachial systolic pressure is the pressure when the duplex color and pulse wave signal re-appeared.
For assessing the ankle pressure, the sphygmomanometer cuff was placed just proximal to the malleoli. The ultrasound probe was placed slightly lateral to the midline of the dorsum of the foot to detect the dorsalis pedis color flow and pulse wave signal to measure the systolic blood pressure in the same steps done in the brachial artery systolic blood pressure measurement. Then the ultrasound probe was located posterior to the medial malleolus to detect the color flow and pulse wave signal of the posterior tibial artery in the foot. Both measurements were recorded on both legs.
The ABI was calculated for each leg separately by taking the higher pressure of the dorsalis pedis artery and posterior tibial artery and dividing it by the highest brachial arterial systolic pressure in both arms. Then the mean ABI was calculated for each subject [27].
Statistical analysis
Data were collected, revised, coded, and entered into the Statistical Package for Social Science (IBM SPSS) version 25. The Kolmogorov–Smirnov test was used to examine the normality of data. Quantitative data were presented as mean, standard deviations, and ranges when their distribution was found parametric and median with inter-quartile range (IQR) when their distribution was found non-parametric. Qualitative data were presented as numbers and percentages. The one-way ANOVA test was used to compare parametric data sets, whereas non-parametric variables were compared using the Mann–Whitney test. Qualitative variables were compared using Chi-square (X^2^) test. To validate that genotype distribution follows Hardy–Weinberg equilibrium (HWE) model, goodness-of-fit Chi-square test was used. A Cochran–Armitage trend test was used to decide the risk allele and evaluate the association between the candidate variant and PAD using a case–control design [28]. Before multiple linear regression analysis, several variables were log-transformed to obtain an approximate normal distribution. Simple regression analysis was first performed to screen potential associations, followed by a multivariate stepwise linear regression model to identify and determine significant associations for chemerin and adiponectin gene polymorphism. Using the approach of stepwise variable selection, stepping up, only variables with a significance level of 0.05 were included in the model. Spearman correlation coefficients were used to assess the correlation between two quantitative parameters in the same group. The confidence interval was set to 95% and the margin of error accepted was set to 5%. So, the p value was considered significant at the level of < 0.05.
Results
Fifty children with T1DM (26 males and 24 females; ratio 1.08:1) were studied. Their mean age was 11.09 ± 2.26 years, range 8–16, and their mean HbA1c was 9.72 ± 2.03%, range 6.6–13.7. They were compared to 50 age—and gender-matched healthy controls (p = 0.07 and p = 0.42, respectively). The clinical, laboratory, and radiological data of the studied children with T1DM and controls are listed in Table 1.Table 1. Clinico-laboratory and radiological characteristics of the studied children with T1DM and controlsChildren with T1DMControlsP valueNo. = 50No. = 50Clinico-demographic dataAge (years)Mean ± SD11.09 ± 2.2610.22 ± 2.470.070•Range8–166.08 ± 13.07GenderFemale24 (48.0%)20 (40.0%)0.420Male26 (52.0%)30 (60.0%)Weight Z-scoreMedian(IQR)− 0.75 (− 1.09 to − 0.11)− 0.99 (− 1.12 to − 0.68)0.076^‡^Range− 1.78 to 0.56− 1.2 to − 0.27Height Z-scoreMedian(IQR)− 0.59 (− 1.16 to 0.55)− 0.8 (− 1.54 to − 0.13)0.055^‡^Range− 2.39 to 1.72− 1.73 to 0.73BMI (kg/m^2^)Mean ± SD16.95 ± 1.8516.39 ± 1.370.091**•Range13.85–20.9313.85–19.76BMI Z-scoreMedian(IQR)− 0.79 (− 0.86 to − 0.58)− 0.79 (− 0.85 to − 0.72)0.403^‡^Range− 1.03 to − 0.31− 1.03 to − 0.43Systolic blood pressure percentileMean ± SD60.40 ± 17.7255.60 ± 14.020.136•Range50–9050–90Diastolic blood pressure percentileMean ± SD57.20 ± 15.5255.60 ± 14.020.590•**Range50–9050–90Laboratory dataCholesterol (mg/dl)Mean ± SD179.31 ± 50.58153.12 ± 19.52**0.001•Range35–285123–179HDL (mg/dl)Mean ± SD46.60 ± 11.4958.28 ± 5.56 < 0.001•Range30–7048–68LDL (mg/dl)Mean ± SD109.30 ± 40.12101.42 ± 18.960.212•Range22–20169–129Triglycerides (mg/dl)Mean ± SD115.49 ± 94.8686.26 ± 16.160.034•Range25–50348–114HbA1C%Mean ± SD9.72 ± 2.034.49 ± 0.50 < 0.001•**Range6.6–13.73.7–5.3Chimerin (RS17173608)TT3 (6.0%)12 (24.0%)0.041TG6 (12.0%)5 (10.0%)GG41 (82.0%)33 (66.0%)T/G0.12/0.880.29/0.710.003Adiponectin (RS1501299)GG21 (42.0%)31 (62.0%)0.011GT10 (20.0%)13 (26.0%)TT19 (38.0%)6 (12.0%)G/T0.52/0.480.75/0.250.001Radiological dataAnkle–brachial indexMean ± SD0.86 ± 0.261.05 ± 0.13**0.011•**Range0.5–1.50.92–1.17Bold values indicates significant valuesT1DM* type 1 diabetes mellitus; BMI body mass index; HbA1C glycated hemoglobin; LDL low-density lipoproteins; HDL high-density lipoproteins*Chi-square test•Independent t test^‡^Mann–Whitney test; p value < 0.05: significant
Peripheral artery disease among children with T1DM
The mean ankle–brachial index of the studied children with T1DM was 0.86 ± 0.26; range 0.5–1.5, while that of the controls was 1.05 ± 0.13; range 0.92–1.17. Children with T1DM had significantly lower ABI than controls (p = 0.011).
Although ABI was significantly correlated to diabetes duration (r = 0.450), insulin dose (r = 0.318), cholesterol (r = 0.336), LDL (r = 0.441) and negatively correlated to HDL (r = − 0.280) among the studied children with T1DM, it was not correlated to HbA1C (r = 0.129), Table 2.Table 2. Correlation of ankle–brachial index with various clinico-laboratory parameters among the studied children with T1DMAnkle–brachial indexr**P valueAge (years)− 0.1880.192Diabetes duration (years)0.4500.001Weight z-score0.1990.165Height z-score0.3240.022BMI z-score0.0640.660Insulin dosage (IU/kg/day)0.3180.024Cholesterol (mg/dl)0.3360.017HDL (mg/dl)− 0.2800.049LDL (mg/dl)0.441**0.001**Triglycerides (mg/dl)0.0050.975HbA1C%0.1290.374Bold values indicates significant valuesT1DM type 1 diabetes mellitus; BMI body mass index; HbA1C glycated hemoglobin; LDL low-density lipoproteins; HDL high-density lipoproteinsSpearman correlation coefficients, P < 0.05: significant
Chemerin and adiponectin gene polymorphism among children with T1DM
Regarding chemerin and adiponectin gene polymorphisms, GG (mutant) chemerin genotype was detected in 41 children with T1DM (82.0%), while TT (mutant) adiponectin genotype was detected among 19 children with T1DM (38.0%).
Children with T1DM had significantly higher GG (mutant) chemerin polymorphism (p = 0.041) and TT (mutant) adiponectin polymorphism (p = 0.011) than controls, Table 1.
Upon assessing the relation of chemerin and adiponectin gene variants and clinico-laboratory and radiological parameters among the studied children with T1DM, those having GG chemerin variant and those having TT adiponectin variant had significantly higher cholesterol (p < 0.001 and p < 0.001) with significantly lower HDL-C (p = 0.012 and p = 0.023) and ABI (p = 0.017 and p = 0.035) than those having the other two variants; Table 3.Table 3. Distribution of different chimerin and adiponectin gene variants in relation to the clinico-laboratory and radiological parameters among the studied children with T1DMChimerin(RS17173608)Test valueP valueAdiponectin(RS1501299)Test valueP valueTTTGGGTTTGGGNo. = 3No. = 6No. = 41No. = 19No. = 10No. = 21Diabetes duration (years)Median (IQR)6 (5–7)7.5 (5–9)7 (5–9)0.481**‡0.7867 (5–10)7 (5–8)6 (5–8)1.523‡0.467Range5–74–122–132–132–122–13BMI z scoreMedian (IQR)− 0.48 (− 0.58–− 0.43)-0.34 (-0.43–-0.31)-0.32 (-0.61–0.02)1.007‡0.604− 0.27 (− 0.50–0.10)− 0.44 (− 0.60–− 0.18)− 0.37 (− 0.61–− 0.18)2.428‡0.297Range− 0.58–− 0.43− 0.45–-− 0.18− 0.87–1.37− 0.87–4.26− 0.79–1.33− 0.86–4.37Nephropathy0 (0.0%)1 (16.7%)8 (19.5%)0.7290.6944 (21.1%)1 (10.0%)4 (19.0%)0.5690.752Neuropathy0 (0.0%)0 (0.0%)4 (9.8%)0.9540.6212 (10.5%)1 (10.0%)1 (4.8%)0.5180.772Cholesterol (mg/dl)Mean ± SD96.33 ± 53.35128.33 ± 28.44192.84 ± 42.3912.598•**** < 0.001213.00 ± 50.97152.10 ± 30.15161.79 ± 41.839.253**•** < 0.001Range35–13278–156138–285132–28578–18135–228HDL (mg/dl)Mean ± SD51.67 ± 16.5058.50 ± 6.0244.49 ± 10.774.859•0.01240.99 ± 9.1050.20 ± 14.5349.95 ± 10.314.101•0.023Range35–6850–6530–7030–6030–7035–68LDL (mg/dl)Mean ± SD86.33 ± 10.6079.67 ± 38.40115.32 ± 39.672.777•0.072117.79 ± 36.7791.60 ± 27.88110.05 ± 46.381.427•0.250Range75–9630–13022–20152–20130–13022–201Triglycerides (mg/dl)Mean ± SD58.33 ± 30.5778.50 ± 32.56125.08 ± 101.481.221•0.304149.00 ± 135.0788.84 ± 39.5097.86 ± 56.342.024•0.143Range29–9025–12429–50356–50329–15325–196HbA1C %Mean ± SD9.20 ± 2.518.97 ± 2.409.87 ± 1.970.612•0.5469.73 ± 1.8310.00 ± 1.819.58 ± 2.350.140•0.870Range6.8–11.87–126.6–13.77–12.97–126.6–13.7Ankle–brachial indexMean ± SD0.97 ± 0.220.78 ± 0.230.65 ± 0.224.456•**0.0170.78 ± 0.240.80 ± 0.140.98 ± 0.293.607•0.035Range0.5–1.50.53–0.990.55–0.980.5–1.490.53–0.980.65–1.5Bold values indicates significant valuesT1DM type 1 diabetes mellitus; BMI body mass index; HbA1C glycated hemoglobin; LDL low-density lipoproteins; HDL high-density lipoproteins•On–way ANOVA^‡^Kruskal–Wallis test*Chi-square test; p value < 0.05: significant
Chemerin and adiponectin gene polymorphism in relation to peripheral artery disease
As shown in Fig. 1 and Table 4, the G chemerin allele and the T adiponectin allele were found to be significantly associated with abnormal ABI (p = 0.017 and p = 0.022, respectively). Moreover, the chemerin TT polymorphism was found to be significantly related to ABI in the co-dominant and recessive models (p = 0.017 and p = 0.030), while the adiponectin TT polymorphism was found to be significantly associated with abnormal ABI in the co-dominant model (p = 0.044).Table 4. Associations of chimerin and adiponectin gene polymorphism with the risk of PAD among children with T1DMAdiponectin(RS1501299)AbnormalABINormalABIOR(95% CI)P valueOR(95% CI)P valueChimerin*(RS17173608)AbnormalABINormalABIOR(95% CI)P valueOR(95% CI)P valueNo. = 14No. = 36No. = 14No. = 36Codominant TT8 (57.1%)11 (30.6%)RefRefTT7 (50.0%)34 (94.4%)RefRef GT3 (21.4%)6 (16.7%)0.217 (0.047–0.993)0.0490.198 (0.041–0.956)0.044TG5 (35.7%)1 (2.8%)0.103 (0.008–1.298)0.0790.288 (0.018–4.511)0.375 GG3 (21.4%)19 (52.8%)0.316 (0.05–1.998)0.2210.343 (0.052–2.267)0.267GG2 (14.3%)1 (2.8%)0.041 (0.004–0.409)0.0060.053 (0.005–0.591)0.017Recessive TT8 (57.1%)11 (30.6%)RefRefGG2 (14.3%)1 (2.8%)RefRef GT + GG6 (42.9%)25 (69.4%)3.03 (0.848–10.835)0.0883.461 (0.898–13.337)0.071TG + TT12 (85.7%)35 (97.2%)5.833 (0.484–70.244)0.1652.371 (0.159–35.335)0.531Dominant TG + TT11 (78.6%)17 (47.2%)RefRefTG + GG7 (50.0%)3 (8.3%)RefRef GG3 (21.4%)19 (52.8%)4.098 (0.976—17.202)0.0544.211 (0.973—18.231)0.055TT7 (50.0%)33 (91.7%)11.000 (2.267–53.372)0.0036.310 (1.195—33.329)0.030Allele T19 (67.9%)28 (38.9%)RefRefT19 (67.9%)69 (95.8%)RefRef G9 (32.1%)44 (61.1%)3.317 (1.317–8.357)0.0113.300 (1.191–9.140)0.022G9 (32.1%)3 (4.2%)10.895 (2.682–44.262)0.0015.995 (1.375–26.136)0.017Bold values indicates significant valuesAdjusted for age and gender, p value < 0.05: significant
Upon performing univariate and multivariate regression analyses for factors associated with chemerin and adiponectin gene polymorphism among children with T1DM, cholesterol and ABI were the significant independent variables related to chemerin (p = 0.03 and p = 0.038, respectively); as for adiponectin gene polymorphism, it was independently related to cholesterol, triglycerides, and ABI (p = 0.016, p = 0.023, and p = 0.021), Table 5.Table 5. Univariate and multivariate logistic regression analysis (using backward Wald method) for factors associated with chimerin GG polymorphism and adiponectin TT polymorphism among children with T1DMChimerinAdiponectinUnivariateMultivariateUnivariateMultivariateOR (95% C.I.)P valueOR (95% C.I.)P valueOR (95% C.I.)P valueOR (95% C.I.)P valueCholesterol (mg/dl)1.143 (1.038–1.259)0.0071.212 (1.019–1.440)****0.0301.032 (1.012–1.053)0.0021.028 (1.005–1.052**)0.016**HDL (mg/dl)0.907 (0.842–0.978)****0.0110.921 (0.864–0.981)0.011––LDL (mg/dl)1.027 (1.003–1.052)****0.0311.007 (0.999–1.016)0.093––Triglycerides (mg/dl)1.017 (0.997–1.038)0.09423.388 (1.712–319.465)**0.01817.541 (9.053–44.911)****0.023Ankle–brachial index11.000 (2.267–53.372)0.0036.512 (1.177–31.418)0.03816.250 (1.917–137.778)0.01113.232 (1.839–127.572)**Bold values indicates significant valuesT1DM type 1 diabetes mellitus; LDL low-density lipoproteins; HDL high-density lipoproteinsP value < 0.05: significant
Discussion
Subclinical PAD detected as increased ABI has been documented among youth with T1DM. This subclinical vascular affection is recognized as a strong independent predictor for future cardiovascular and cerebrovascular morbidity and mortality [29, 30]. PAD is a complex dynamic process modified by a variety of molecular signaling pathways and genetic determinants [31]. An imbalance between pro-inflammatory and anti-inflammatory cytokines is among the suggested pathways.
Polymorphism of the genes encoding these adipokines may play a role in this process. Hence, assessing the role of these adipokines polymorphisms in the occurrence of PAD among children with T1DM is of utmost important aiming to avoid disease progression and prevent patients at high risk from developing cardiovascular and cerebrovascular events.
In the current study, abnormal ABI was detected in 28% of the studied children with T1DM, of which 85.7% had ABI < 0.9 and 14.3% had ABI higher than 1.2. Nattero-Chávez and colleagues reported an overall prevalence of PAD of 12.8% among children with T1DM [29]. Another study including adults with T1DM described a prevalence of PAD of 27.7% [32]. The high prevalence of subclinical PAD among this population highlights the importance of addressing its genetic determinants.
Overall, children with T1DM had significantly lower ABI than controls. Low ABI is known to be a strong predictor of cardiovascular morbidity and mortality in people with diabetes [33]. In agreement with the current results, Pastore and colleagues reported increased subclinical vascular diseases among children with T1DM compared to healthy controls manifested as reduced brachial artery flow-mediated dilatation reactivity and increased carotid–femoral pulse wave velocity [34].
Although the relation between T1DM and PAD is well established, the determinants of PAD among children with T1DM remains unclear. The proposed predictors of PAD include glycemic and lipid derangements, diabetes duration and hypertension, and male gender [4]. In the current study, PAD was found to be correlated with diabetes duration, insulin dose, and lipid derangements; interestingly, it was not correlated to HbA1C. This goes in line with the DCCT/EDIC study that observed that lowering HbA1c is not solely enough to reduce the rate of PAD in those at risk [5].
In the context of adipokines gene polymorphism, children with T1DM were found to have significantly higher GG chemerin and TT adiponectin gene polymorphisms than controls. The pro-inflammatory chemerin and the anti-inflammatory adiponectin gene polymorphisms have been investigated separately in obesity and T2DM. However, data about their role in T1DM is scarce and lacking. Perumalsamy and coworkers found a significant association between chemerin gene polymorphism and insulin resistance and cardiovascular disease among adults with T2DM [35]. Moreover, the frequency of the G allele of the chemerin rs17173608 polymorphism was found to be significantly higher in people with T2DM than in controls [36]. Regarding adiponectin rs1501299 polymorphism, it has been linked significantly to T1DM in adults [37]. In addition, Cui and coworkers found a significant association between adiponectin rs1501299 polymorphism and T2DM among adults [38].
Interestingly, children with T1DM having GG chemerin variant and those having TT adiponectin variant were found to have significantly higher cholesterol and significantly lower HDL-C than those having the other two variants. Chemerin expression and secretion are reported to increase significantly with adipogenesis. A previous study showed a significant relation between LDL and GG chemerin genotype among adults with metabolic syndrome [39].
Moreover, chemerin was previously reported to have a strong positive correlation with triglycerides, cholesterol, and LDL with a strong negative correlation with HDL-C [40]. As for adiponectin, a previous study by Tsuzaki and coworkers found that HDL-C was significantly and independently correlated with adiponectin and adiponectin rs1501299 G allele by multivariate regression analysis [41].
In the present study, adiponectin and chemerin gene polymorphism was found to be independently associated with PAD among children with T1DM, which suggests a possible role for these polymorphisms in the development of PAD among this population. This goes in agreement with the study by Kennedy and coworkers which identified increased expression of chemerin in atherosclerotic coronary arteries, aorta, and mesenteric arteries [42]. They found that mRNA and protein of chemerin receptors are widely expressed in smooth muscles and endothelial cells of human vessels, reinforcing the importance of their role in vasculature modulation. Interestingly, the expression of chemerin they found in the vascular smooth muscles is similar to that reported for adiponectin [43]. Moreover, adiponectin gene mutations were found to be strongly associated with impaired glucose tolerance, diabetes mellitus, and coronary artery disease in humans [44]. In mice, a high-fat and high-sucrose diet was found to cause marked elevation of plasma glucose and insulin levels, insulin resistance, and an increase in intimal smooth muscle cell proliferation in adiponectin knockout mice [45].
Conclusion
Subclinical PAD probably starts early in children with T1DM as denoted by abnormal ABI. This abnormal ABI is independently related to chemerin and adiponectin gene polymorphism.
Thus, chemerin and adiponectin gene polymorphisms could have a role in the pathogenesis of PAD among children with T1DM. Moreover, chemerin and adiponectin genes could be used as risk biomarkers for hyperlipidemia and vascular affection among children with T1DM.
Limitations of the study
The cross sectional nature of the study could not prove causality and the relatively small sample size. Therefore, further larger longitudinal studies are needed to identify the role of chemerin and adiponectin gene polymorphisms in predicting cytokine levels and PAD risk among children with T1DM.
The reference list from the paper itself. Each links out to its DOI / PubMed record.
- 1Schofield J Ho J Soran H Cardiovascular risk in type 1 diabetes mellitus Diabetes Ther 201910377378910.1007/s 13300-019-0612-831004282 PMC 6531592 · doi ↗ · pubmed ↗
- 2Soedamah-Muthu S Fuller J Mulnier H Raleigh V Lawrenson R Colhoun H High risk of cardiovascular disease in patients with type 1 diabetes in the U.K.: a cohort study using the general practice research database Diabetes Care 200629479880410.2337/diacare.29.04.0616567818 · doi ↗ · pubmed ↗
- 3Bjornstad P Donaghue KC Maahs DM Macrovascular disease and risk factors in youth with type 1 diabetes: time to be more attentive to treatment?Lancet Diabetes Endocrinol 201861080982010.1016/S 2213-8587(18)30035-429475800 PMC 6102087 · doi ↗ · pubmed ↗
- 4de Ferranti S Dde Boer IH Fonseca V Fox CS Golden SH Lavie CJ Magge SN Marx N Mc Guire DK Orchard TJ Zinman B Eckel RH Type 1 diabetes mellitus and cardiovascular disease: a scientific statement from the American Heart Association and American Diabetes Association Diabetes Care 201437102843286310.2337/dc 14-172025114297 PMC 4170130 · doi ↗ · pubmed ↗
- 5Carter RE Lackland DT Cleary PA Yim E Lopes-Virella M Gilbert G Orchard T The Diabetes Control and Complications Trial/Epidemiology of Diabetes Interventions and Complications (DCCT/EDIC) Study Research Group Diabetes Control and Complications Trial/Epidemiology of Diabetes Interventions and Complications (DCCT/EDIC) Study Research Group Intensive treatment of diabetes is associated with a reduced rate of peripheral arterial calcification in the Diabetes Control and Complications Trial Diabetes Care 200730264626 · doi ↗ · pubmed ↗
- 6Gerhard-Herman MD Gornik HL Barrett C Barshes NR Corriere MA Drachman DE Fleisher LA Fowkes FG Hamburg NM Kinlay S Marie D Lookstein R Misra S Mureebe L Olin J Patel R Regensteiner J Schanzer A Shishehbor M Stewart K Treat-Jacobson D Walsh MAHA/ACC guideline on the management of patients with lower extremity peripheral artery disease: a report of the American College of Cardiology/American Heart Association Task Force on Clinical Practice Guidelines Circulation 2017135 e 726e 77910.1161/CIR.000000000000047127840333 PMC 5477786 · doi ↗ · pubmed ↗
- 7Criqui M Matsushita K Aboyans V Hess C Hicks C Kwan T Mc Dermott M Misra S Ujueta F On behalf of the American Heart Association Council on Epidemiology and Prevention; Council on Arteriosclerosis, Thrombosis and Vascular Biology; Council on Cardiovascular Radiology and Intervention; Council on Lifestyle and Cardiometabolic Health; Council on Peripheral Vascular Disease; and Stroke Council Lower extremity peripheral artery disease: contemporary epidemiology, management gaps, and future directions: a scientific state · doi ↗ · pubmed ↗
- 8Liang W Ye D The potential of adipokines as biomarkers and therapeutic agents for vascular complications in type 2 diabetes mellitus Cytokine Growth Factor Rev 201948323910.1016/j.cytogfr.2019.06.00231229411 · doi ↗ · pubmed ↗