Percolation description of charge transport in amorphous oxide semiconductors
A. V. Nenashev, J. O. Oelerich, S. H. M. Greiner, A. V. Dvurechenskii,, F. Gebhard, and S. D. Baranovskii

TL;DR
This paper introduces a percolation-based theoretical framework for understanding charge transport in amorphous oxide semiconductors, addressing previous neglect of percolation effects and aligning theory with experimental data.
Contribution
It formulates a novel percolation approach for charge transport in AOS, demonstrating its superiority over prior models and extracting disorder parameters from experiments.
Findings
Percolation theory better explains charge transport in AOS.
The approach aligns well with experimental data.
Parameters of disorder potential are quantitatively identified.
Abstract
The charge transport mechanism in amorphous oxide semiconductors (AOS) is a matter of controversial debates. Most theoretical studies so far neglected the percolation nature of the phenomenon. In this article, a recipe for theoretical description of charge transport in AOSs is formulated using the percolation arguments. Comparison with the previous theoretical studies shows a superiority of the percolation approach. The results of the percolation theory are compared to experimental data obtained in various InGaZnO materials revealing parameters of the disorder potential in such AOS.
Click any figure to enlarge with its caption.
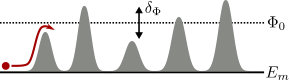 Figure 1
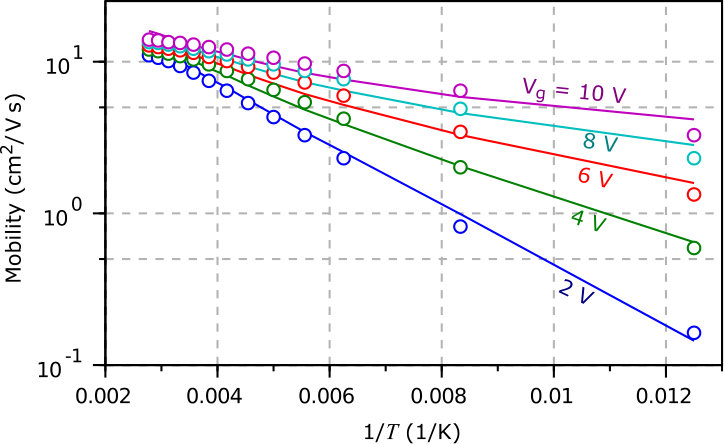 Figure 2
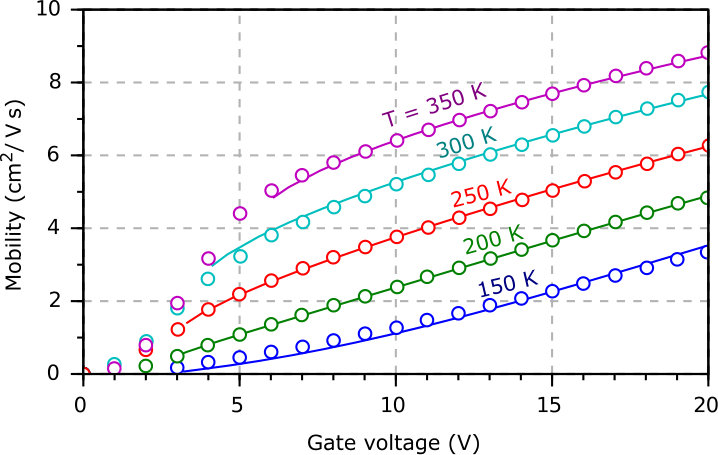 Figure 3
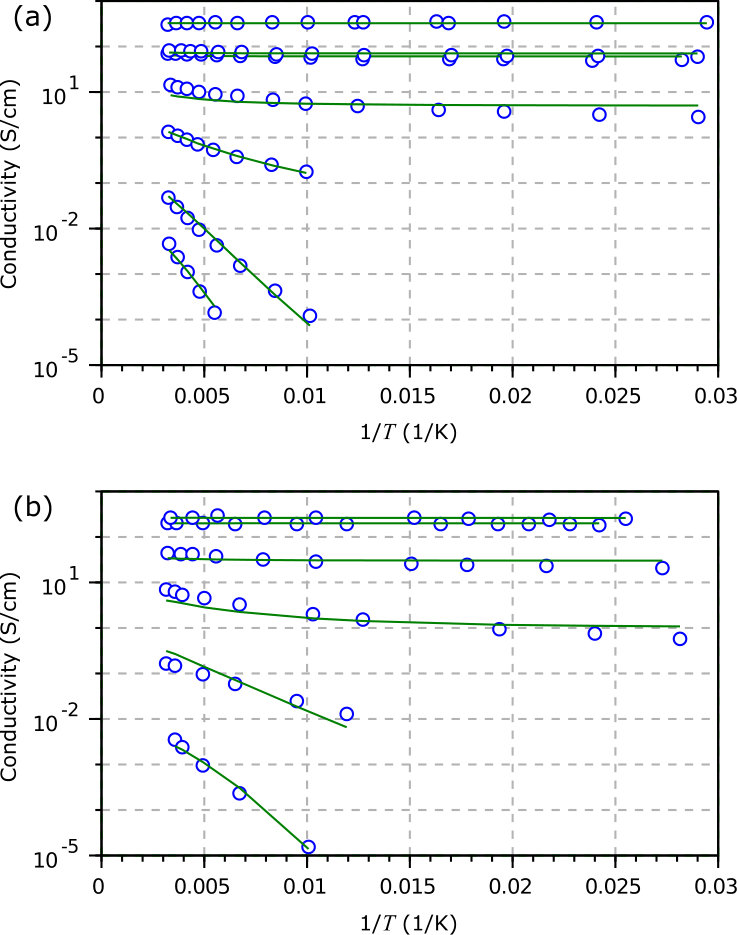 Figure 4
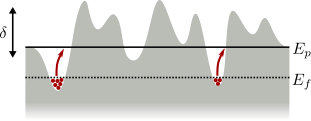 Figure 5
Peer Reviews
No public reviews on file for this paper yet. If you reviewed it on a platform where reviews are public (OpenReview, ICLR, NeurIPS, ICML), you can paste yours below so the community can read it here.
Videos
No videos yet. Explain this paper in a talk, walkthrough, or lecture? Add one.
Percolation description of charge transport in amorphous oxide semiconductors
A. V. Nenashev
Institute of Semiconductor Physics, 630090 Novosibirsk, Russia
Novosibirsk State University, 630090 Novosibirsk, Russia
J. O. Oelerich
Department of Physics and Material Sciences Center, Philipps-University, D-35032 Marburg, Germany
S. H. M. Greiner
Department of Physics and Material Sciences Center, Philipps-University, D-35032 Marburg, Germany
A. V. Dvurechenskii
Institute of Semiconductor Physics, 630090 Novosibirsk, Russia
Novosibirsk State University, 630090 Novosibirsk, Russia
F. Gebhard
Department of Physics and Material Sciences Center, Philipps-University, D-35032 Marburg, Germany
S. D. Baranovskii
Department of Physics and Material Sciences Center, Philipps-University, D-35032 Marburg, Germany
Abstract
The charge transport mechanism in amorphous oxide semiconductors (AOS) is a matter of controversial debates. Most theoretical studies so far neglected the percolation nature of the phenomenon. In this article, a recipe for theoretical description of charge transport in AOSs is formulated using the percolation arguments. Comparison with the previous theoretical studies shows a superiority of the percolation approach. The results of the percolation theory are compared to experimental data obtained in various InGaZnO materials revealing parameters of the disorder potential in such AOS.
pacs:
73.50.Fq,72.20.Jv,72.20.Ht,73.61.Jc,73.50.Gr
I Introduction
Amorphous oxide semiconductors such as InGaZnO (IGZO) systems are in the focus of intensive research due to applications of these materials in thin-film transistors for transparent and flexible flat-panel displays. Although charge transport plays a decisive role for such applications, there is no agreement on the basic transport mechanism. In particular, the percolation nature of charge transport inherent for electrical conduction in disordered materials has not been addressed properly thus far. In the present work, we develop a concise description of charge transport in AOS based on the percolation theory.
In solids, there are basically three distinct transport mechanisms, and all of them were suggested as possible candidates for charge transport in AOS. In the following, we discuss them briefly before we describe the random band-edge model that looks most plausible for amorphous oxide semiconductors.
I.1 Band transport via extended states in the random barrier model
In their pioneering works, Nomura et al. (2004); Kamiya et al. (2009); Takagi et al. (2005); Kamiya et al. (2010); Kimura et al. (2010) Hosono and collaborators proposed band transport via extended states as a possible transport mechanism in IGZO materials. They assumed that charge carriers can move above the band edge but their motion is affected by a disorder in the form of random potential barriers with a Gaussian distribution of heights,
[TABLE]
Here, is the average height of the barriers and is the standard deviation in the distribution of the barrier heights. This random barrier model is sketched in Fig. 1.
Charge transport in the random barrier model was described in the framework of the Drude approach that is based on the average relaxation time for free carriers in the states above the band edge . In this approximation, the carrier mobility is determined as , where is the effective mass. For the band transport in the absence of a disorder potential, the Drude approach leads to the expression Sze (1981)
[TABLE]
where is the concentration of carriers, is the momentum relaxation time at the electron energy , is the electron velocity along the transport direction ( axis), is the density of states above the band edge , and is the Fermi function.
In the presence of substantial disorder in AOS, the Drude approach is then modified heuristically by the introduction of the weight function Kamiya et al. (2010)
[TABLE]
which was termed “transmission probability”.Kamiya et al. (2010) The expression for the charge carrier mobility in AOS thus attains the form
[TABLE]
The introduction of the weight function into Eq. (4) was interpreted Kamiya et al. (2010) as taking into account the percolation arguments suggested by Adler et al. Adler et al. (1973). However, percolation has little to do with Eqs. (3) and (4), as is readily seen from the fact that the percolation threshold does not appear in the above equations. This feature will be discussed in Sec. III.
More importantly, if disorder creates potential barriers above the band edge as sketched in Fig. 1, it will also create potential wells below the band edge. The statistical distribution of these wells must be taken into account as well, which makes a regional, random quantity (random band-edge model). A description of charge transport based on percolation theory for the random band-edge model will be given in Sec. III.
I.2 Trap-limited band transport
Trap-limited transport in the spirit of the multiple–trapping (MT) model, has also been considered as a possible transport mechanism in AOS Park et al. (2010); Lee et al. (2010). In the MT process, the motion of charge carriers via delocalized states is interrupted by trapping into the localized states with subsequent activation of carriers back into the conducting states above the mobility edge.
The energy spectrum of localized states in the band tails of inorganic amorphous semiconductors is widely considered to exhibit a purely exponential shape,Mott and Davis (1979); Overhof and Thomas (1989); Street (1991); Baranovski (2006); Semeniuk et al. (2017)
[TABLE]
where is the energy of the trap counted from the band edge , is the energy scale, and is the density of localized states at the band edge .
Lee et al. Lee et al. (2010) used an extraction technique to determine the subgap density of states in an -channel amorphous InGaZnO (a-IGZO) thin-film transistor based on the study of the multifrequency capacitance-voltage (C–V) characteristics. They concluded that the subgap density of states is a superposition of two distinct coexisting exponential functions. Lee et al.Lee et al. (2011); Lee and Nathan (2012) combined the above models of band transport limited by potential barriers Nomura et al. (2004); Takagi et al. (2005); Kamiya et al. (2010); Kimura et al. (2010) and the multiple-trapping transport.Park et al. (2010); Lee et al. (2010) Consequently, they assume two distinct transport regimes in a thin-film-transistor based on AOS, depending on the concentration of carrier. At low gate voltages, i.e., at small carrier concentrations , the Fermi level lies in the manifold of the localized states, characterized by the density of states given by Eq. (5), with energies below the band edge . In this MT regime, the drift mobility of carriers is determined as
[TABLE]
where and are the free (above ) and trapped (below ) carrier densities, respectively, and is treated as the usual band mobility , “modulated by the percolation term”.Lee et al. (2011) Lee et al. Lee et al. (2011) mention that this term should be determined by the ratio between the potential barrier height and the average barrier width. Nevertheless, they use the relation between and , derived by the averaging of transition rates for overcoming potential barriers. The latter method has been, however, qualified as not appropriate for description of incoherent charge transport Shklovskii and Efros (1984); Baranovski (2006).
I.3 Hopping transport
The incoherent tunneling of charge carriers between localized states, distributed randomly in space and energy, also has been suggested as a possible charge transport mechanism in IGZO materials. Germs et al. (2012) A marginal admixture of band transport was also assumed in order to account for the Hall measurements. The theoretical analysis by Germs et al. Germs et al. (2012) is based on the concept of the transport energy . According to this approach, charge transport in a system with localized electron states is due to the activation of carriers from the Fermi level towards the vicinity of the transport energy.Grünewald and Thomas (1979); Monroe (1985); Baranovskii et al. (1995, 1997, 2000) The carrier mobility in this transport regime can be written as Baranovskii et al. (2002); Baranovski (2006); Baranovskii (2014); Nenashev et al. (2015)
[TABLE]
where is the transport energy and the prefactor depends on the concentration of carriers .
To fit the high values of the carrier mobility measured in IGZO materials, an unusually large value of the localization length in the tail states, , is needed in the model of hopping transport.Germs et al. (2012) This value exceeds by far the estimates for the localization length of carriers in the band tails of inorganic semiconductors.Mott and Davis (1979); Overhof and Thomas (1989); Street (1991); Baranovski (2006) Therefore, it appears unlikely that hopping transport is the dominant mechanism for charge transport in AOS.
I.4 Random band-edge model
Recently, Fishchuk et al. Fishchuk et al. (2016) addressed a model that combines band transport and localized band-tail states, though with a significant modification. While Kamiya et al. Kamiya et al. (2009, 2010) and Lee et al. Lee et al. (2011); Lee and Nathan (2012) assume the distribution of potential barriers of the form given by Eq. (1) above a global band edge , see Fig. 1, Fishchuk et al. Fishchuk et al. (2016) assume that the disorder potential causes random long-range variations of the band edge , as illustrated in Fig. 2. The spatial fluctuations of the band edge are assumed to be Gaussian with the distribution function Fishchuk et al. (2016)
[TABLE]
where is the standard deviation, and the position of the band edge is counted from the position of the band edge without disorder potential. In this work, we consider the random band-edge model suggested by Fishchuk et al. Fishchuk et al. (2016) as appropriate for the description of charge transport in AOS.
Fishchuk et al. Fishchuk et al. (2016) applied the effective-medium-approximation (EMA) to study theoretically charge transport. In contrast, we use percolation arguments to develop a theoretical description of charge transport in the random band-edge model. At , where is the thermal energy and is the scale of disorder in Eq. (8), the results of our percolation theory are reliable and they substantially differ from those of the EMA approach used previously Fishchuk et al. (2016), as shown in Sec. IV. Therefore, the percolation theory seems superior to the EMA for the description of charge transport within the random band-edge model.
I.5 Outline
In Sec. II, we describe in more detail the random band-edge model of Fishchuk et al. Fishchuk et al. (2016) that we employ for our study. In Sec. III, we show how to calculate the carrier mobility using percolation theory. In Sec. IV, we compare our percolation approach with the effective medium approximation. In Sec. V, we compare our theoretical results with experimental data. It is shown that percolation theory is capable to account for the dependencies of the charge carrier mobility on temperature and on the concentration of charge carriers in IGZO materials. Moreover, a comparison between the results of percolation theory with experimental data reveals the characteristic parameter of the band-edge disorder in Eq. (8) and the conduction-electron mobility .
II Random band-edge model for charge transport in AOS
The random band-edge model by Fishchuk et al. Fishchuk et al. (2016) assumes that the position of the band edge varies in space due to disorder potential. The distribution of values that belong to different spatial regions is characterized by the Gaussian distribution given by Eq. (8). This distribution in the regional positions of the band edge plays a crucial role in the rest of this paper.
For the sake of completeness, we also include localized states with energies below , whose density of states is assumed to be exponential, see Eq. (5), where the energy is counted from the band edge . Following Fishchuk et al. Fishchuk et al. (2016), we assume that the delocalized states with energies above are characterized by the density of states
[TABLE]
where the value has been reported for a-IGZO thin films.Kamiya et al. (2010) Equations (9) and (5) can be combined to the regional density of states
[TABLE]
where is the Heaviside step function. The first term on the right-hand side describes the density of delocalized states above , and the second term describes the density of localized states below . The energy shift in Eq. (9) guarantees the continuity of the density of states at when we choose .
For a given value of , one can find a corresponding regional electron density,
[TABLE]
where is the Fermi function,
[TABLE]
and is the Fermi level. The total electron density , averaged over the regional positions of the mobility edge , is
[TABLE]
For given temperature and electron concentration , the position of the Fermi level can be found from the system of equations (II)–(13).
The AOS material is assumed to be a medium with a smoothly varying regional conductivity , which is a product of the elementary charge , the conduction-band electron mobility , and the local concentration of mobile electrons (with energies above ),
[TABLE]
This assumption is justified when the electron mean-free path is small compared to the spatial scale for variations of .
The global (macroscopic) conductivity is to be found by some “averaging” of the regional values , taking into account the Gaussian distribution of the mobility edge , i.e., . When the global is found, one can calculate the (measured) mobility as
[TABLE]
In the case of an exponentially broad scatter of regional conductivities, a proper choice of the averaging procedure is crucial for a correct determination of the global conductivity . We will consider three methods of “averaging”: the first is based on the effective medium approximation, expressed by Eq. (31), see Sec. IV, the other two procedures are based on percolation theory expressed by Eqs. (19) and (25), see Sec. III.
For the experimentally accessible regions of the phase diagram of IGZO materials, Fishchuk et al. Fishchuk et al. (2016) have shown that the conductivity and the mobility depend on the carrier-concentration and the temperature mostly through the variations of the conduction-band edge , and are not limited by the localized states. Therefore, localized states might be disregarded in IGZO films.
III Percolation theory for charge transport in the random band-edge model
III.1 From regional to global conductivities in continuum percolation theory
The random band-edge model belongs to the class of continuum percolation problems.Shklovskii and Efros (1984) The transport is determined by charge carriers with energies above the percolation level , which is defined as the minimal energy that allows a transport path via connected regions with not exceeding .
Let denote the volume fraction of regions where the mobility edge is below ,
[TABLE]
The quantity
[TABLE]
plays the role of the dimensionless percolation threshold determined as the minimal volume fraction of the conducting material that enables electrical connection throughout the infinitely large sample. Numerical studies for Gaussian energy distributions with various spatial correlation properties yield the value for the three-dimensional continuum percolation problem.Shklovskii and Efros (1984) Using the value in Eq. (17), one obtains the value of the percolation level
[TABLE]
It remains to determine the macroscopic conductivity from the regional conductivities .
According to the percolation approach, regions with can be considered as isolated islands that are not connected with each other and, therefore, do not contribute to . The global conductivity depends only on those that obey . The simplest recipe to calculate on the basis of percolation theory is to average the regional conductivities over the regions where ,
[TABLE]
where is the Gaussian distribution of the local mobility edges . The mobility that corresponds to Eq. (19) can be expressed as
[TABLE]
where is the average concentration of mobile electrons in the regions with , and is the total electron concentration. It is easy to recognize that eq. (19) gives the correct value of the conductivity in the absence of disorder, .
Eq. (19) also gives the correct value in the opposite limit of very pronounced disorder, , for a non-degenerate occupation of states above , when the regional conductivities have an exponentially broad distribution of values. In this case, the Fermi function can be approximated as f(E)=\exp\big{[}(E_{f}-E)/kT\big{]} and Eq. (14) yields the exponential dependence
[TABLE]
where is the effective density of states in the conduction band,
[TABLE]
Inserting Eq. (21) into Eq. (19) gives the asymptotic expression for the carrier mobility
[TABLE]
At low temperatures, , the main contribution to the integral comes from the vicinity of the percolation level . Therefore, one can approximately replace by and take the constant factor out of the integral. The remaining integral is elementary and the carrier mobility given by Eq. (20) assumes its asymptotic form
[TABLE]
The exponential term in Eq. (24) shows that the charge transport is dominated by thermal activation of electrons to the percolation level , as schematically depicted in Fig. 2. More sophisticated considerations Shklovskii and Efros (1984); Nenashev et al. (2013) lead to a marginal correction of the pre-exponential factor in this equation. In fact, the pre-exponential factor should contain instead of where is the critical exponent for the correlation length of the percolation cluster.Wang et al. (2013); Hu et al. (2014); Koza and Poła (2016) Below, we will use Eq. (24) and ignore this marginal correction.
III.2 Averaging procedure by Adler et al.
In several theoretical studies of charge transport in AOS, the percolation approach suggested by Adler et al.Adler et al. (1973) has been invoked.Kamiya et al. (2010); Germs et al. (2011) Adler et al. Adler et al. (1973) considered a system with a Gaussian distribution of the regional band edges as given by Eq. (8). They suggested that the global conductivity can be obtained as
[TABLE]
Here is the contribution to the conductivity of carriers with energy ,
[TABLE]
where is some unspecified constant.
For a comparison with our approach in Sec. III.1, we analyze the conductivity from Eq. (25) when the Fermi level is far below the percolation level, and . Then, we can use the Boltzmann approximation f(E)\approx\exp\big{[}(E_{f}-E)/kT\big{]} and for the Fermi functions in Eqs. (25) and (26) in the non-degenerate case, leading to
[TABLE]
At low temperatures, , the major contribution to this integral comes from the region , providing . Using Eqs. (16) and (17), the factor \big{[}p(E)-\vartheta_{c}\big{]} can be simplified to
[TABLE]
Concomitantly, Eq. (27) simplifies to
[TABLE]
The integral is elementary. Using its value in Eq. (29), we obtain the asymptotic expression for the mobility
[TABLE]
A comparison of this expression with the result of percolation theory in Eq. (24) shows that the exponential term is correctly reproduced by Eq. (30). However, besides the unknown coefficient , Eq. (30) displays an incorrect temperature dependence of the pre-exponential factor due to the assumption of a quadratic energy dependence of the regional conductivity above the threshold, see Eq. (26).
The (global) band-edge in the random-barrier model, as described in Sec. I.1, and the percolation threshold are unrelated conceptually. However, the question remains: is it possible to interpret the energy level in the model sketched in Fig. 1 as the percolation level in Fig. 2 so that the random-barrier model can be viewed as part of the random band-edge model for energies above the percolation level, ? Unfortunately, this is not the case. First, the random-barrier model in Fig. 1 cannot contain a recipe on how to calculate the percolation level . Second, since is a regional feature determined by the distribution (8), one cannot consider the value in Eqs. (2) and (4) as if were uniform for the whole system. Therefore, an approach based on replacing in Fig. 1 by the percolation level would not make sense.
In Sec. V, we will compare the predictions of the percolation theory expressed by Eq. (19) with experimental data obtained by several experimental groups on the dependences of the carrier mobility on the carrier concentration and temperature in IGZO materials.Kamiya et al. (2009, 2010); Germs et al. (2012); Fishchuk et al. (2016). Before that we address in the next Sec. IV the relation between the results from percolation theory and those based on the effective-medium-approximation (EMA).
IV Comparison between percolation theory and EMA
The EMA and percolation theory are often considered as complementary to each other in their ability to account for charge transport in disordered systems. Percolation theory is considered to be valid for strongly disordered systems,Shklovskii and Efros (1984) while in systems with a weak disorder the EMA is often applied.Fishchuk et al. (2016) In fact, percolation theory gives reliable results not only for the case of strong disorder, , but also for the opposite case of , as discussed in Sec. III in the context of Eq. (19). Therefore, it is instructive to estimate the difference between the results of percolation theory and those of the EMA in the case of strong disorder.
In the EMA framework used by Fishchuk et al. Fishchuk et al. (2016) the conductivity was determined from its regional values via the equation
[TABLE]
where is the spatial dimension, and the angular brackets mean the averaging over the density distribution function
[TABLE]
To calculate the carrier mobility in the framework of the EMA, one should calculate the Fermi level from Eqs. (II)–(13), and then determine the dependence of the regional conductivity on the regional mobility edge , which then leads to the global conductivity via Eq. (31) and to the carrier mobility via Eq. (15).
Let us rewrite the averaging condition (31) in the following equivalent form in three dimensions, ,
[TABLE]
In the limit of low temperature and low electron concentration, the dependence of the regional conductivity on the regional conduction band edge is very steep, i.e., for almost all values of we have either or . In the first case, the expression inside the angular brackets in Eq. (33) is close to unity, in the second case, it is close to zero. Therefore,
[TABLE]
where is the value of that separates these two limits,
[TABLE]
Inserting Eq. (34) into Eq. (33), and using the rule of averaging (32), one can evaluate Eq. (33) as
[TABLE]
This equation defines the energy .
In the case of Gaussian distribution function , Eq. (8), the solution is
[TABLE]
With this value for , one can find the macroscopic conductivity from Eq. (35), where is to be calculated from Eq. (14). Inserting Eq. (21) into Eq. (35) provides the following asymptotic expression for the mobility ,
[TABLE]
The expression (38) is valid when , and .
According to Eq. (38) one can interpret the transport in the low-temperature and low-concentration case as thermal activation of electrons to the energy level . This result is to be compared with that of the percolation theory given by Eq. (24). Even if we ignore the differences in the pre-exponential factors we can conclude that the results given by Eqs. (38) and (24) differ by an exponential factor , which is essential for strong disorder, .
However, this result is specific to the present case and does not imply that the EMA framework always leads to an exponentially large error in the case of strong disorder. As has been shown in several studies,Nakamura (1984); Chen and Schuh (2006) one can achieve a better description of the conductivity within the EMA framework by replacing the spatial dimension with the inverse of the percolation threshold . However, conceptual improvements of the EMA are beyond the scope of our present study. Instead, in the next Sec. V we turn to a comparison between the results of percolation theory from Sec. III and experimental data.
V Comparison with experimental data
In this section, we show that the percolation approach developed in Sec. III and applied to the random band-edge model presented in Sec. II is able to reproduce experimental data on charge transport in InGaZnO materials. The main theoretical result to be compared with experimental data is Eq. (19) for the conductivity , as discussed in Sec. III. The regional conductivity in this equation is given by Eq. (14), where the regional density of states is taken in the form of Eq. (II) with . Following Ref. [Fishchuk et al., 2016], we take into account the distribution of the regional positions of the band edge in the form of Eq. (8), and neglect for simplicity the presence of localized states with energies below by setting . We address experimental data for the temperature dependencies of conductivity and mobility at different concentrations of charge carriers . The carrier concentration is changed experimentally either by varying the doping level,Kamiya et al. (2010) or by varying the gate voltage in the field-effect transistors.Lee and Nathan (2012); Germs et al. (2012); Fishchuk et al. (2016)
In their pioneering works,Kamiya et al. (2009, 2010) Kamiya et al. investigated two series of n-type IGZO films: crystalline (c-IGZO) and amorphous (a-IGZO). Samples of c-IGZO are crystalline materials but they contain inherent disorder due to the statistical distribution of Ga and Zn ions. Therefore, such materials are to be considered as disordered materials with respect to charge transport.Kamiya et al. (2010) In each series of the samples, the conductivity was measured varying the carrier concentrations between and .Kamiya et al. (2010)
Experimental data on the temperature dependencies of the conductivity are shown by circles in Fig. 3a for c-IGZO and in Fig. 3b for a-IGZO. These data are copied from Fig. 1b, and Fig. 1d of Ref. [Kamiya et al., 2010], respectively. Theoretical results given by Eq. (19) are shown in Fig. 3 by solid lines. These results are obtained by adjusting the band-edge disorder parameter in Eq. (8) and the conduction-band mobility , keeping these parameters fixed for each group of samples. Since the values of the carrier concentration in different samples were not exactly specified,Kamiya et al. (2010) we use as an adjustable parameter. Values for in the range between and give the best fits, in good agreement with experimental estimates.Kamiya et al. (2010) The parameters , , and are considered as independent of temperature. The values of and that provide the best fit to the experimental data are , for c-IGZO, and , for a-IGZO.
Another set of experimental data to be compared with theoretical predictions is related to the carrier mobility measured in thin-film transistors with IGZO channels.Germs et al. (2012); Fishchuk et al. (2016) In Fig. 4, experimental data for the dependencies of on the gate voltage at different temperatures are reproduced from Ref. [Germs et al., 2012] as depicted by circles. Solid lines are the theoretical results for , where is obtained from Eq. (19). The carrier concentration is assumed linearly dependent on the gate voltage ,
[TABLE]
where the proportionality constant serves as a fitting parameter. It depends on the relative capacitance between the gate and the channel and on the thickness of the electron accumulation layer. The value gives the best fit. Following Ref. [Germs et al., 2012], the experimental gate voltage is counted from its threshold value. The flat-band voltage is also considered as an adjustable parameter. The values are used for , respectively. The best fits to the experimental data in Fig. 4 are achieved by choosing the band-edge disorder parameter in Eq. (8) and the conduction-band mobility .
Experimental data on the carrier mobility in a-IGZO thin-film transistors, analogous to those in Fig. 4, were obtained by Fishchuk et al. Fishchuk et al. (2016) who converted the data into at different gate voltages . The data are shown by circles in Fig. 5. Solid lines are fits to Eq. (19). The temperature dependence of in Eq. (39) is taken from Ref. [Fishchuk et al., 2016], . The value gives the best fit. The best agreement with experimental data in Fig. 5 is achieved by choosing the band-edge disorder parameter in Eq. (8) and the conduction-band mobility . These values are close to the values and /(Vs) obtained by Fishchuk et al. Fishchuk et al. (2016) from a comparison of their experimental data and their theory based on the EMA. This evidences that there is not much difference between the results of the percolation theory and those of the EMA for the range of parameters , , , and relevant to the experimental situation studied in Ref. [Fishchuk et al., 2016].
For a fairly small range of parameters, and for the band-edge disorder parameter in Eq. (8) and the conduction-band mobility , percolation theory reliably reproduces different sets of experimental data in IGZO materials over a broad range of temperatures and charge carrier densities.
VI Conclusions
Theoretical approach based on the percolation theory is developed to describe charge transport in amorphous oxide semiconductors in the framework of the random band-edge model that takes into account the effect of disorder on the regional position of the band edge . For the case of a Gaussian distribution for , the superiority of the percolation approach is proven in comparison with previously used averaging schemes. Our percolation approach reproduces experimental data on charge transport in IGZO materials obtained by several groups. The comparison between theoretical results and experimental data reveals the energy scale of disorder in such materials.
Acknowledgements.
The authors are indebted to Prof. A. Kadashchuk and to Prof. H. Hosono for bringing their attention to the problem of charge transport in AOS. Financial support of the Deutsche Forschungsgemeinschaft (GRK 1782) is gratefully acknowledged.
The reference list from the paper itself. Each links out to its DOI / PubMed record.
- 1Nomura et al. (2004) K. Nomura, H. Ohta, A. Takagi, T. Kamiya, M. Hirano, and H. Hosono, Nature 432 , 488 (2004).
- 2Kamiya et al. (2009) T. Kamiya, K. Nomura, and H. Hosono, J. Disp. Technol. 5 , 462 (2009).
- 3Takagi et al. (2005) A. Takagi, K. Nomura, H. Ohta, H. Yanagi, T. Kamiya, M. Hirano, and H. Hosono, Thin Solid Films 486 , 38 (2005) . · doi ↗
- 4Kamiya et al. (2010) T. Kamiya, K. Nomura, and H. Hosono, Appl. Phys. Lett. 96 , 122103 (2010) . · doi ↗
- 5Kimura et al. (2010) M. Kimura, T. Kamiya, T. Nakanishi, K. Nomura, and H. Hosono, Appl. Phys. Lett. 96 , 262105 (2010) . · doi ↗
- 6Sze (1981) S. M. Sze, Physics of Semiconductor Devices , 2nd ed. (Wiley, New York, 1981).
- 7Adler et al. (1973) D. Adler, L. P. Flora, and S. D. Sentuna, Solid State Commun. 12 , 9 (1973).
- 8Park et al. (2010) J.-H. Park, K. Jeon, S. Lee, S. Kim, S. Kim, I. Song, J. Park, Y. Park, C. J. Kim, D. M. Kim, and D. H. Kim, J. Electrochem. Soc. 157 , H 272 (2010).