Coverage Analysis of 3-D Dense Cellular Networks with Realistic Propagation Conditions
Aritra Chatterjee, Suvra Sekhar Das

TL;DR
This paper models 3D dense cellular networks using realistic LOS/NLOS propagation and stochastic geometry, providing tight coverage probability bounds and analyzing the impact of user density on network performance.
Contribution
It introduces a 3D spatial Poisson point process model with realistic propagation effects, bridging the gap in existing 2D models for dense cellular networks.
Findings
Derived a tight upper bound for coverage probability.
Analyzed the impact of UE density on coverage.
Modeled AP activity probabilistically based on densities.
Abstract
In recent times, the use of stochastic geometry has become a popular and important tool for performance analysis of next-generation dense small cell wireless networks. Usually, such networks are modeled using 2 dimensional spatial Poisson point processes (SPPP). Moreover, the distinctive effects of line-of-sight (LOS) and non-line-of-sight (NLOS) propagation are also not explicitly taken into account in such analysis. The aim of the current work is to bridge this gap by modeling the access point (AP) and user equipment (UE) locations by 3-dimensional SPPP and considering the realistic LOS/NLOS channel models (path loss and small scale fading) as reported in existing standards. The effect of UE density on downlink coverage probability has also been investigated. In this process, the probabilistic activity of APs has been analytically modeled as a function of AP and UE densities. The…
Click any figure to enlarge with its caption.
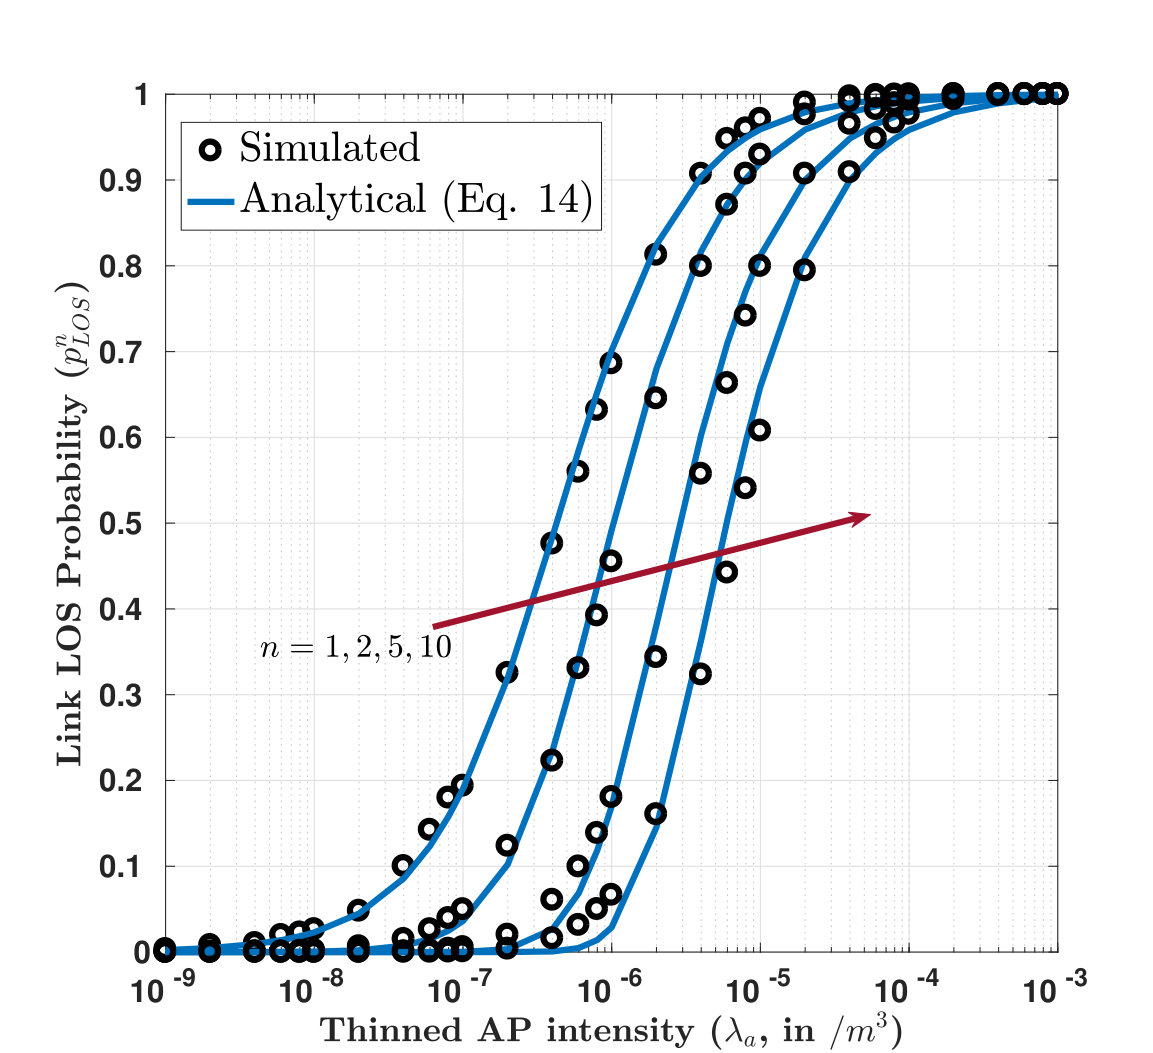 Figure 1
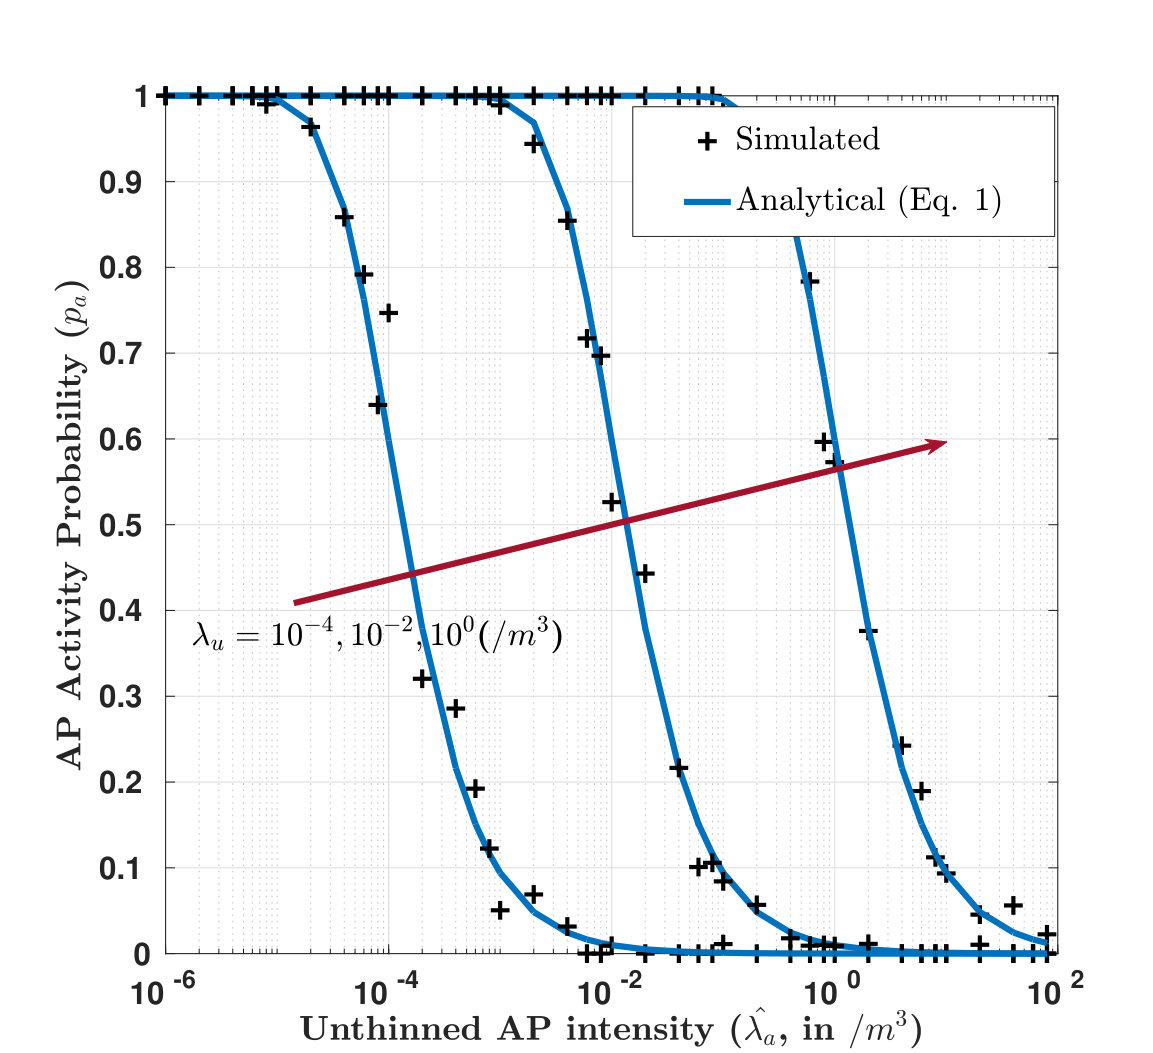 Figure 2
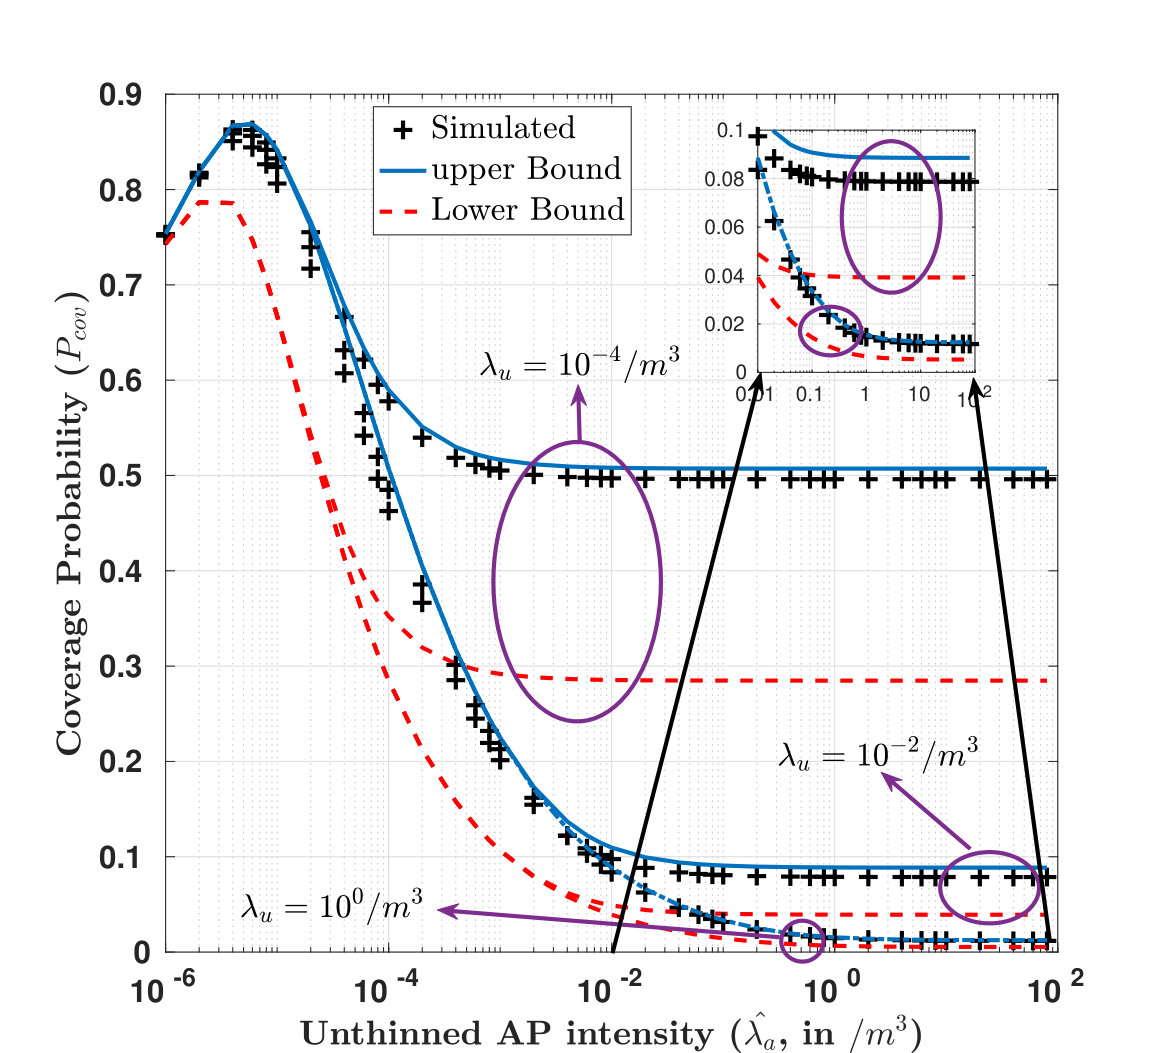 Figure 3
Peer Reviews
No public reviews on file for this paper yet. If you reviewed it on a platform where reviews are public (OpenReview, ICLR, NeurIPS, ICML), you can paste yours below so the community can read it here.
Videos
No videos yet. Explain this paper in a talk, walkthrough, or lecture? Add one.
Taxonomy
TopicsAdvanced MIMO Systems Optimization · Millimeter-Wave Propagation and Modeling · Advanced Wireless Communication Technologies
Coverage Analysis of 3-D Dense Cellular Networks with Realistic Propagation Conditions
Aritra Chatterjee, and Suvra Sekhar Das
Indian Institute of Technology, Kharagpur, India
Abstract
In recent times, use of stochastic geometry has become a popular and important tool for performance analysis of next generation dense small cell wireless networks. Usually such networks are modeled using 2 dimensional spatial Poisson point processes (SPPP). Moreover, the distinctive effects of line-of-sight (LOS) and non line-of-sight (NLOS) propagation are also not explicitly taken into account in such analysis. The aim of the current work is to bridge this gap by modeling the access point (AP) and user equipment (UE) locations by 3 dimensional SPPP and considering the realistic LOS/NLOS channel models (path loss and small scale fading) as reported in existing standards. The effect of UE density on downlink coverage probability has also been investigated. In this process, the probabilistic activity of APs has been analytically modeled as a function of AP and UE densities. The derived upper bound of coverage probability is found to be numerically simple as well as extremely tight in nature, and thus can be used as a close approximate of the same.
Index Terms:
3-D Spatial Poisson Point Process (SPPP), LOS/NLOS, Coverage Probability, Stochastic Geometry.
PPP Poisson Point Process SPPP Spatial Poisson Point Process UDN Ultra Dense Networks AP Access Points UE User Equipments PL Path Loss LOS Line of Sight NLOS Non-Line of Sight RV random variable PDF probability density function CCDF complimentary cumulative distribution function CDF cumulative distribution function NSE network spectral efficiency NEE network energy efficiency RAN Radio Access Network SCN Small Cell Networks PGFL Probability Generating Functional SSF small scale fading LSF large scale fading
I Introduction
Densification of Access Points (AP) and decentralization of cellular network infrastructure has already been identified as potential weapon to cater the ever-increasing customer demands in future generation wireless Radio Access Network (RAN) [1]. In recent times, the locations of APs/ User Equipments (UE) in such heterogeneous Small Cell Networks (SCN) have been modeled as random Spatial Poisson Point Process (SPPP) [2]. The performances of such networks has been analytically evaluated using tools from stochastic geometry.
In one of the earliest works, an information theoretic approach, named “Wyner Model” has been used where the AP locations are modeled as 1-dimensional (1-D) point process [3]. Although the method is analytically tractable, it is significantly oversimplified due to the 1-D AP location modeling and assuming unit power received from each AP to the user. In the seminal work [4], the AP locations are modeled as 2-D SPPP. The downlink coverage probability and ergodic rate experienced by a typical UE have been evaluated using important tools of stochastic geometry like Probability Generating Functional (PGFL). The coverage probability expression yields to extremely simple closed-form for specific special case like no-noise and path loss exponent equaling 4. However, the channel model used in this work is simple single slope Path Loss (PL) with exponential distributed small scale fading (SSF).
The 2-D modeling of AP locations is based on the assumption that the inter-AP distances and distances from the UE and neighboring APs are much larger than the height at which the APs/UEs are mounted. This assumption remains valid for moderately dense networks, but not in scenarios like dense urban or dense indoor hotspot and especially in case of Ultra Dense Networks (UDN). Consequently, in recently times, several works have been presented where SPPPs of more than 2 dimensions are used [5, 6, 7]. In [5], the SPPP is considered to be defined in an upper hemispheric space (). Dual slope path loss model has been considered to capture distinctive propagation loss effects of Line of Sight (LOS) and Non-Line of Sight (NLOS) cases. However, the SSF has been modeled as exponentially distributed for both the cases, making the analysis simplified but not in line with practical scenario. In [6], the downlink performances of a single tier SCN modeled by 3-D SPPP has been presented, whereas in [7], the analysis is extended to multiple tiers of APs. In both the works, single slope PL along with only exponential SSF have been considered, which limits their applicability to understand the performance of dense urban/indoor scenarios where both LOS/NLOS propagation are prevalent. The notion of differentiated propagation loss in LOS and NLOS has been partially taken into account in [8, 9, 10] in a 2-D SPPP modeled SCN. Whereas [8] presented a simulation based study, effect of dual slope path loss corresponding to LOS and NLOS propagation has been captured analytically in [9, 10]. However, the SSF in both kind of propagation is considered to be exponentially distributed, making the analysis oversimplified and far from realistic phenomenon. In recently published [11], effect of LOS/NLOS propagation has been captured for SCN modeled by 2-D SPPP with a fixed AP height. However, such analysis does not account for randomness in elevation domain and thus cannot be used to understand the performance “multi-floor” dense indoor scenarios. Moreover, the derived expression of coverage probability is numerically complex is nature and thus is not suitable for further analysis. So, to summarize, it can be observed that the existing literature either do not consider the random location modeling of network nodes in 3-D, or even if they do, do not properly take into consideration the realistic propagation losses in LOS and NLOS links.
Moreover, in the existing literature described above, the effect of UE location distibution and UE density have not been explicitly captured in evaluation of downlink system performance. Whereas, one of the most distinctive feature of future generation UDN has been identified as comparable AP and UE density [12]. Such system configuration results in inhomogeneous inactivity of some APs whose effect are yet to be captured in SCN modeled by 3-D SPPP.
In light of the existing state-of-the-art and gaps therein, the main contributions of this work can be summarized as follows:
- •
A holistic system model representing a dense co-channel urban/indoor RAN has been developed to include the realistic propagation effects of SSF (LOS/NLOS), two-slope distance-dependent PL, interferer activity closely following realistic channel models described in [13] where the locations of both AP/UE are modeled as 3-D SPPP.
- •
The activity of APs are analytically modeled as a function of AP and UE density for such a 3-D network (Lemma 1).
- •
Numerically simpler upper and lower bounds of downlink coverage probability have been evaluated considering all above mentioned effects (Theorem 1). The upper bound is found to be extremely tight and thus can be used as a close approximation of coverage probability.
II System Model and Assumptions
II-A Network Model
The cellular network model with small cell APs are considered to be arranged according to a homogeneous SPPP with intensity defined in . The UEs are also considered to be distributed according to another homogeneous SPPP with intensity defined in . The processes and are considered to be mutually independent in this work, whereas the dependence of these processes and its effect can be explored in future. Furthermore, The UEs are considered to be associated with closest APs [4], thus resulting in the coverage regions becoming a -D Voronoi tessellation.
As in this work is considered to be comparable or even less than which is a distinguishable property of UDN [12], some APs can be in inactive mode without any UE under their coverage. Let the activity probability of an AP is denoted by . The value of depends on the intensity functions of the SPPPs representing the spatial distributions of AP and UE, as derived in Lemma 1.
Lemma 1**.**
For the APs distributed according to with intensity serving UEs distributed according to with intensity with ‘closest AP association rule’, the activity probability () is given by:
[TABLE]
The proof of the lemma is provided in Appendix A.
Let represents the point process for the active APs. Although theoretically is not a homogeneous SPPP due to the fact that the points from the process are not obtained independently of each other [10, Sec. 3.5.2], it has been shown in [14] that the homogeneous SPPP obtained by thinning of can efficiently approximate . Thus, using Thinning theorem [15], the resulting SPPP has intensity .
II-B Channel Model
In this work we consider that the APs transmit with single isotropic antenna with transmit power to UEs with single isotropic antenna. Use of multiple and directional antennas at both APs and UEs can be seen as a potential future work. In this work, the links between the UE and serving as well as interfering APs can be LOS or NLOS depending on the following distance-dependent LOS probability model as proposed by 3GPP for picocell environment [13, Table A.2.1.1.2-3]:
[TABLE]
Clearly, the expression does not offer tractability for mathematical analysis. Therefore, several simple approximations of (2) have been proposed in literature [9, Sec. II.B]. In this work, we use the following approximation which simultaneously offer close match with (2) along with mathematical tractability:
[TABLE]
In this work we consider the following distance-dependent two-slope PL model in order to represent both LOS and NLOS links:
[TABLE]
where, and represent path loss exponents in LOS and NLOS links respectively; and represent the path loss at unit distance () for LOS and NLOS links respectively.
We represent the small scale power fading terms in NLOS and LOS links by and respectively. We assume that in NLOS links, propagation is affected by Rayleigh fading, making . In LOS links, the small scale fading is characterized by nakagami- distribution, making follow normalized Gamma distribution with shape parameter ().
Without lack of generality we consider a typical user located at origin. Full frequency reuse has been considered among all the APs. It has been assumed that the UE is attached with an AP situated at , with other APs at locations acting as interferers (). Considering an interference-limited scenario applicable for dense networks, the received SIR (denoted by ) experienced by the UE can be written as:
[TABLE]
where and representing LOS indicator Bernoulli random variable (RV) with following probability mass function: and .
III Analysis of Network Performance and Main Results
Let, from the target UE , the distance to the -th nearest AP is denoted by . The distribution of follows the probability density function (PDF) [16, Sec. 3.2.2, Eq. (23)]:
[TABLE]
Putting in (6), the PDF of the distance from target UE to the serving AP, denoted by is given by:
[TABLE]
Lemma 2**.**
The probability that the link to the target UE from the -th nearest AP belonging to from it experiences LOS condition can be approximated as:
[TABLE]
Proof.
From the definition of LOS probability made in (2), probability that the link from the UE to -th nearest AP is LOS given that its length equals . Now, using the property of conditional probability, it can be written that:
[TABLE]
Using (7) and invoking the approximation made in (3), (9) can be rewritten as:
[TABLE]
Using the substitution: , (10) can be rewritten as:
[TABLE]
Simple algebraic manipulations of (11) finally results in (8). ∎
- Remark
The probability that the link between the target UE and its serving AP is given by: p^{n}_{LOS}\approx\big{(}\frac{4\pi\lambda_{a}L^{3}}{3+4\pi\lambda_{a}L^{3}}\big{)}. Putting in Lemma 2 gives this result.
III-A Bounds of Coverage probability
The coverage probability () experienced by UE can be defined as: , where is a predefined SIR threshold. Using the SIR expression given in (5), the average coverage probability experienced by the particular UE is given by:
[TABLE]
where denotes the aggregate interference power received at the UE. Using the fact that , it can be written that
[TABLE]
where denotes the Laplace transform of and is defined as .
Lemma 3**.**
*In a 3-D network described in Sec. II in presence of both LOS and NLOS propagation, the Laplace transform of aggregate interference is given by: *
[TABLE]
The proof of (14) has been provided in Appendix B.
As , according to the derivation provided in [11, Theorem 1], it can be written that:
[TABLE]
Applying (13) and (15) in (12) with the aid of (14), it can be clearly understood that the exact expression of involves successive differentiation of , upto the order of , making it numerically intractable and cumbersome to evaluate. Therefore, in the following theorem, numerically simpler upper and lower bounds of have been derived.
Theorem 1**.**
The coverage probability () of atypical UE in the downlink cellular network described in Sec II can be bounded as shown in (1), where .
Proof.
For a normalized Gamma distributed random variable with shape parameter , its cumulative distribution function (CDF) can be formulated as:
[TABLE]
where is the lower incomplete Gamma function defined as:
[TABLE]
From [17, Theo. 1] and using the fact that , following inequality can be written:
[TABLE]
where and if . Using the substitution (which ensures , as for all practical scenarios, ), (19) can be rewritten as:
[TABLE]
Finally, using the substitution and using (17), (20) can be rewritten as:
[TABLE]
Putting (III-A) in (12) due to the fact that is a normalized Gamma function with shape parameter and using Binomial theorem, (1) can be obtained. ∎
In the later sections, it has been shown that the upper bound provided in (1) is extremely tight and thus can be used as a close approximate of .
IV Numerical Results and Discussions
In this section we show the accuracy of the analytical results obtained in Sec. III by comparing them with the ones obtained from Monte-Carlo simulation. The path loss parameters for LOS and NLOS links are chosen by following realistic channel models prescribed in [13, Table A.2.1.1.2-3] and listed in Table I along with other key system parameters. It is worth noting that for LOS links, no typical value of has been provided in measurement campaigns. In this work we consider = 3, although the analytical framework is generic to accommodate any other value of as well. The SIR threshold for coverage () is assumed to be dB, however the work is generic to accommodate any other value.
IV-A Validation of Lemma 1
In Fig 1 the accuracy of Lemma 1 has been shown in comparison with results obtained from Monte-Carlo simulation for a wide range of and . The obtained closed match between the simulated and analytically obtained curves shows the usability of Eq. (1) for further analysis. The nature of activity probability () curves are intuitive in nature. For a given UE intensity (), with increase in AP intensity (), decreases, due to the fact that for each UE, number of candidate APs increases, therefore resulting in inactivity of some APs. On the other hand, for a given , with increase in (from to ), increases due to the fact that in order to cater to increasing service deman, more and more APs need to be kept in ‘active’ state.
IV-B Validation of Lemma 2
The analytical correctness of Lemma 2 has been exhibited in Fig. 2, where the numerical values of have been compared to the ones obtained from simulation for a wide range of and . The observed close match between the siulated and analytical results proves the correctness of Eq. (8). By analyzing the LOS probability curves, it can be seen that for any specific , with increase in , probability that the link becomes LOS increases. This is primarily due to the fact that with more densification of APs, expected length of such links reduces, resulting in increase in . On the other hand for a specific , decreases with increase in due to the fact that the expected length increases with increase in , resulting in decrease in LOS probability. Note that in Fig. 2, the curve of has been shown for an extended range of (-). This is due to show the accuracy of (8) for the whole range of (0-1).
IV-C Validation of Theorem 1 and Main Result
The analytical acceptance of the derived upper and lower bounds of downlink coverage probability obtained in Theorem 1 has been shown in Fig. 3 by comparing them with results obtained from Monte-Carlo simulation for a wide range of AP intensity () for low, moderate and high UE intensity (). By observing the result, it can be inferred that the theoretical upper bound is extremely tight in nature for the whole range of system parameters. However, the derived lower bound is loose in nature.
The plotted curves of also reveal important impact of LOS/NLOS propagation. For the lower range of , we observe an increasing trend of until it reaches a maximum level. In this range of , the link between the UE and the serving (nearest) AP is in LOS condition. Whereas, most of the interferer links are in NLOS condition. After reaching the maximum limit, the coverage probability decreases monotonically with further increase in , due to the fact that the interfering APs also start to enter LOS zone, thus increasing the aggregate interference power at a higher rate than the rate at which the desired power increases. Finally, at further higher range of , the coverage probability remains broadly unchanged, due to the fact that in such scenarios, all the desired and interfering APs reside in LOS zone, and adding more and more APs does not affect much in the resulting SIR. It has also been observed that with increase in (from to ), coverage probability decreases, due to the fact as UE density increases, the AP activity probability increases, resulting in increase in number of interfering AP and subsequently aggregate interference power, which finally reduces SIR.
V Conclusions
In this work, analytical upper and lower bounds of downlink coverage probability experienced by a typical UE in a 3-D heterogeneous SCN described by homogeneous SPPP. In this analysis, the holistic effects of LOS/NLOS propagation in terms of realistic link LOS probability, two-slope PL along with SSF have been considered. The derived upper bound is shown to be numerically simpler as well as extremely tight in nature compared to the exact simulated coverage probability and thus can be used as a close approximate of the same. Thus, the presented result can further be used in solving emerging RAN design issues like area spectral/energy efficiency evaluation/maximization, AP density optimization etc.
Appendix A Proof of Lemma 1
For SPPP , the Voronoi cells’ volume () distribution can be approximated as [18, Eq. 11]
[TABLE]
From the property of UE SPPP , no UE will lie in a Voronoi cell of volume with probability . So, the average void probability in 3D SPPP () is given by:
[TABLE]
Thus, the activity probability () of APs (i.e. probability that at least one UE will lie in the Voronoi cell and thus be under its coverage) can be written as:
[TABLE]
Appendix B Proof of Lemma 3
From the definition of Laplace transform of , can be expressed as (V) at the top of the next page, where step (a) follows from the PGFL of 3-D SPPP [15, 6, 7], which states that for some function , \mathbb{E}_{\Phi_{a}}[\Pi_{x\in\Phi_{a}\textbackslash\{x_{0}\}}f(x)]=\exp\big{(}-4\pi\lambda_{a}\int_{r}^{\infty}[1-f(x)]x^{2}{\rm d}x\big{)} and rearranging the terms. Recalling that and , it can be written that:
[TABLE]
The reference list from the paper itself. Each links out to its DOI / PubMed record.
- 1[1] J. G. Andrews et al. , “What Will 5G Be?” IEEE Journal on Selected Areas of Communications , vol. 32, no. 6, pp. 1065–1082, June 2014.
- 2[2] H. El Sawy, E. Hossain, and M. Haenggi, “Stochastic geometry for modeling, analysis, and design of multi-tier and cognitive cellular wireless networks: A survey,” IEEE Communications Surveys & Tutorials , vol. 15, no. 3, pp. 996–1019, 2013.
- 3[3] S. Shamai and A. D. Wyner, “Information-theoretic considerations for symmetric, cellular, multiple-access fading channels - part I & II.” IEEE Transactions on Information Theory , vol. 43, no. 6, pp. 1877–1911, 1997.
- 4[4] J. G. Andrews, F. Baccelli, and R. K. Ganti, “A tractable approach to coverage and rate in cellular networks,” IEEE Transactions on communications , vol. 59, no. 11, pp. 3122–3134, 2011.
- 5[5] A. K. Gupta, X. Zhang, and J. G. Andrews, “Sinr and throughput scaling in ultradense urban cellular networks,” IEEE Wireless Communications Letters , vol. 4, no. 6, pp. 605–608, 2015.
- 6[6] Z. Pan and Q. Zhu, “Modeling and analysis of coverage in 3-D cellular networks,” IEEE Communications Letters , vol. 19, no. 5, pp. 831–834, 2015.
- 7[7] A. Omri and M. O. Hasna, “Modelling and performance analysis of 3-d heterogeneous cellular networks,” in Communications (ICC), 2016 IEEE International Conference on . IEEE, 2016, pp. 1–5.
- 8[8] C. Galiotto, I. Gomez-Miguelez, N. Marchetti, and L. Doyle, “Effect of los/nlos propagation on area spectral efficiency and energy efficiency of small-cells,” in 2014 IEEE Global Communications Conference . IEEE, 2014, pp. 3471–3476.